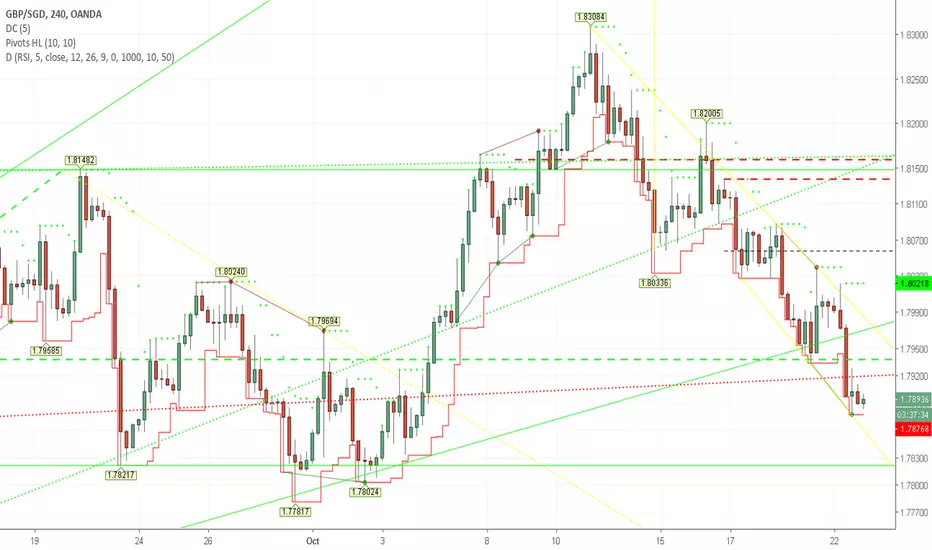
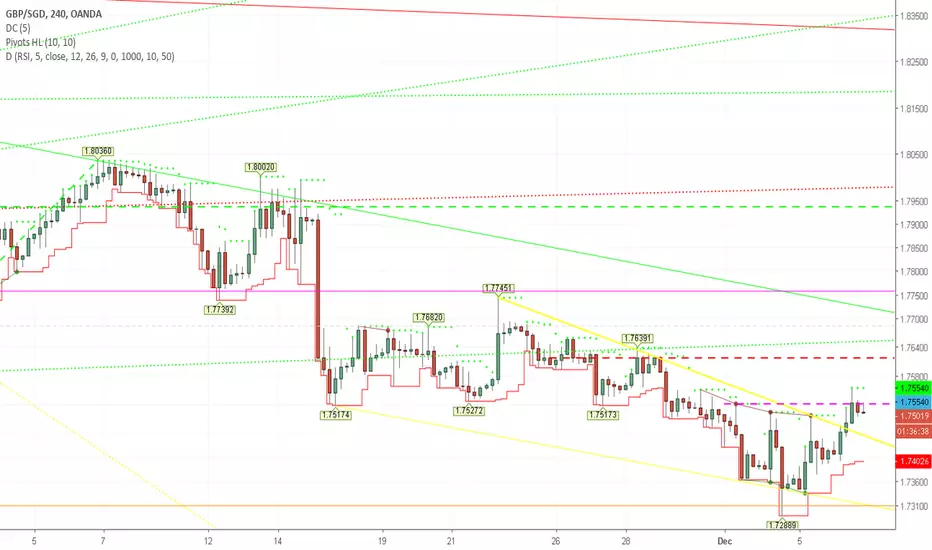
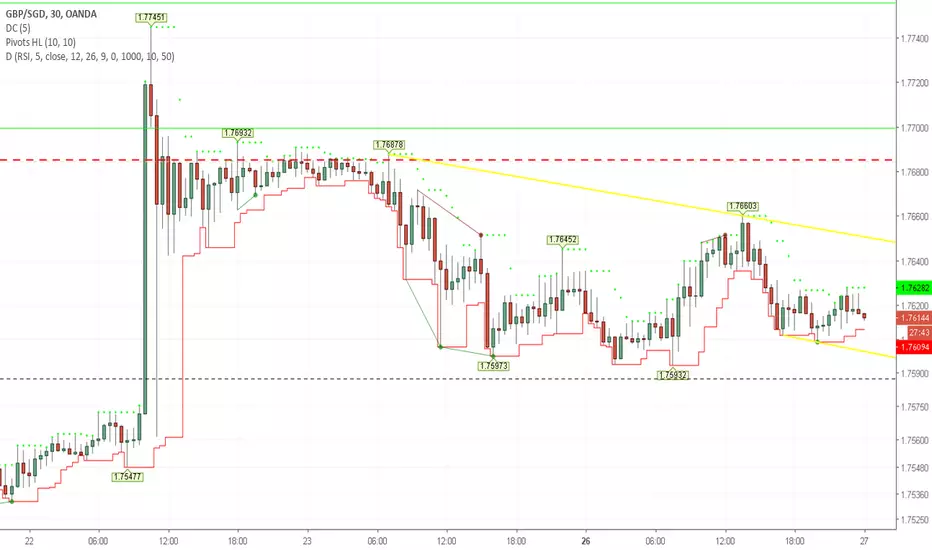
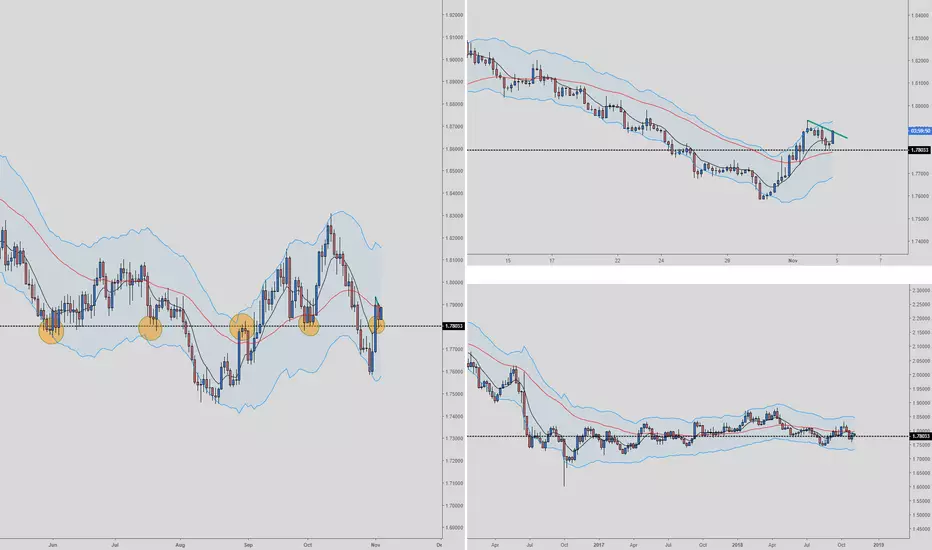
GBP SGD Forecast: Intraday Timeframe AnalysisThe Conclusion for today’s GBP SGD forecast: Current price swing should reach between 1.77324 and 1.76335. Resistance is offered by the upper boundary of the bearish channel at ~1.80192 upon price closing above 1.77324.
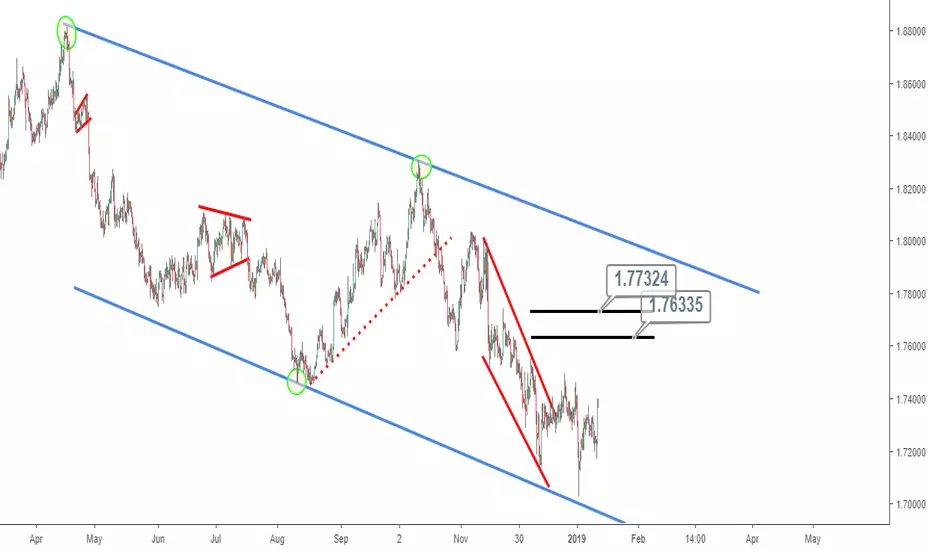
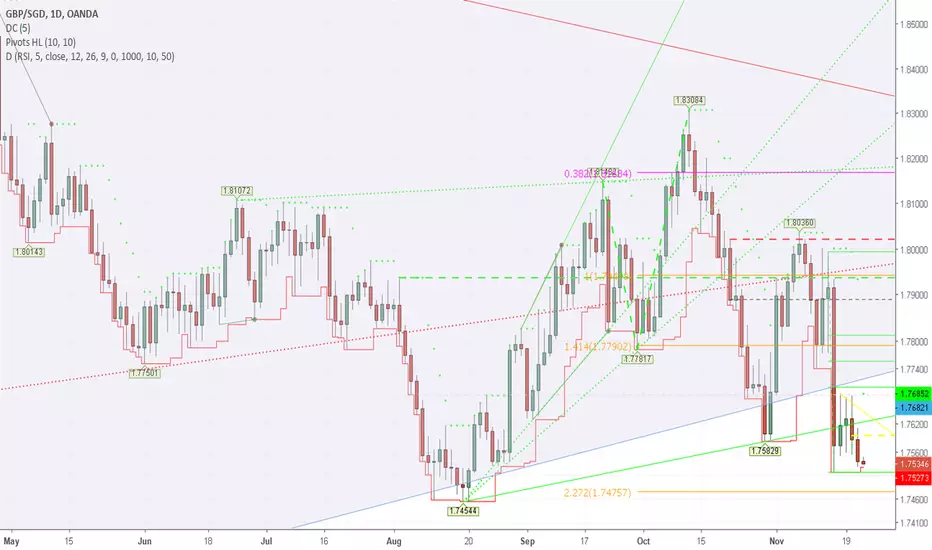
Over 8 months of price action is investigated on the 4 hour timeframe of the GBPSGD from a price peak on April 17, 2018 to current date. A bearish price channel is used to capture price action for the duration mentioned, with 1.69961 marking the bottom of the channel.
1.77324 and 1.76335 offers resistance for price and therefore price retesting the 1.69961.
A break above the upper boundary of the resistance also needs to be considered as it presents the potential for price to target ~1.80192 which is the extreme of the bearish channel to the upside.
GBPSGD trade ideas
GBPSGD Butterfly Pattern plus MACD DivergenceI'm fairly new to all of this so take that into consideration but the butterfly pattern plus MACD divergence.

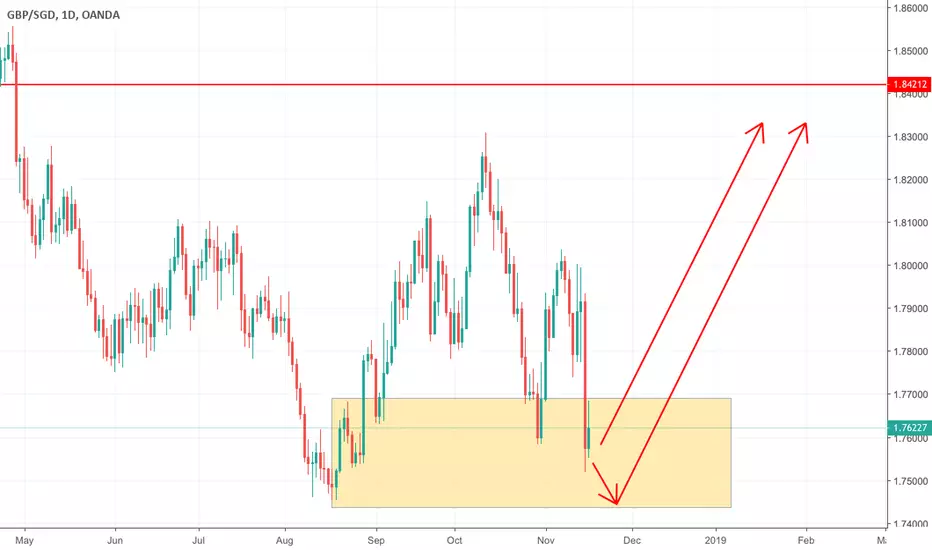
GBPSGD Buy IdeaGBPSGD Buy Idea @Monthly Demand Zone (1.7460 - 1.6975)
Buy Stop: 1.7396
Stop Loss: 1.6841
Take Profit: 1.8449
Risk Management = 0.01/$100, With Stop Loss
Risk Management = 0.01/$200, No Stop Loss
Recommended Leverage not to exceed 1:50
Recommended Risk Ratio 1:2 – 1:3
Close partially the contract once it reaches 50% of profit, Move stop loss over the entry level
Close partially the contract once it reaches 80% of the profit

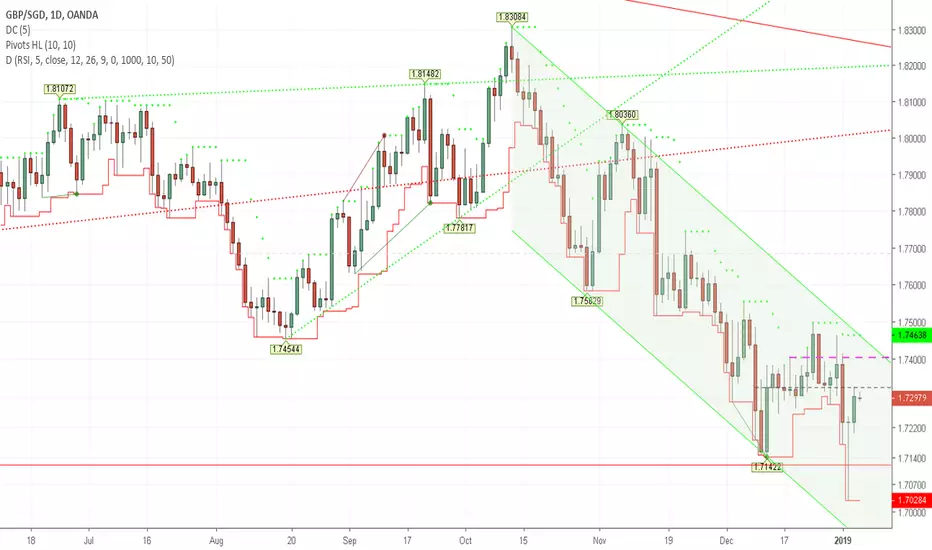
RetracedThe pound is in a downward trend and has retraced its January rise, i.e. it may continue its decline now.

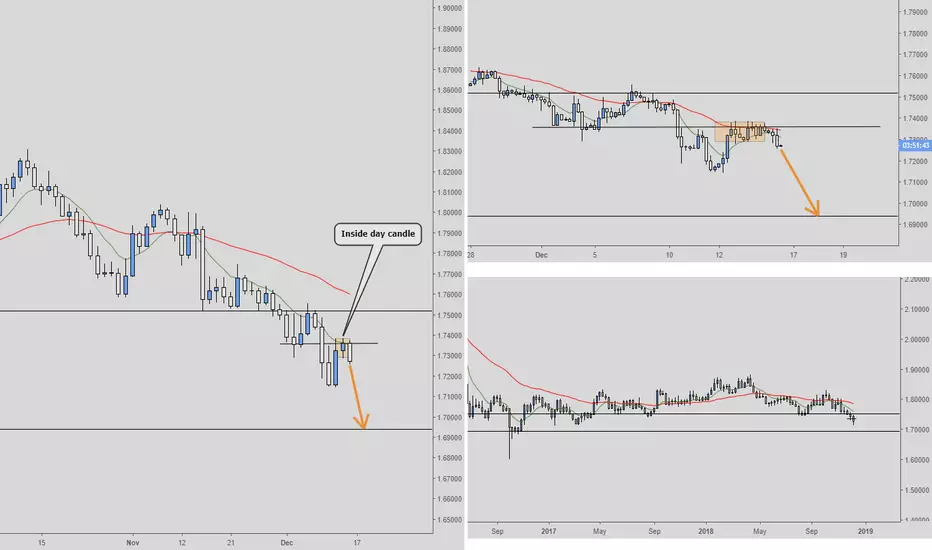
GBPSGD Short Daily/4-hourThis is a short off of a daily swing level where an inside day candle has been printed. Price has just broke out of the inside day candle in the 4-hour so it may drop from here. Looking for a measured move objective down to support
Falling TrendHowever this is not a channel but may be a large falling triangle. Nevertheless at first we shall see a futher decline following the narrowing trendlines.
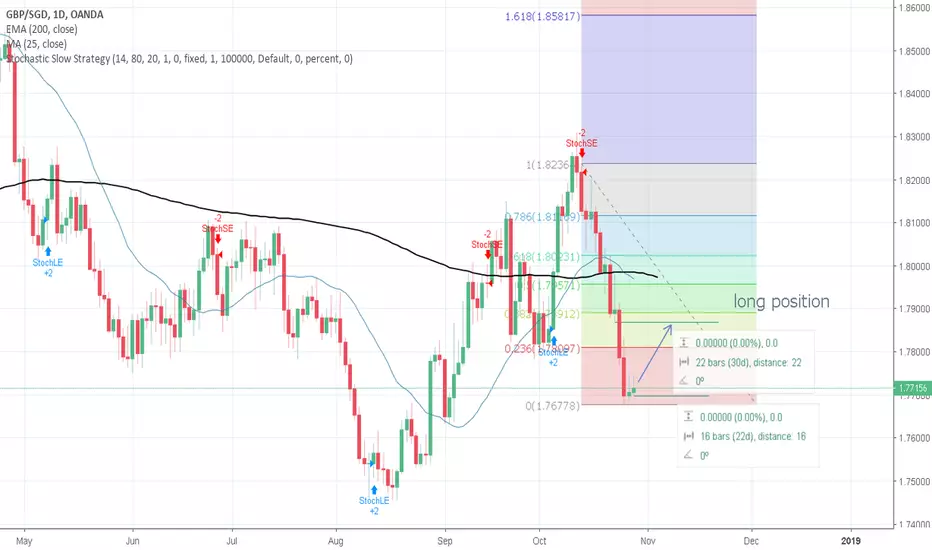
38.2% & POSSIBLE 61.8% Retracement LONG GWAVE.38.2% & POSSIBLE 61.8% Retracement LONG GWAVE.
FIB Retracement Percentage is calculated in a Higher Cartesian and or Euclidean Dimension.
PLEASE ALWAYS WAIT FOR STOCHASTIC CONFIRMATION!!! THANKS

Well Below the SupportWe broke through the trendline support the second time now what makes it more likely tha the decline shall continue.
End of bearish for GBP??All GBP pairs are in strong resistance area, GBPUSD, GBPSEK, GBPSGD. Possible bounce up at this area.
GBPSGD long on H4 pullbackThis is another GBPSGD long trade. The first pullback i published should have secured 160pips. Now we're getting another pullback on the H4. The pullback is testing previous resistance now support (as shows on H4 chart- top right) and on the daily is not at a significant point which is good as we hope this will continue up to the next resistance level as marked on the chart. Will look for a close above trendline on the 4hour.
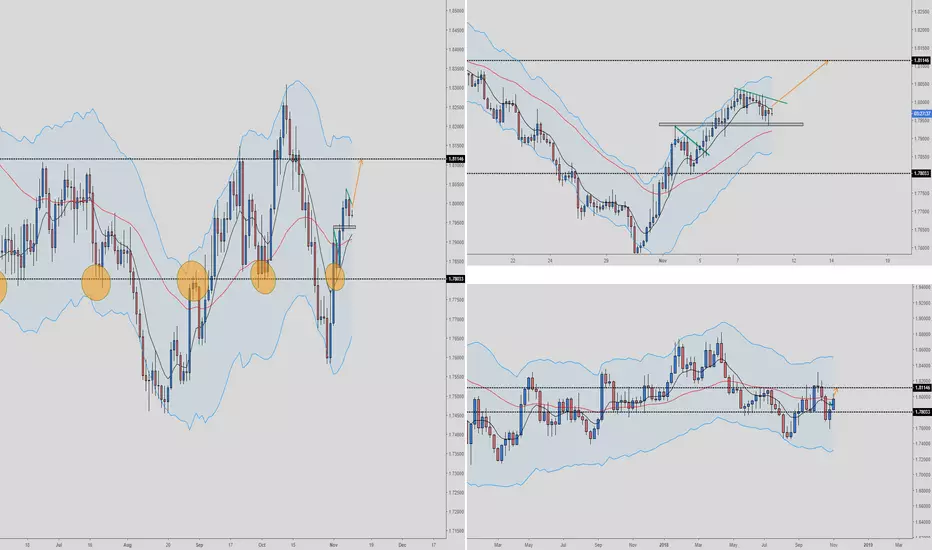


Long GBPSGD Daily/H4This unfortunately contradicts my EURSGD short trade, but this does look like a nice setup long. Big impulsive move up after a long downtrend on the daily and smashed through the resistance line show on the daily which has been respected quite a few times. It looks like its now testing the same line as support on the H4. Could go long if price breaks above the H4 trendline. Plenty of room for 3:1

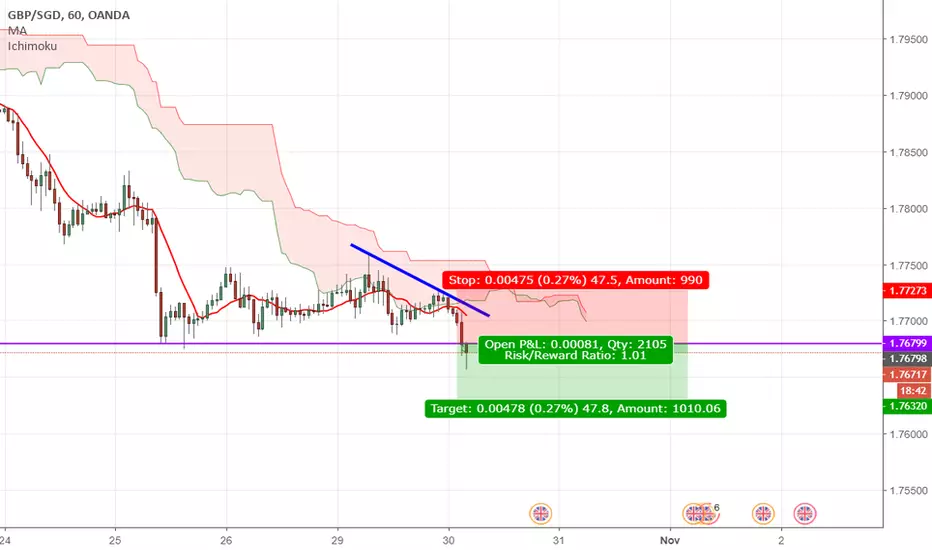
GBPSGD: Breakout trading to the downsideBearish candle broke trendline . There could be a further retest of the trendline before price plunges down.
38.2% & POSSIBLE 61.8% Retracement LONG GWAVE.38.2% & POSSIBLE 61.8% Retracement LONG GWAVE.
FIB Retracement Percentage is calculated in a Higher Cartesian and or Euclidean Dimension.
PLEASE ALWAYS WAIT FOR STOCHASTIC CONFIRMATION!!! THANKS

Clear Case of a Downward Leading ChannelSome hours ago it seemed as like if the bottom has been found but now we can see another decline.