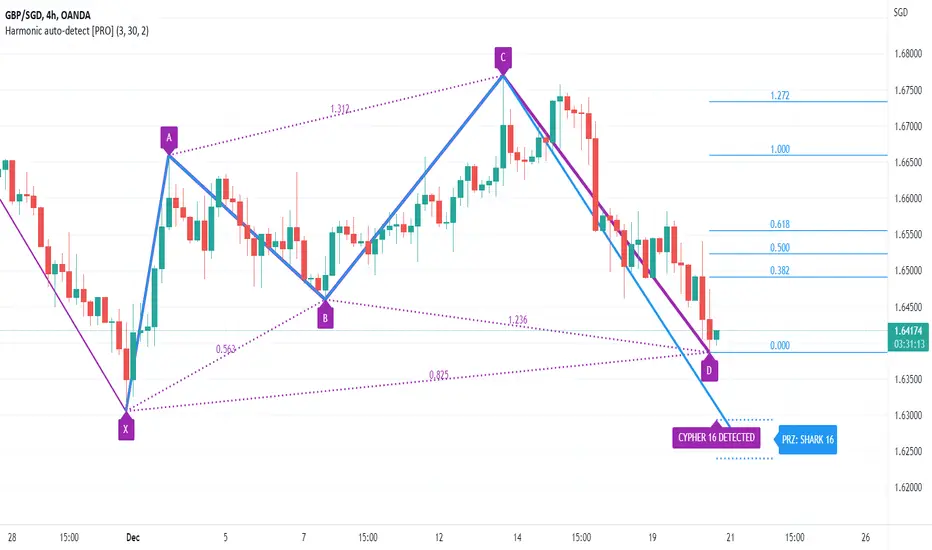
Perfect automated detection of Cypher & Shark PRZ - LongA bullish-type big Cypher pattern occurred.
If the price drops to 1.6293, a bullish-type Shark pattern could occur.
Long after seeing the rebound.
*Harmonic patterns are automatically detected using the indicators below.
- Harmonic auto-detect PRO
GBPSGD trade ideas
Long in GBPUSD is suggestedNew HH and HL are formed showing an Uptrend, 1D Support, Bullish Morning Star Candle formation and Fib Retracement Support 0.78 are all indicators for upward rally. Hence long position can be taken here.


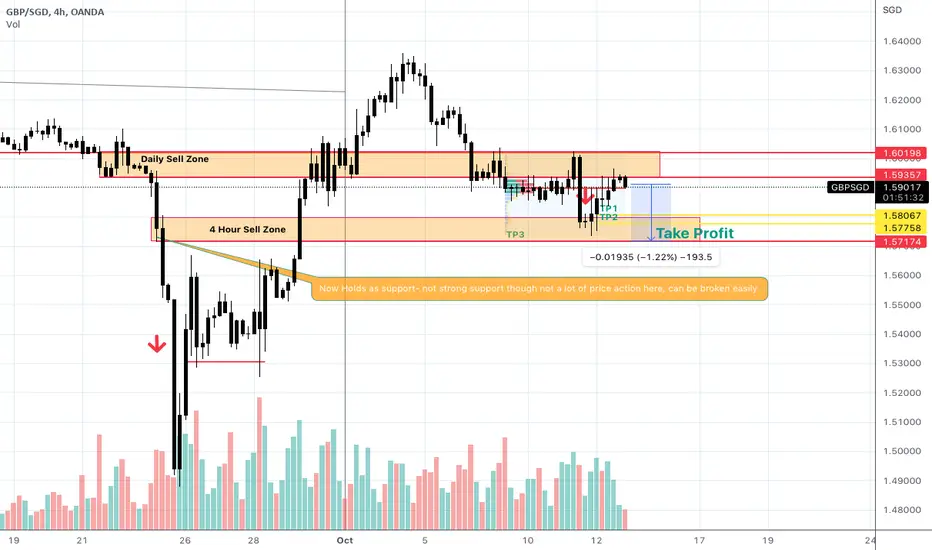
Short is recommended in GBPSGDA head and Shoulder pattern is formed in GBPSGD INDICATING a trend Reversal here. Short position can be initiated here.

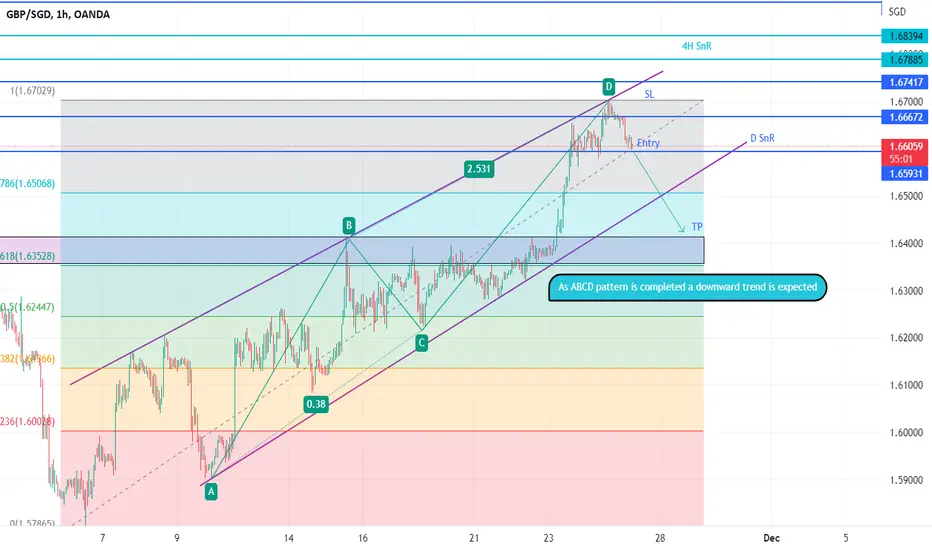
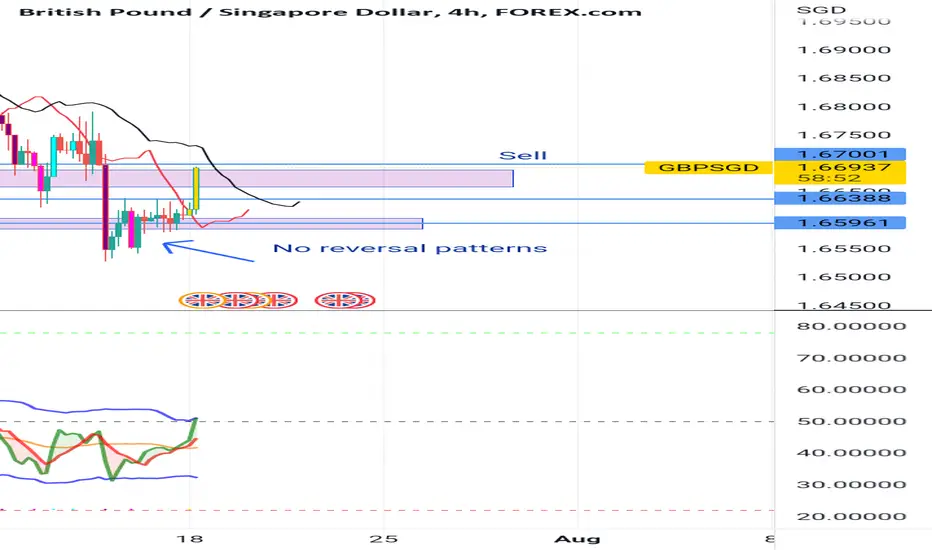
Going Short in GBPSGDABCD Pattern is completed and a trend reversal is initiated. A downward movement is expected.
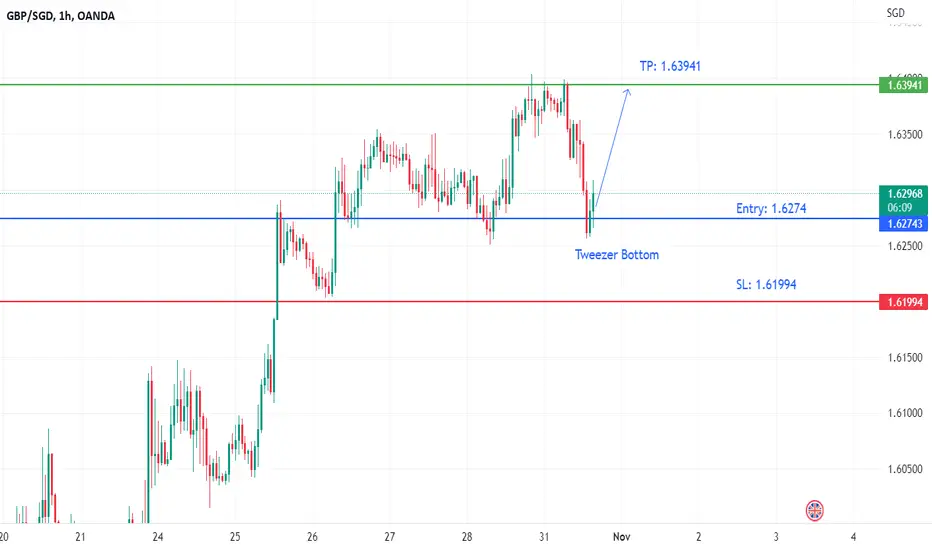
Long in GBPSGD is suggestedLong position can be taken in upward trend. Tweezer Bottom is seen for trend reversal
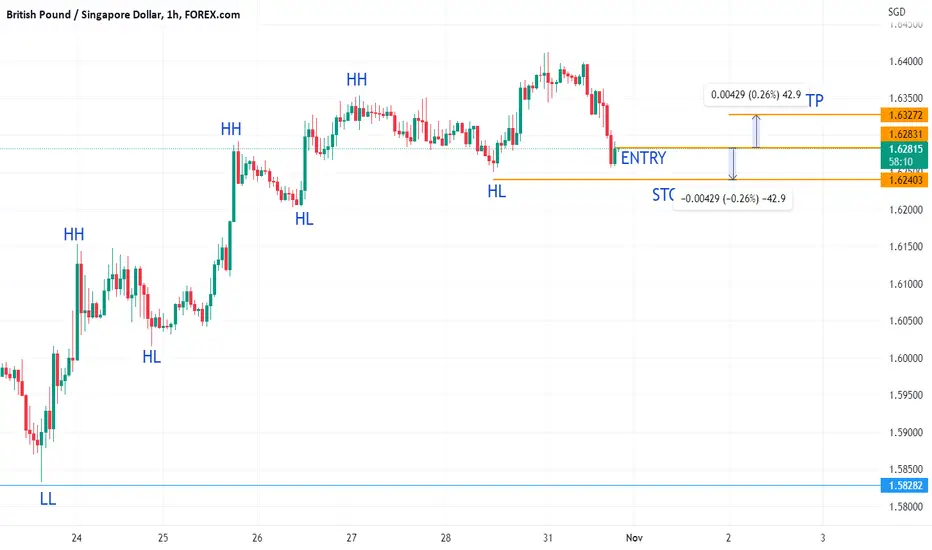
No.8Making higher highs and higher lows and showing an inside bar, 3 white soldiers, and bearish engulfing on the higher lows.
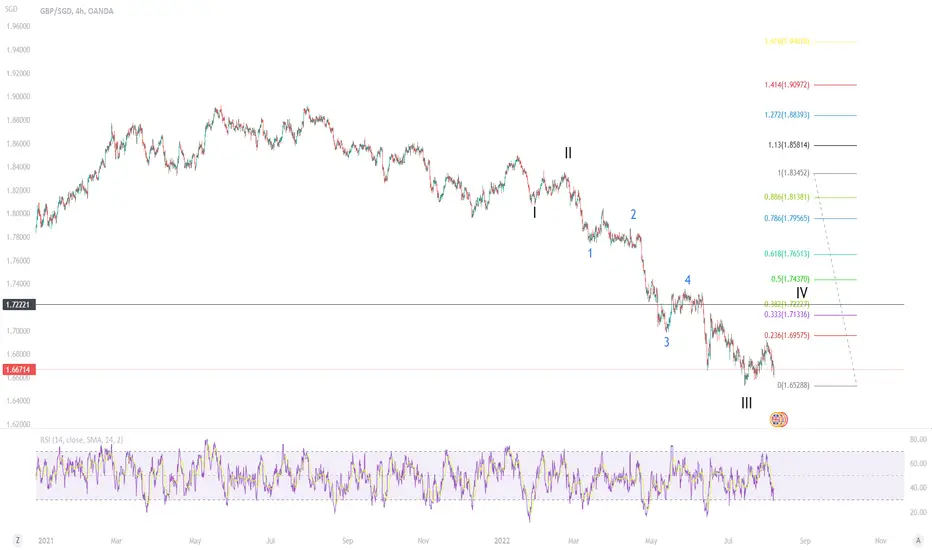
GBPSGD LONGThe third wave is over. Because the third wave is extended, the current price is in the B wave of the fourth wave. You can wait for the price to stabilize and then make the fourth wave C wave, you can buy.
GBP/SGD:Clues and signs for a new Bearish impulse | Short GBP/SGD show a Bearish Harmonic pattern formation in confluence with 61.8% Fibo retracement rejection from the previous Swing high there is also a touch of the dynamic trendline of the Bearish channel and the Ichimoku forecast it's also Bearish, not last the stochastic is in Overbought ready to come back in the normal range of value. All these details and signs are a great value for a Short trade.

GBP/SGD:DOWNTREND | SWING TRADING | SHORT SETUP 🔔Hello Everyone, I hope you'll Appreciate our Price action Analysis !
Our strategy is based on Swing trading with price action Analysis and Advanced Fibos tools.
Please support our page by hitting the LIKE 👍 button to this Idea and Follow us to get NEW ONE!
Feel free to request any pair/instrument analysis or ask any questions in the comment section below.
If you like this idea or have your own opinion about it, please write your own in the comment box . We will be glad for this.
Have a Good Take Day_Profits !

GbpsgdIn my analysis ......i use tdi indicator indicator a bearish mvt in a down trend ....am going short where mg take profit will be on the resistance
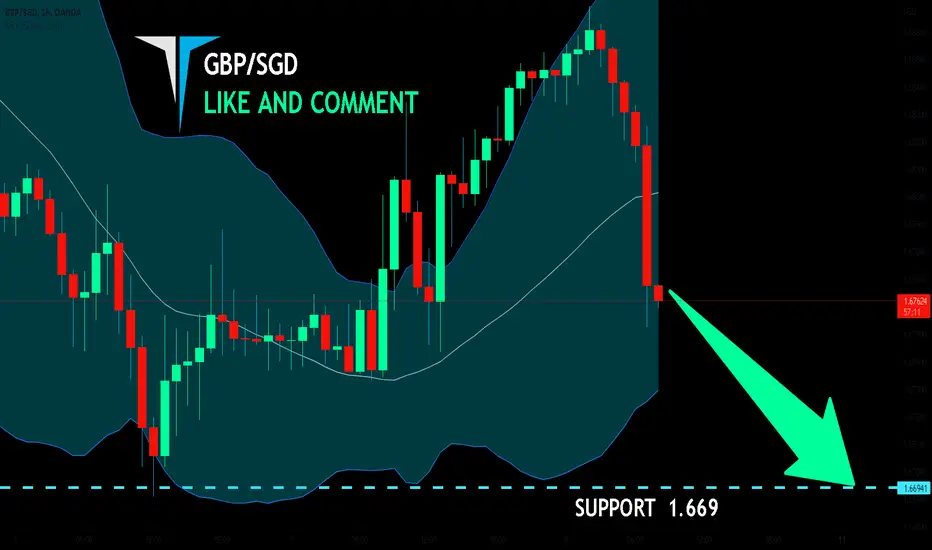
GBP/SGD SELLERS WILL DOMINATE THE MARKET|SHORT
Hello, Friends!
After some time of sending us mixed signals
GBP/SGD is finally giving us a solid bearish bias
And judging by the price action at the lower timeframes
The pair is about to go down!
SELL!
✅LIKE AND COMMENT MY IDEAS✅
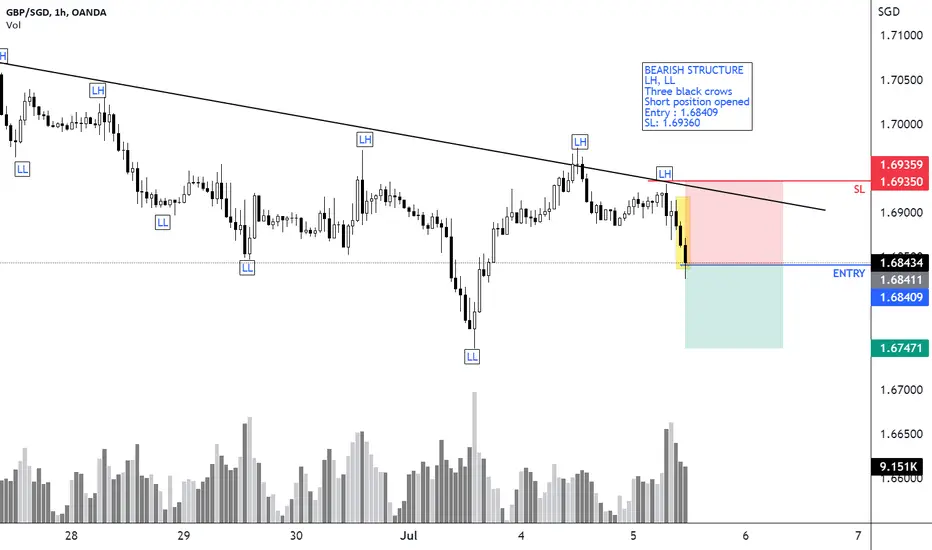
GBPSGD - SHORTBEARISH STRUCTURE
LH, LL
Three black crows
Short position opened
Entry : 1.68409
SL: 1.69360

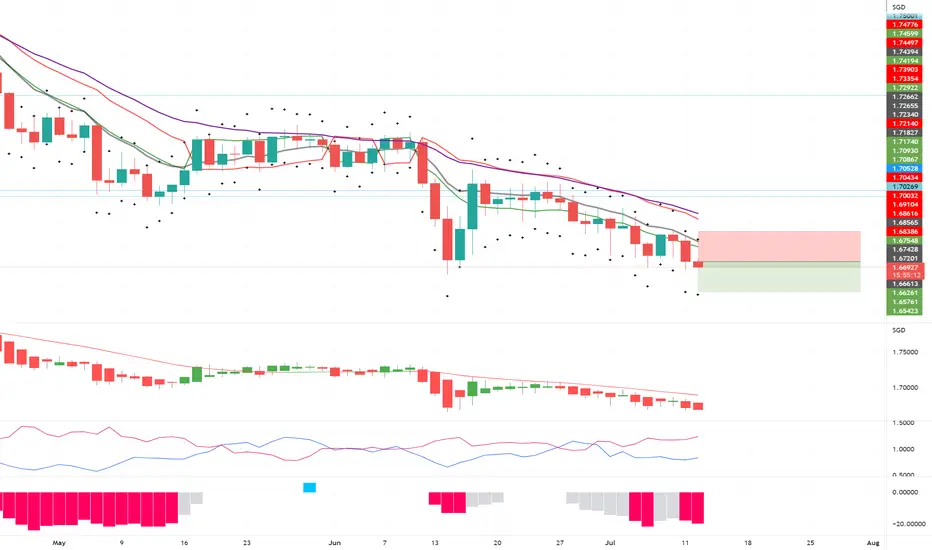
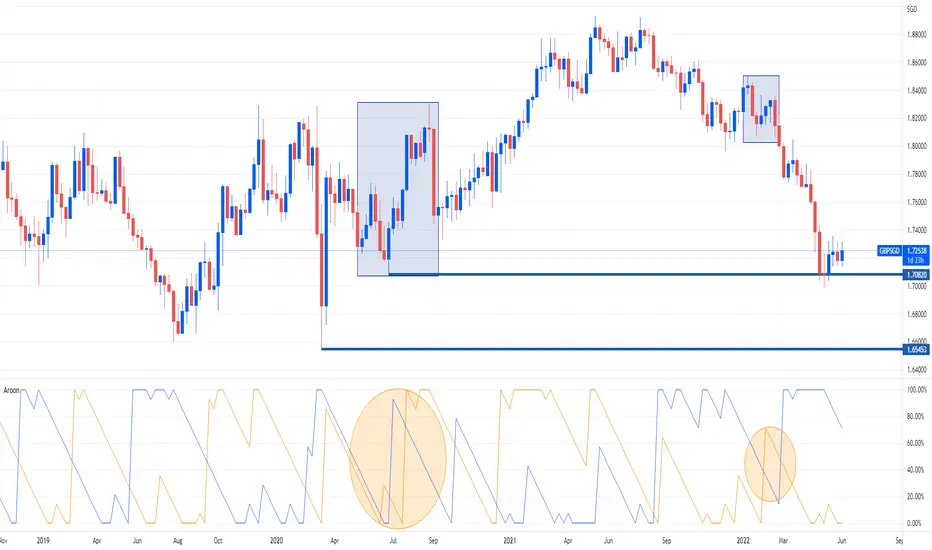
Singapore dollar weighing down the British poundThe Singapore dollar has shown great strength for the past 12 months against the Great British pound, underpinned by the Singaporean economy growing 7.6% and expectations for it to continue growing the rest of this year. Adding to the strength of the Singapore dollar in recent weeks is China starting to lift its strict lockdowns, as China is Singapore’s third largest trading partner.
Looking at the weekly chart of the GBPSGD, we can easily see the strength of Singapore weighing this pair down. The BGPSGD has recently taken out the low from June 2020 and is possibly targeting the March 2020 next.
With an Aroon indicator on the chart of GBPSGD, we can look at the portions highlighted within the two circles and their corresponding trends in the chart above. The Aroon indicator is typically used for spotting trends and the strength of trends by following the movement of an orange ‘Up’ line and a Blue ‘Down’ line.
Within the first circle, the rising Up and Down lines suggest a weak trend for the corresponding chart. As such, the uptrend quickly petered out and entered a period of consolidation and a quicker reversal.
Within the second circle, we can see the Down line cross below the Up before reversing its trajectory. This movement in the Aroon indicator corresponds with the attempted bullish push in the GBPSGD. Once the Aroon lines reversed, The bullish push disappeared, and a strong bearishness entered the GBPSGD, and did so until the start of May. Currently, we can see that the two Aroon lines are separated by quite some distance. It may be worth keeping track of the Aroon lines to determine how close the GBPSGD wants to move toward that March 2020 low, if its downward trend holds.

GPBSGD break down this is the breakdown of the GBPSGD , on what to expect from the pairs in coming month , levels to pick trade and price target.

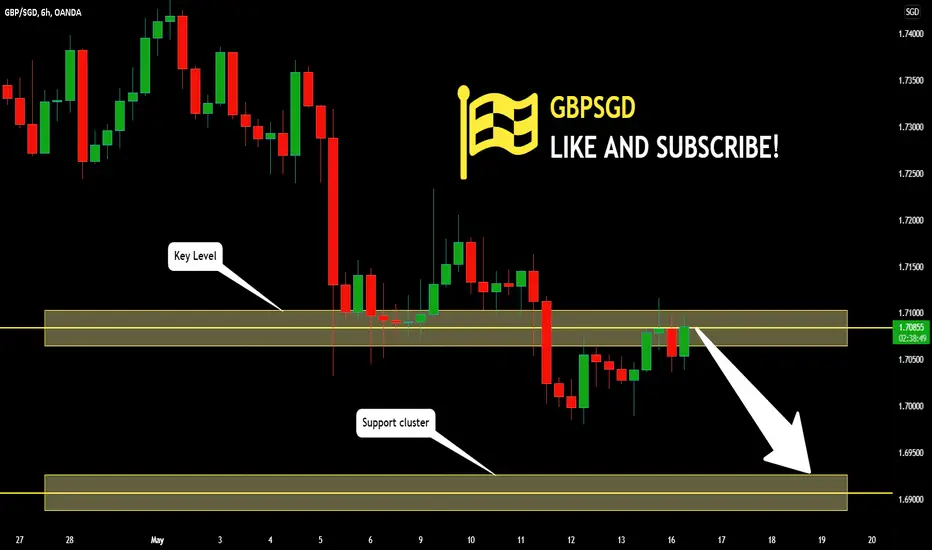
GBPSGD Will Fall! Sell!
Hello,Friends!
In this market situation, I am looking at multiple indicators
And I can see bearish momentum accumulating on the pair right now
This sentiment makes me bearish biased and I am considering a short!
Like and subscribe and comment my ideas if you enjoy them!
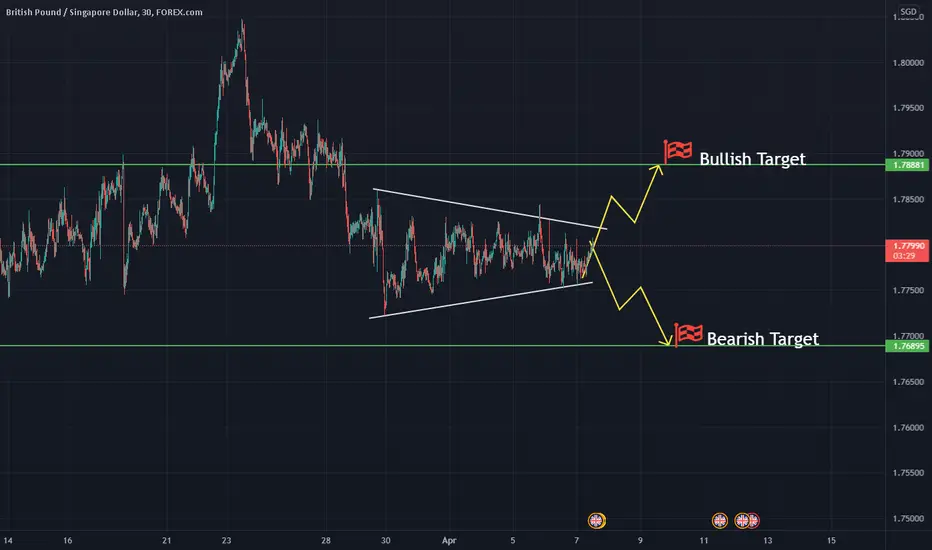
GBP/SGDBullish breakout :
Entry price 1.78339
Take Profit 1.78881
Stop Loss 1.78057
Bearish breakout :
Entry price 1.77465
Take Profit 1.76895
Stop Loss 1.77775
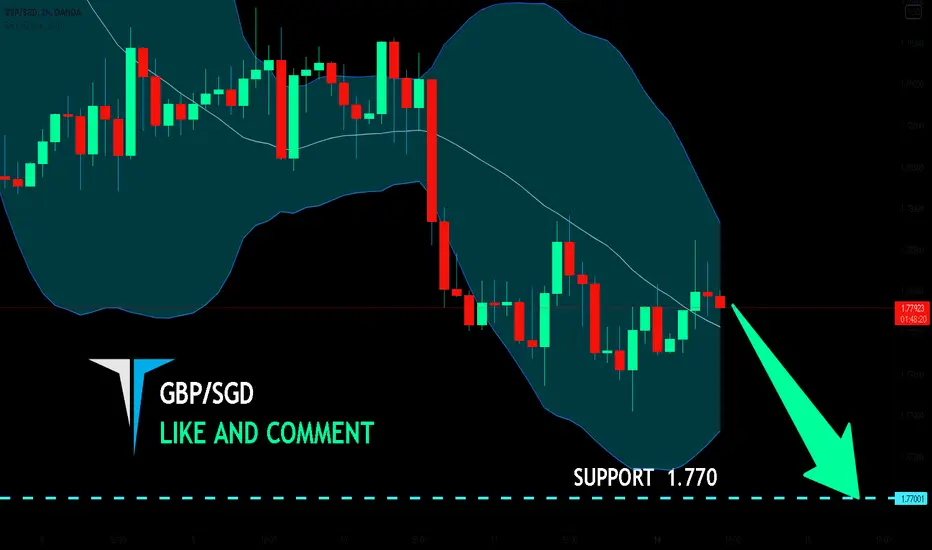
GBP/SGD BEST PLACE TO SELL FROM|SHORT
Hello, Friends!
GBP/SGD is trading In way
That I predicted previously
And now the pair is retesting
A hidden bank’s level
So I think a bearish move will follow!
SELL!
✅LIKE AND COMMENT MY IDEAS✅
GBPSGD Daily OutlookWe are Expecting GBPSGD for long sell from Supply Level 1.82757 as the market break the Demand Level 1.80353. Market can go up till the Supply Level 1.82757 for sell entry after Re-Alignment in Short TF, If we see any Confirmation about Re-Alignment then we will update about market trend, We can sell it from the Supply Level 1.82757 to Demand Level 1.72650.
