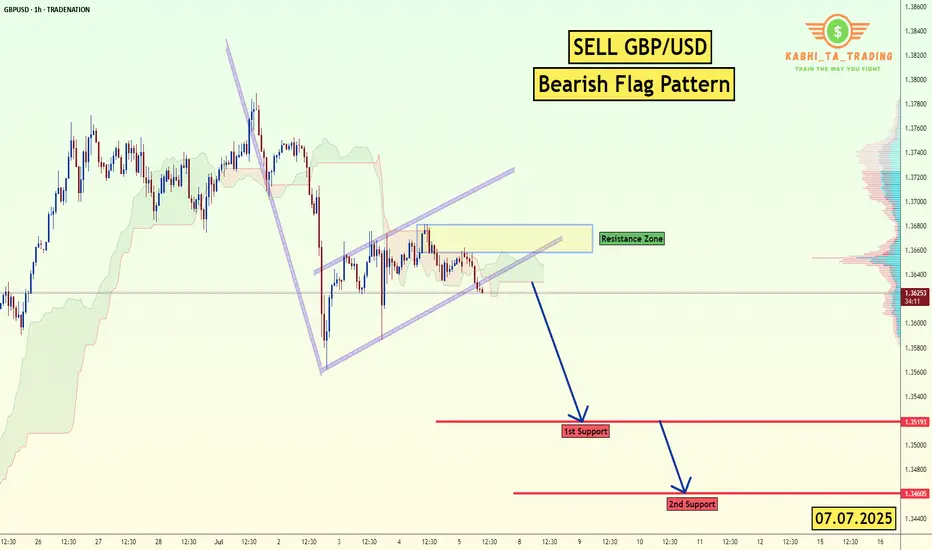
GBP/USD - H1- Bearish Flag (07.07.2025)The GBP/USD Pair on the M30 timeframe presents a Potential Selling Opportunity due to a recent Formation of a Bearish Flag Pattern. This suggests a shift in momentum towards the downside in the coming hours.
Possible Short Trade:
Entry: Consider Entering A Short Position around Trendline Of The Pattern.
Target Levels:
1st Support – 1.3520
2nd Support – 1.3460
🎁 Please hit the like button and
🎁 Leave a comment to support for My Post !
Your likes and comments are incredibly motivating and will encourage me to share more analysis with you.
Best Regards, KABHI_TA_TRADING
Thank you.
Disclosure: I am part of Trade Nation's Influencer program and receive a monthly fee for using their TradingView charts in my analysis.
GBPUSD trade ideas
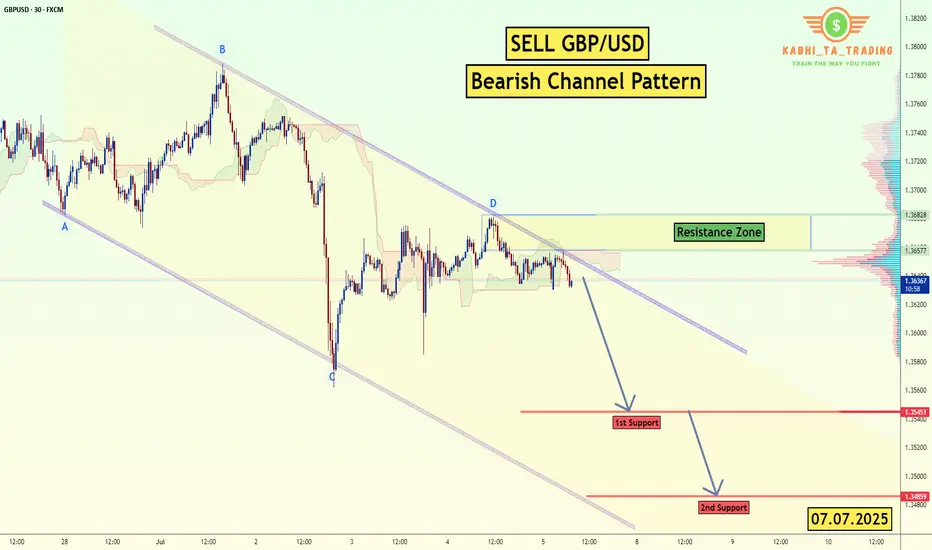
GBP/USD - Bearish Channel (07.07.2025)The GBP/USD Pair on the M30 timeframe presents a Potential Selling Opportunity due to a recent Formation of a Bearish Channel Pattern. This suggests a shift in momentum towards the downside in the coming hours.
Possible Short Trade:
Entry: Consider Entering A Short Position around Trendline Of The Pattern.
Target Levels:
1st Support – 1.3545
2nd Support – 1.3485
🎁 Please hit the like button and
🎁 Leave a comment to support for My Post !
Your likes and comments are incredibly motivating and will encourage me to share more analysis with you.
Best Regards, KABHI_TA_TRADING
Thank you.
Disclosure: I am part of Trade Nation's Influencer program and receive a monthly fee for using their TradingView charts in my analysis.
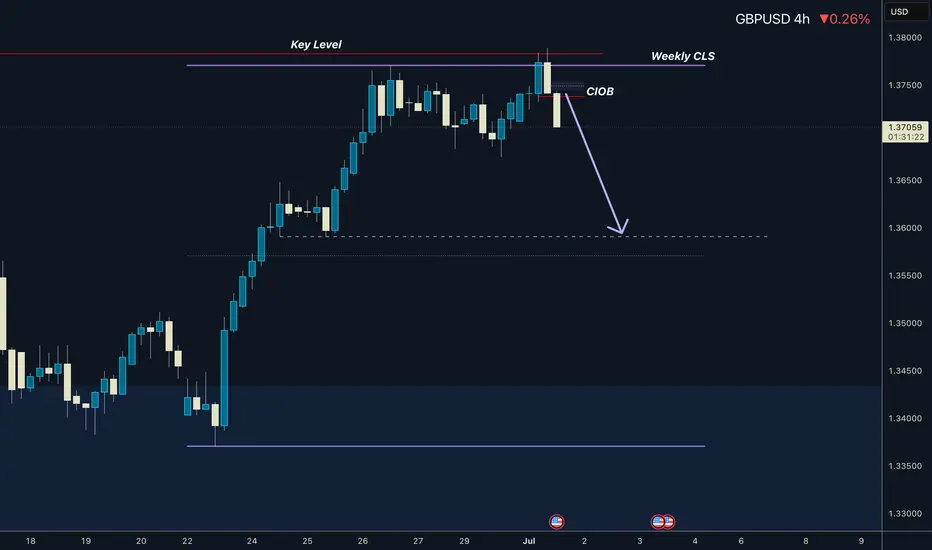
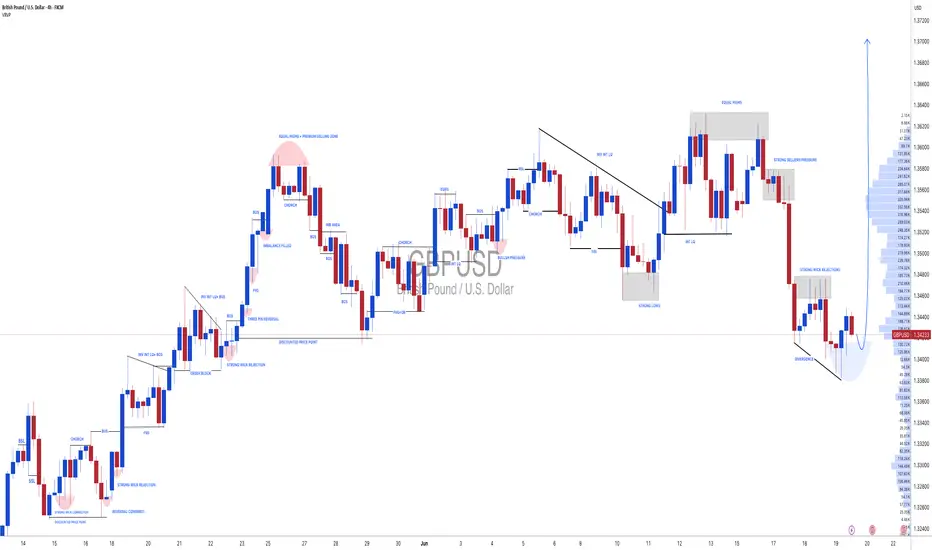
GBPUSD I Weekly CLS I Model 1 I Target 50%Hey, Market Warriors, here is another outlook on this instrument
If you’ve been following me, you already know every setup you see is built around a CLS Footprint, a Key Level, Liquidity and a specific execution model.
If you haven't followed me yet, start now.
My trading system is completely mechanical — designed to remove emotions, opinions, and impulsive decisions. No messy diagonal lines. No random drawings. Just clarity, structure, and execution.
🧩 What is CLS?
CLS is real smart money — the combined power of major investment banks and central banks moving over 6.5 trillion dollars a day. Understanding their operations is key to markets.
✅ Understanding the behavior of CLS allows you to position yourself with the giants during the market manipulations — leading to buying lows and selling highs - cleaner entries, clearer exits, and consistent profits.
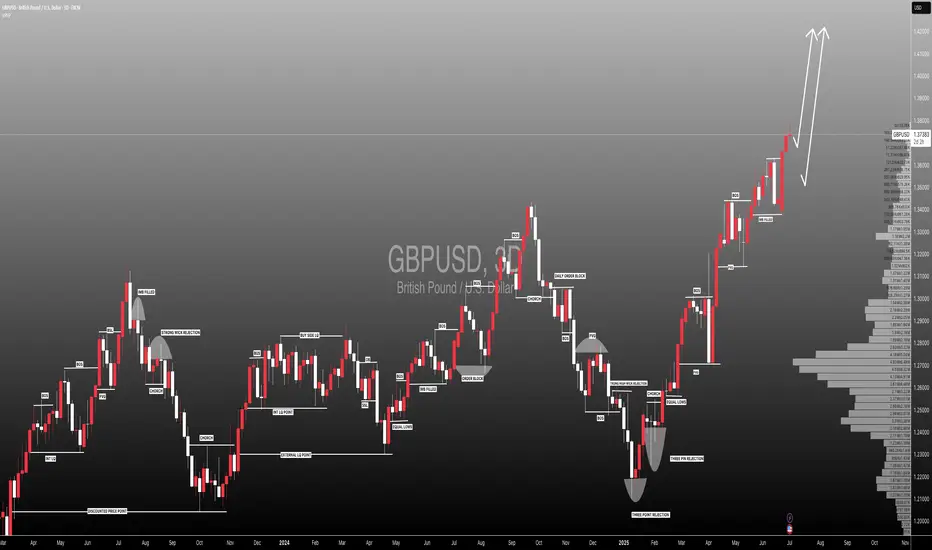
📍 Model 1
is right after the manipulation of the CLS candle when CIOD occurs, and we are targeting 50% of the CLS range. H4 CLS ranges supported by HTF go straight to the opposing range.
"Adapt what is useful, reject what is useless, and add what is specifically your own."
— David Perk aka Dave FX Hunter ⚔️
👍 Hit like if you find this analysis helpful, and don't hesitate to comment with your opinions, charts or any questions.
#GBPUSD: Detailed View Of Next Possible Price Move! GBPUSD exhibited a favourable movement after rejecting a pivotal level previously identified. We anticipate a smooth upward trajectory, potentially reaching approximately 1.45. Conversely, the US Dollar is on the brink of collapse around 90, which will directly propel the price into our take-profit range.
During GBPUSD trading, it is imperative to adhere to precise risk management principles. Significant news is scheduled to be released later this week.
We kindly request your support by liking, commenting, and sharing this idea.
Team Setupsfx_
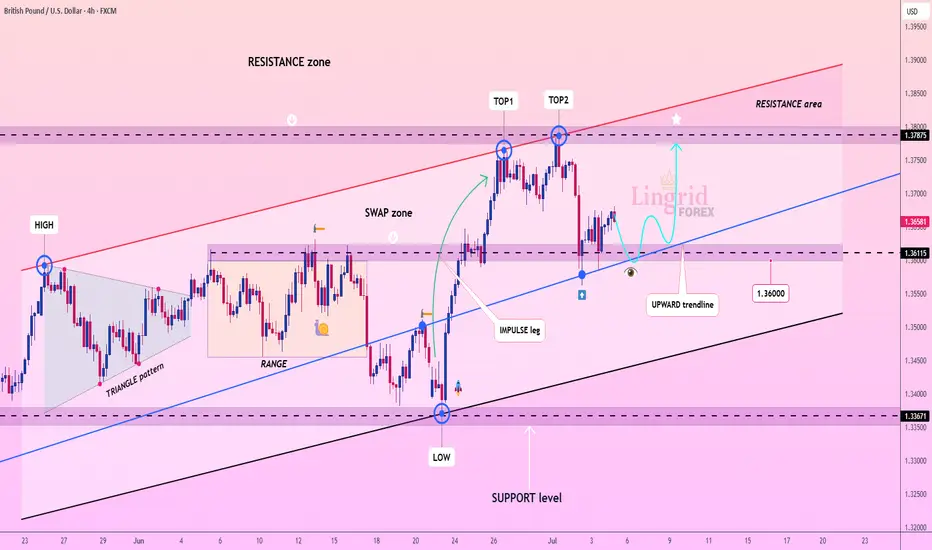
Lingrid | GBPUSD Potential Bounce at Key Psychological LevelThe price perfectly fulfilled my previous idea . FX:GBPUSD is consolidating above the upward trendline after forming a local double top near the 1.3787 resistance zone. The price is currently retesting the 1.3611–1.3660 support cluster, aligned with the trendline and previous impulse breakout area. A successful bounce from this zone could initiate another rally toward the upper boundary of the resistance range.
📈 Key Levels
Buy zone: 1.3600–1.3660 (trendline + support overlap)
Sell trigger: breakdown below 1.3600
Target: 1.3787 – resistance ceiling with prior rejection
Buy trigger: bullish reaction from 1.3611 area with strong candle close
💡 Risks
Breakdown below 1.3600 may expose deeper retracement to 1.3367
Repeated rejection at 1.3787 could form a longer-term double top
Macro data surprises could shift short-term direction suddenly
If this idea resonates with you or you have your own opinion, traders, hit the comments. I’m excited to read your thoughts!
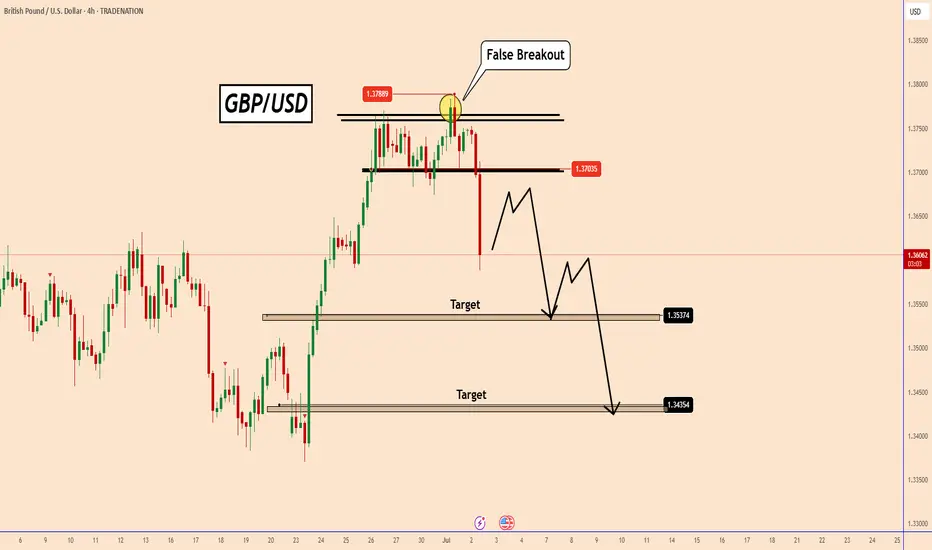
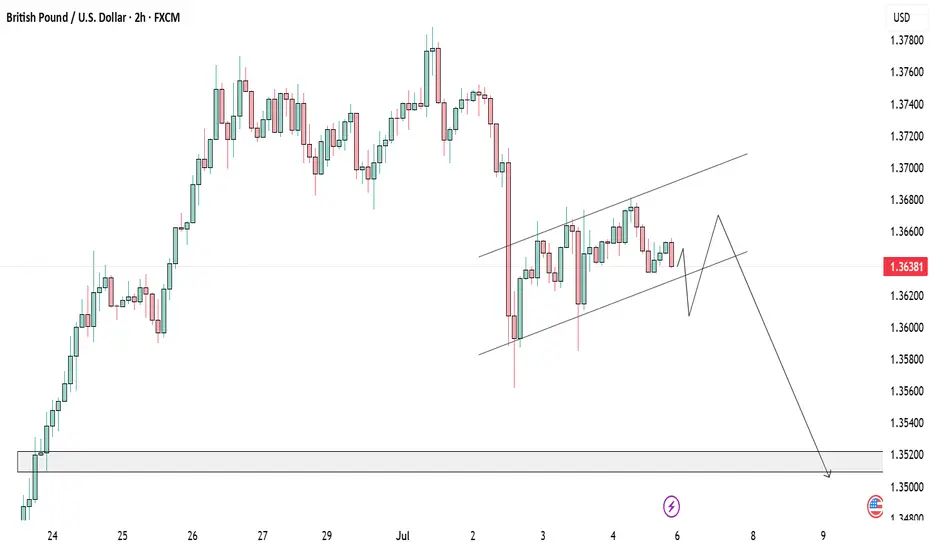
GBPUSD: Profit taking or a downward move?GBPUSD: Profit taking or a downward move?
Yesterday, GBPUSD reached a new high of 1.3788, last seen in February 2022.
From the chart it can be clearly seen that GBPUSD only created a false breakout to the upside.
Market participants expected USD to weaken, but it changed direction again and locked in many long positions.
Despite the ADP data today being a real dud from expectations of 95k to -33k, we can see that GBPUSD did not stop the decline.
I think this could be related to the FED and if they think that maybe this is the time to change Interest Rates at the July meeting. It could also be a liquidity release and it could rise again, but we cannot prove this yet with the current pattern.
Technical Analysis:
As long as the price stays below 1.3680 or below this small structure, the price could fall further.
Don't forget that tomorrow we also have NFP data and the US market will be preparing for a long weekend. The 4-hour candle is strong and bearish, so let's see.
You may find more details in the chart!
Thank you and Good Luck!
PS: Please support with a like or comment if you find this analysis useful for your trading day
Disclosure: I am part of Trade Nation's Influencer program and receive a monthly fee for using their TradingView charts in my analysis.
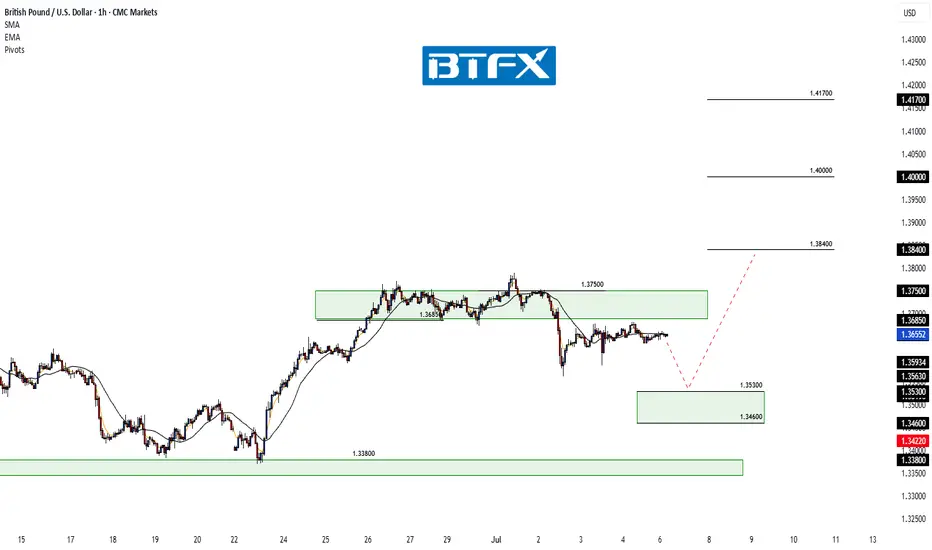
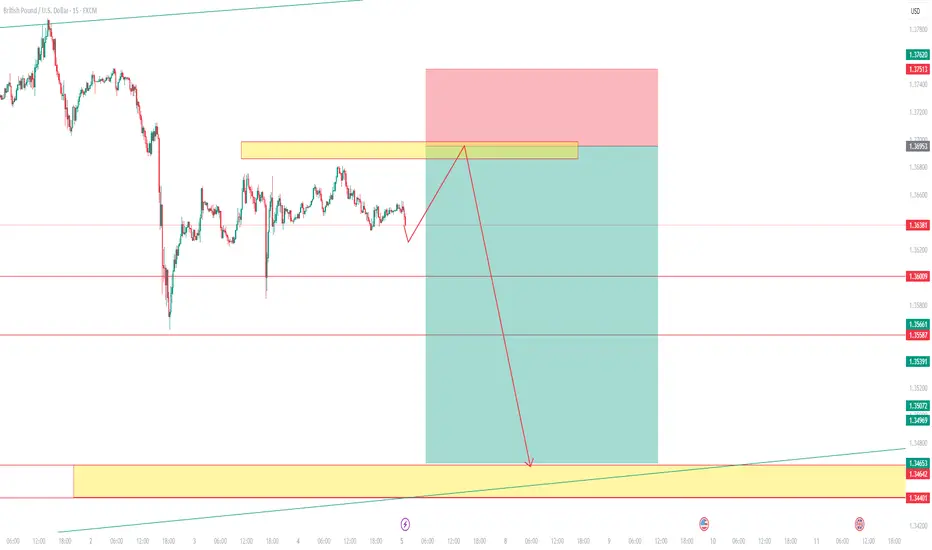
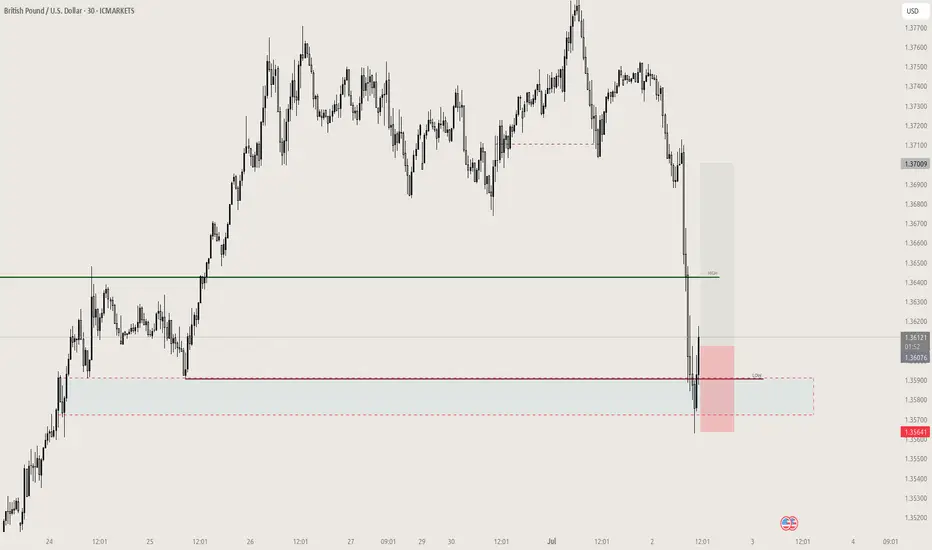
GBP/USD Pulls Back After Rejection – Buyers Eye Lower LevelsHi everyone,
GBP/USD failed to break above the 1.37500 level and saw a rejection from that resistance, dropping further below the 1.36850 support. Since then, price has consolidated and ranged beneath this level.
Looking ahead, if price remains within this range, we anticipate a move lower to find buying interest between the 1.35300 and 1.34600 levels, which could set the stage for another push higher.
As previously noted, a decisive break above 1.37500 would renew our expectation for further upside, with the next key target around 1.38400. We'll be monitoring price action closely to see how it unfolds.
We’ll continue to provide updates on the projected path for GBP/USD as price approaches this target.
The longer-term outlook remains bullish, and we expect the rally to continue extending further from the 1.20991 January low towards 1.40000 and 1.417000.
We’ll be keeping you updated throughout the week with how we’re managing our active ideas. Thanks again for all the likes/boosts, comments and follows — we appreciate the support!
All the best for the week ahead. Trade safe.
BluetonaFX
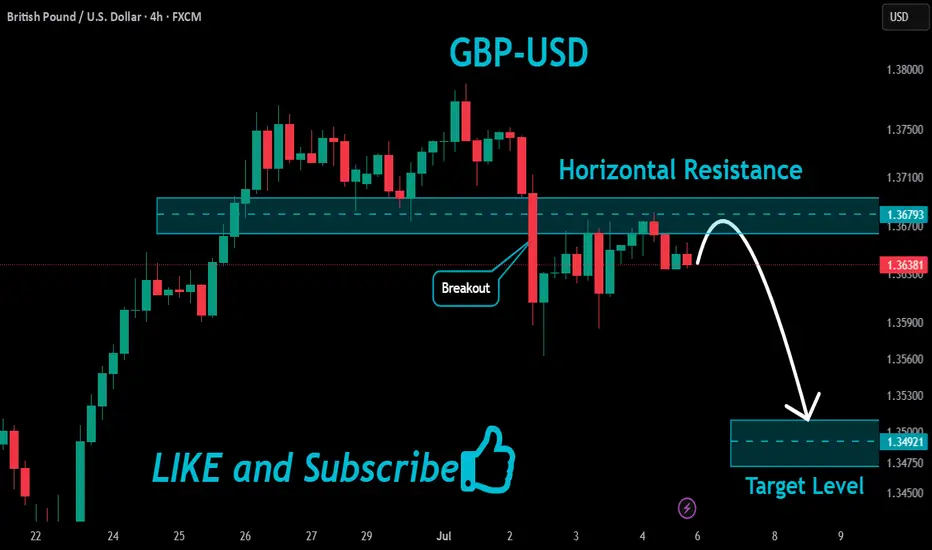
GBPUSD Resistance Ahead!
HI,Traders !
#GBPUSD made a rebound
From the support and went
Up but will now retest a
Local horizontal level
Of 1.36793 from where
We will be expecting
A local bearish reaction !
Comment and subscribe to help us grow !
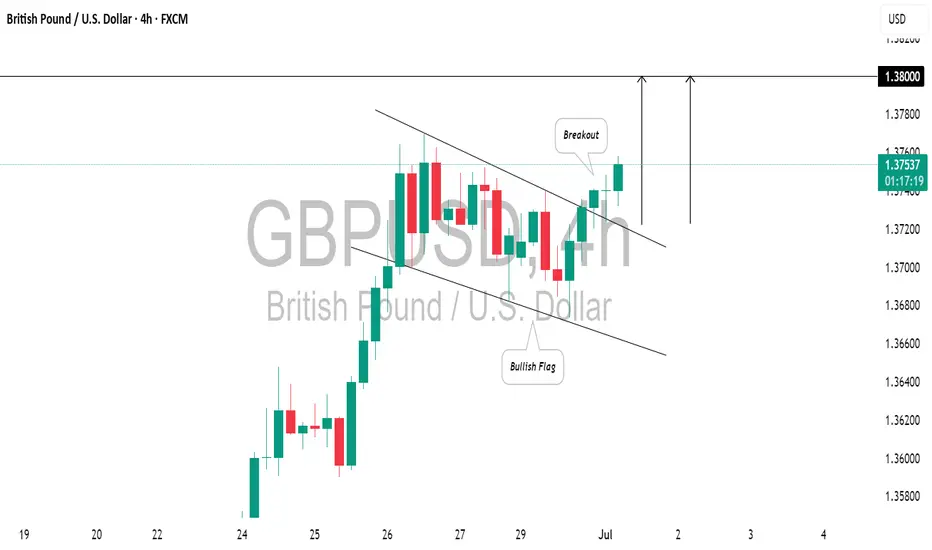
GBPUSD: Bullish Continuation Ahead.The GBPUSD has established a typical bullish trend following pattern.
Following a significant upward movement, the price entered a correction phase within a bullish flag.
Breaking above the resistance line serves as a strong indicator of continued upward momentum.
I anticipate that the pair could reach the 1.3800 level.
#GBPUSD: A strong bullish move incoming, comment your views The price has shown a possible price divergence, which could lead to a long-term move to 1.37. We expect the US dollar to weaken, which will likely push the price of GBPUSD to our target. Key economic data will be released later today and tomorrow, which could shape the price pattern.
Good luck and trade safely!
Team Setupsfx_
GBPUSD Bearish ContinuationEntering a new week, GBPUSD looks to retest support at 1,35. It looks as though price is printing a bearish flag pattern , let us observe what happens on Monday
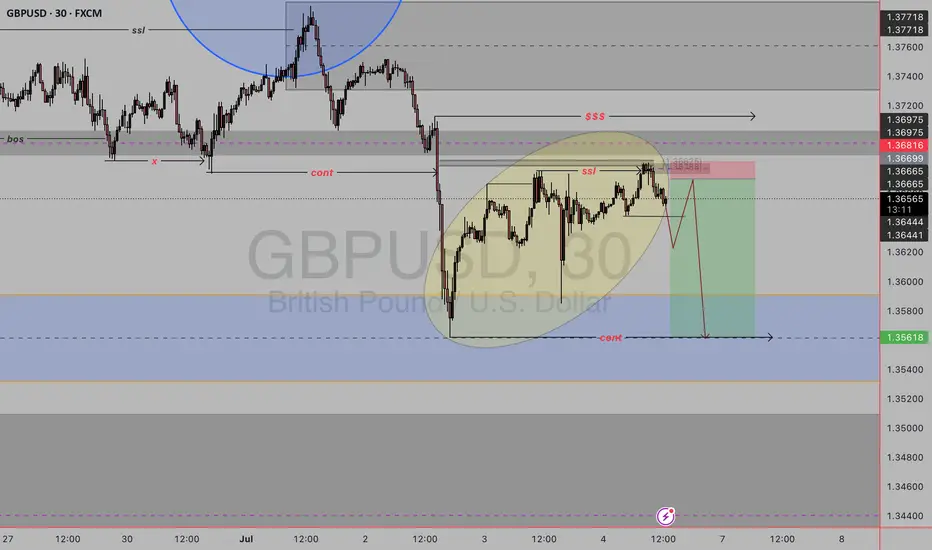
sell gbpusdAs noted there we are in a downtrend as price is breaking lows and forming lower lows but looking at weekly we are currently bullish having a retracement meaning this is a counter trend following the retracement no high has been broken to continue the trend and i see ssl liquidity swept on ltf waiting for trans and reteracement to my liquidity area to take sells but if no tr no trade
GBPUSD -SHort TGT 1.3464GBPUSD is expected to hit long. However the pair will retrace to 1.3464 before futher long move.
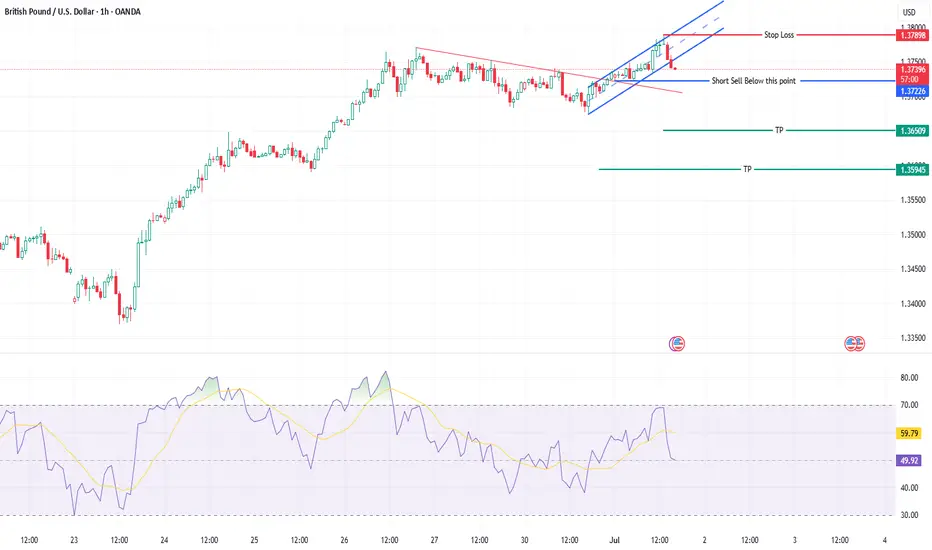
GBPUSD opportunity to go SHORTThe pair has been showing weakness for some time through RSI divergence.
On hourly chart it printed the indecision candle followed by two red candles. This gives us the cue for bearish momentum.
Since we need multiple reasons to short sell so we identify the recent low and if the price goes lower than this than we initiate a short trade.
For ready reference the TPs have been marked on chart.
wishing you a PROFIT-able trading.
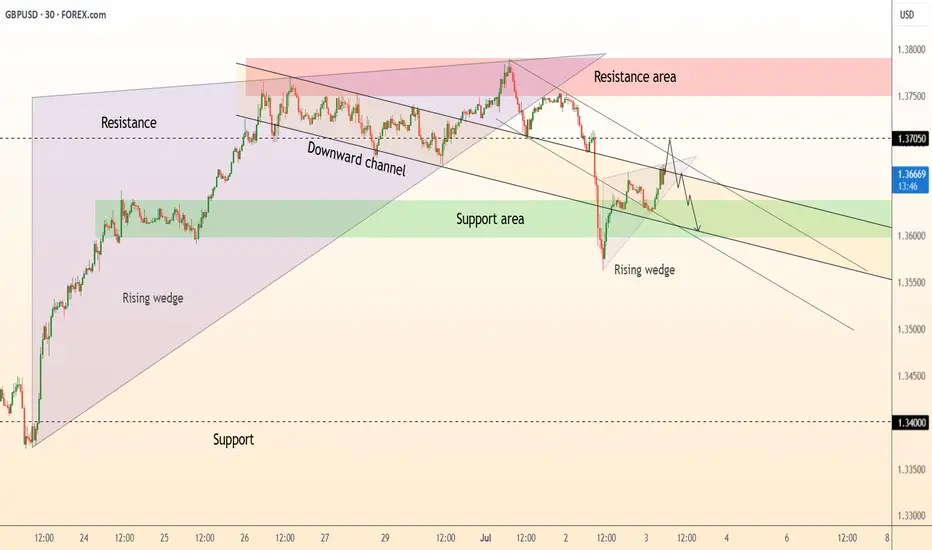
DeGRAM | GBPUSD will continue to correct📊 Technical Analysis
● Price retests the broken wedge-base & channel roof ≈ 1.370 inside a confluence resistance zone (pink). Lower-highs into this cap form a bear flag pointing toward 1.360.
● Intraday rising-wedge has already cracked; projected width and the broader descending channel intersect 1.352-1.355, reinforcing downside targets.
💡 Fundamental Analysis
● Softer UK PMI prices and pre-election caution keep BoE-cut probabilities elevated, while a stronger US JOLTS print plus hawkish FOMC minutes underpin the dollar, favouring renewed GBP/USD pressure.
✨ Summary
Fade rallies 1.368-1.372; slide below 1.360 unlocks 1.355 then 1.343. Bear thesis invalid on a 30 min close above 1.374.
-------------------
Share your opinion in the comments and support the idea with a like. Thanks for your support!
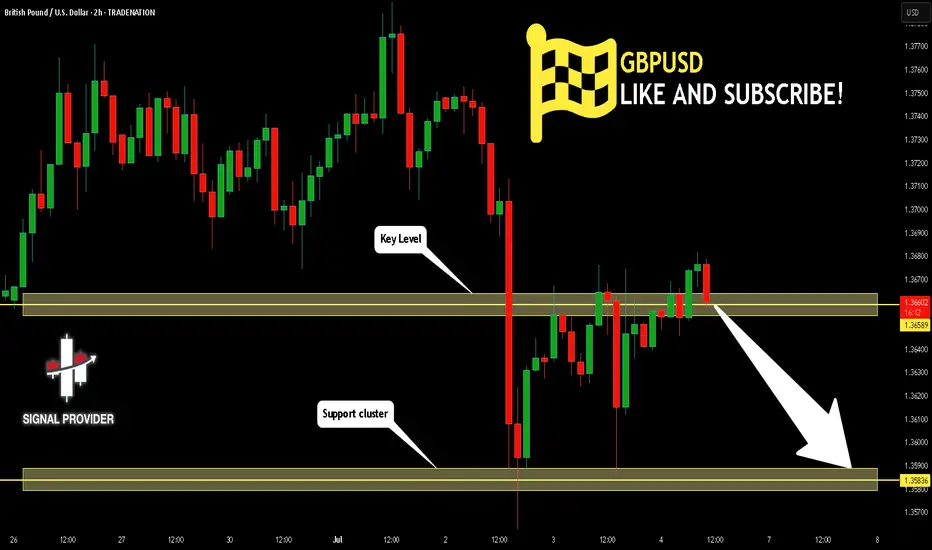
GBPUSD Will Go Lower! Sell!
Take a look at our analysis for GBPUSD.
Time Frame: 2h
Current Trend: Bearish
Sentiment: Overbought (based on 7-period RSI)
Forecast: Bearish
The market is testing a major horizontal structure 1.365.
Taking into consideration the structure & trend analysis, I believe that the market will reach 1.358 level soon.
P.S
Overbought describes a period of time where there has been a significant and consistent upward move in price over a period of time without much pullback.
Disclosure: I am part of Trade Nation's Influencer program and receive a monthly fee for using their TradingView charts in my analysis.
Like and subscribe and comment my ideas if you enjoy them!
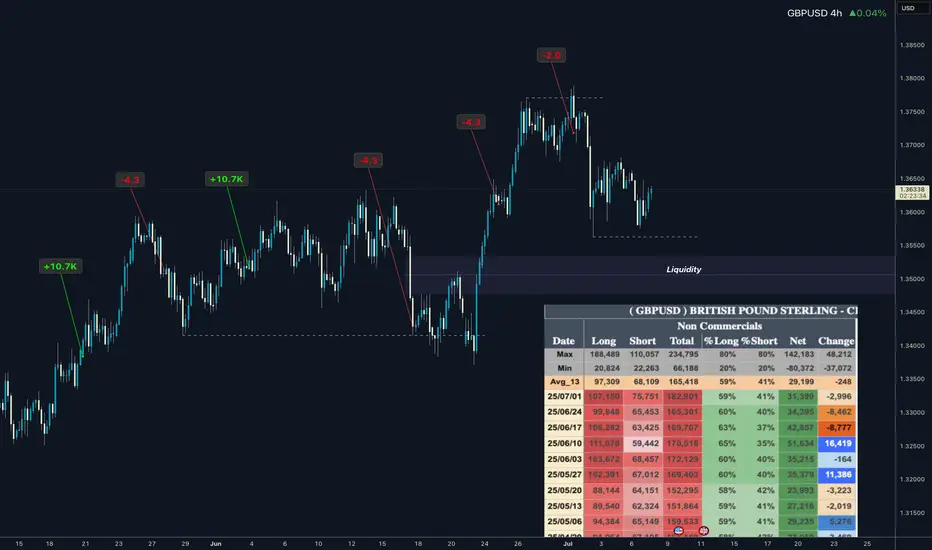
GBPUSD COT and Liquidity AnalysisHey what up traders welcome to the COT data and Liquidity report. It's always good to go with those who move the market here is what I see in their cards. I share my COT - order flow views every weekend.
🎯 Non Commercials has been taking profits on during last 3 weeks. There for I think we need deeper pullback to reload the longs.
📍Please be aware that institutions report data to the SEC on Tuesdays and data are reported on Fridays - so again we as retail traders have disadvantage, but there is possibility to read between the lines. Remember in the report is what they want you to see, that's why mostly price reverse on Wednesday after the report so their cards are hidden as long as possible. However if the trend is running you can read it and use for your advantage.
💊 Tip
if the level has confluence with the high volume on COT it can be strong support / Resistance.
👍 Hit like if you find this analysis helpful, and don't hesitate to comment with your opinions, charts or any questions.
Analysis done on the Tradenation Charts
Disclosure: I am part of Trade Nation's Influencer program and receive a monthly fee for using their TradingView charts in my analysis.
"Adapt what is useful, reject what is useless, and add what is specifically your own."
— David Perk aka Dave FX Hunter ⚔️
GBPUSD sweep of lowGBPUSD sweep of low reclaim of low and respecting liquidity aree take to weekly high cautiously after that short of lifetime
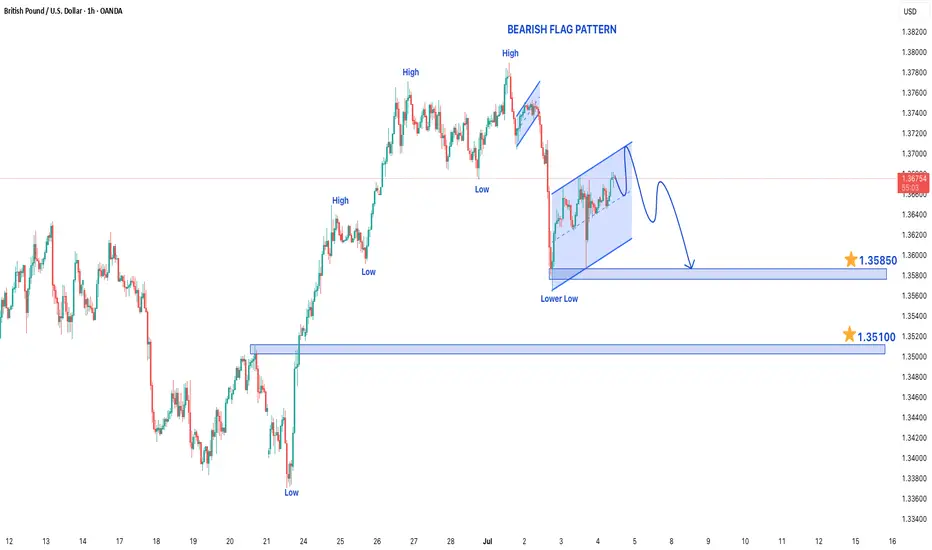
GBP/USD Bearish Trend Analysis GBP/USD Bearish Trend Analysis
The GBP/USD pair is currently exhibiting a bearish trend on the 1-hour chart, with the market forming lower lows, a clear indication of sustained selling pressure. This downward momentum suggests that traders are favoring short positions, and the bearish sentiment may continue in the upcoming trading sessions.
Bearish Flag Pattern Suggests Further Downside
Adding to the bearish outlook, the price action is forming a bearish flag pattern, which is typically a continuation signal in a downtrend. This pattern consists of a sharp decline (the flagpole) followed by a slight upward or sideways consolidation (the flag). A breakdown below the flag’s support could trigger another wave of selling, reinforcing the bearish bias.
Key Support Levels to Watch
If the downtrend continues, the market could target the following support levels:
- 1.35850 – The initial downside target, likely to act as a short-term support zone.
- 1.35100 – A deeper support level that may come into play if selling pressure intensifies.
A break below these levels could open the door for further declines, potentially extending toward 1.34500 or lower, depending on market momentum.
Resistance Level as a Key Barrier
On the upside, the 1.37900 level serves as a critical resistance. If the price retraces higher, this zone could act as a strong barrier where sellers might re-enter. A sustained break above this resistance could invalidate the bearish outlook, signaling a potential trend reversal or consolidation phase.
Trading Strategy Considerations
- Bearish Scenario: Traders may look for short opportunities near resistance levels or upon a confirmed breakdown below the bearish flag.
- Risk Management: A stop-loss above 1.37900 (or a recent swing high) could help mitigate risk if the market reverses unexpectedly.
- Bullish Caution: If GBP/USD breaks above 1.37900 with strong momentum, the bearish thesis may need reevaluation.
Conclusion
The GBP/USD pair remains bearish in the short term, supported by the lower lows and the bearish flag pattern. Traders should monitor the 1.35850 and 1.35100 support levels for potential downside targets, while keeping an eye on 1.37900 as a key resistance that could determine whether the downtrend continues or reverses. Proper risk management remains essential in navigating this market structure.
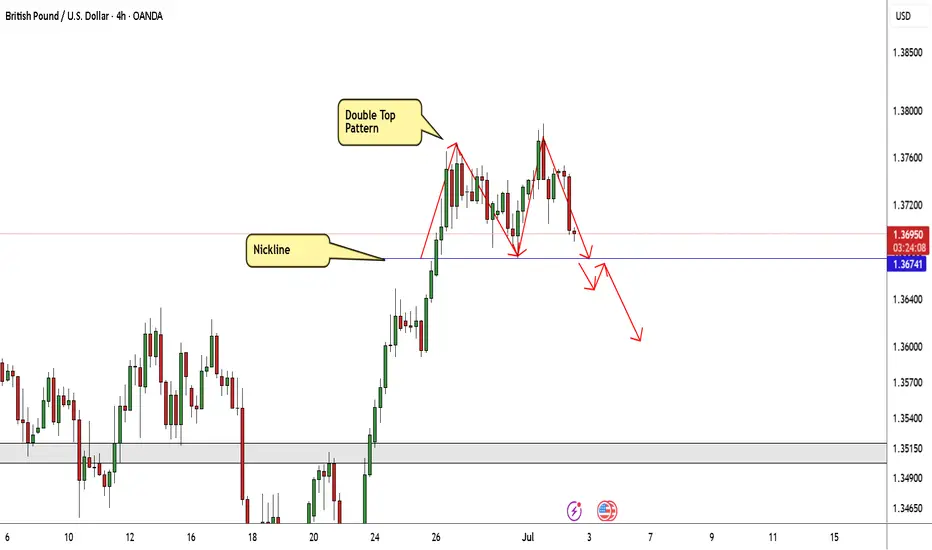
GBP/USD Made A Double Top Pattern , Short After Breakout ? Here is my opinion on GBP/USD 4H Chart , we have a reversal pattern ( Double Top ) but until now we have not a closure below neckline ,so i`m waiting for 4H Closure below it to confirm the pattern and hen we can sell it , if we have not a closure below then this idea will not be valid .
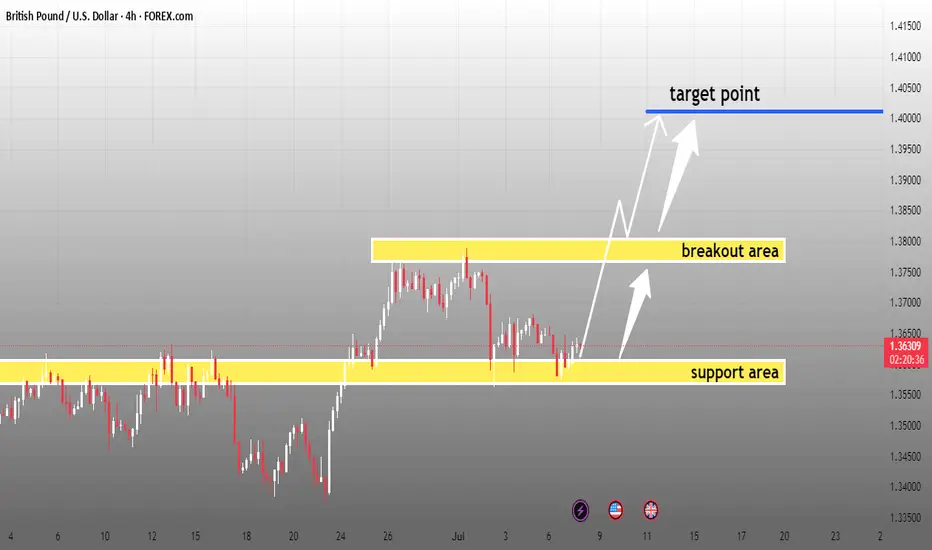
GBP/USD Bullish Breakout Setup | Targeting 1.4000+GBP/USD is showing strong bullish structure after respecting the key support zone around 1.3550–1.3570. A potential breakout above the 1.3740–1.3780 resistance zone could fuel further upside momentum.
🟡 Support Area: 1.3550 – 1.3570
🟡 Breakout Area: 1.3740 – 1.3780
🔵 Target Point: 1.4000+
📈 If the price holds above the breakout zone, we expect a clean rally toward 1.4000 psychological level. Watch for confirmation and volume to support the move
#GBPUSD
#Forex
#FXAnalysis
#PriceAction
#BreakoutSetup
#SmartMoney
#LiquidityGrab
#TechnicalAnalysis
#BullishSetup
#ForexForYou
#ForexTradingView
#FXTrader
#MarketStructure
#ForYou
#ForYou #GBPUSD #BreakoutSetup #SmartMoney #Forex
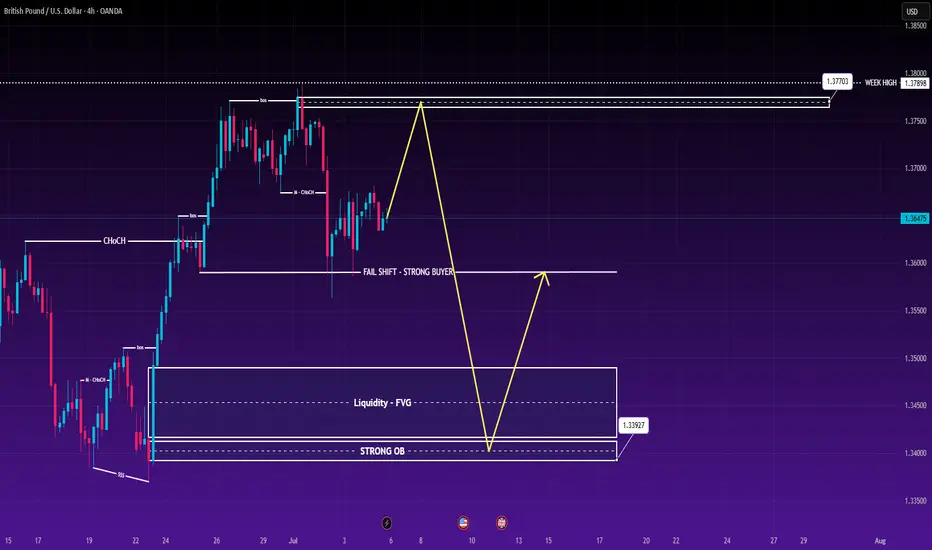
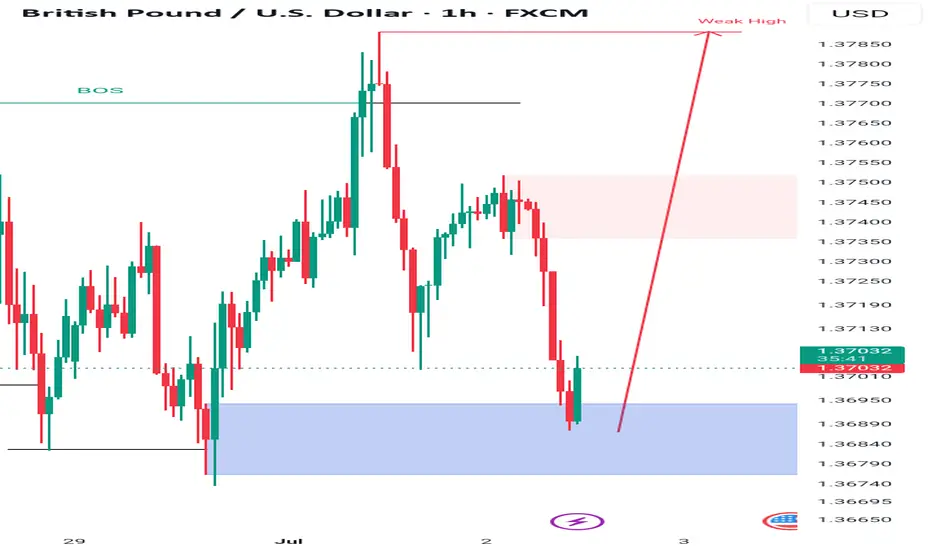
GBP/USD Weekly Plan – 8th to 12th July 2025The British Pound is testing the upper range of its recent rally, just below a high-liquidity supply zone near 1.37898. While short-term bullish momentum remains intact, both the technical structure and upcoming macro events point towards a potential midweek reversal.
📉 Technical Breakdown – H4 Chart
Price has completed a full impulsive leg and is approaching a key supply zone (1.37703–1.37898), aligning with weekly highs.
Previous CHoCH + BOS formations show buyer strength, but recent rejections indicate exhaustion.
Liquidity sits below at 1.35013 and 1.33927, making downside targets attractive for short setups.
🔁 Trade Setups
✅ SELL GBP/USD
Entry: 1.37703
Stop Loss: 1.38000
TP1: 1.37100
TP2: 1.36513
TP3: 1.35013
Rationale: Selling into weak high and potential liquidity trap. Expecting rejection from the top of the weekly range.
✅ BUY GBP/USD
Entry: 1.33927
Stop Loss: 1.33600
TP1: 1.34500
TP2: 1.35237
TP3: 1.36900
Rationale: Buying from a strong demand zone and order block with FVG confluence. Clean upside potential if market respects structure.
🧠 Macro Context – What to Watch
🇬🇧 GBP Drivers:
BOE Governor Bailey Speaks (Twice this week) – May offer clarity on future monetary stance.
🇺🇸 USD Drivers:
Fed Chair Powell Speaks – Markets watching for tone on rate path.
NFP Jobs Report (Friday) – Forecast: 147K. A strong figure could support USD.
Unemployment Claims / Rate – A key pair of metrics for short-term dollar moves.
🧩 A hawkish Fed tone + strong NFP = stronger USD → pressure on GBP/USD.
📊 Key Zones
Zone Role Notes
1.37898 Weekly High Strong resistance + sell-side liquidity trap
1.37703 Sell Entry Within supply zone
1.33927 Buy Entry Order block + FVG zone, ideal reversal zone
1.35013 Major Target Previous BOS zone and liquidity below structure
⚠️ Strategy Guidance
Wait for confirmations on H1–H4 (CHoCH / FVG rejection).
Avoid new positions 1 hour before or after red-folder events (e.g., NFP, Bailey speech).
Trailing SL recommended once TP1 is reached.