GBPUSDHello Traders! 👋
What are your thoughts on GBPUSD?
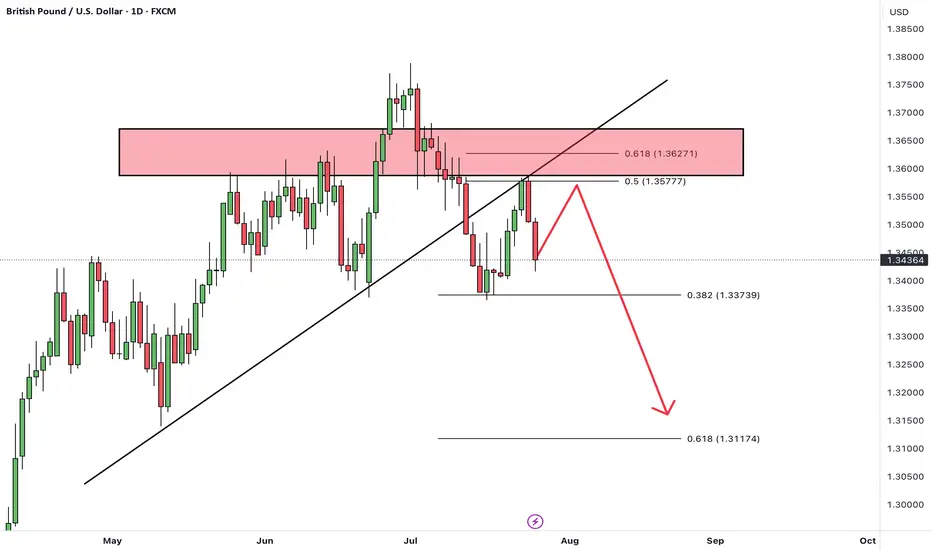
GBP/USD has broken below a trendline and has completed a retest (pullback) to the broken level.
The pair is now positioned for a potential downward move.
After some short-term consolidation, we expect price to drop at least toward the next identified support level.
As long as GBP/USD stays below the broken trendline, the bearish bias remains valid, and further downside is likely.
Don’t forget to like and share your thoughts in the comments! ❤️
GBPUSD trade ideas
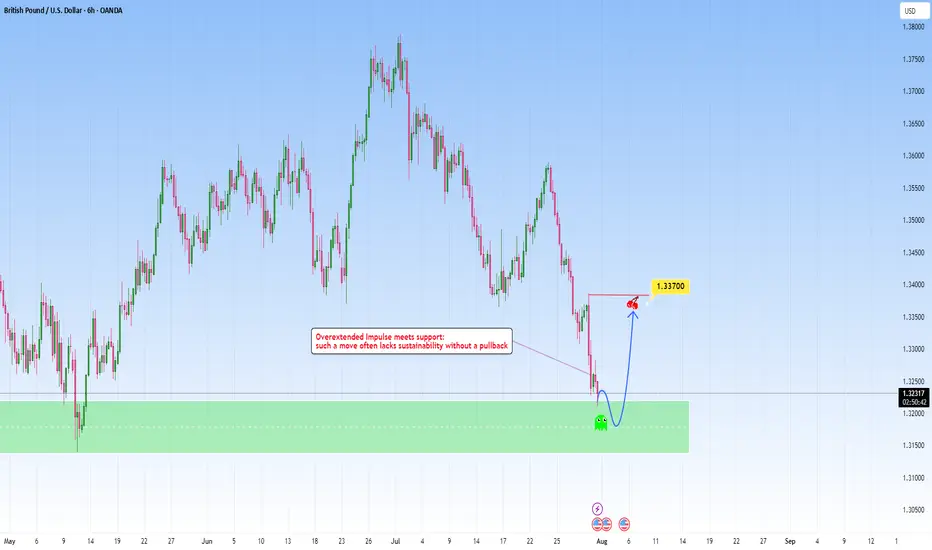
GBPUSD: Overextended move meets with supportAfter a steep and aggressive sell-off, price has tapped into a clear zone. This recent move wasn't gradual: it was impulsive and sharp, which tells us one key thing: exhaustion is likely.
The overextension into it without any meaningful pullback typically highlights imbalance, where price moves ahead of structure and becomes vulnerable to correction. But price doesn’t move in straight lines forever. Markets that fall too quickly tend to burn out just as fast. When such aggressive pushes meet with a clean, resistance like this one, they often trigger the exact opposite, a snapback correction.
I am now watching for signs of absorption and accumulation. This could play out in the form of sideways candles, wick rejections, or a sudden reversal spike. These are early signs that smart money might be stepping in.
My projected target would be toward the 1.33700 area, from the last impulsive drop. It’s a classic mean reversion setup, not just technical but psychological. Traders who chased the move late may find themselves trapped, fueling the correction as they’re forced to exit.
GBPUSD - NEW BREAKDOWN !Hello Traders !
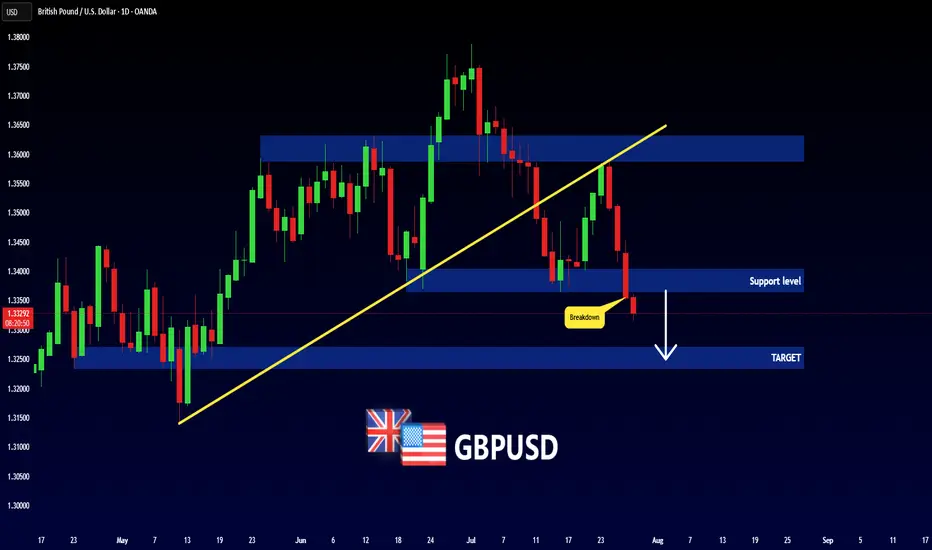
The GBPUSD broke the support level (1.34037 - 1.33650).
This key level becomes new resistance!
So, I expect a bearish move📉
_______________
TARGET: 1.32710🎯
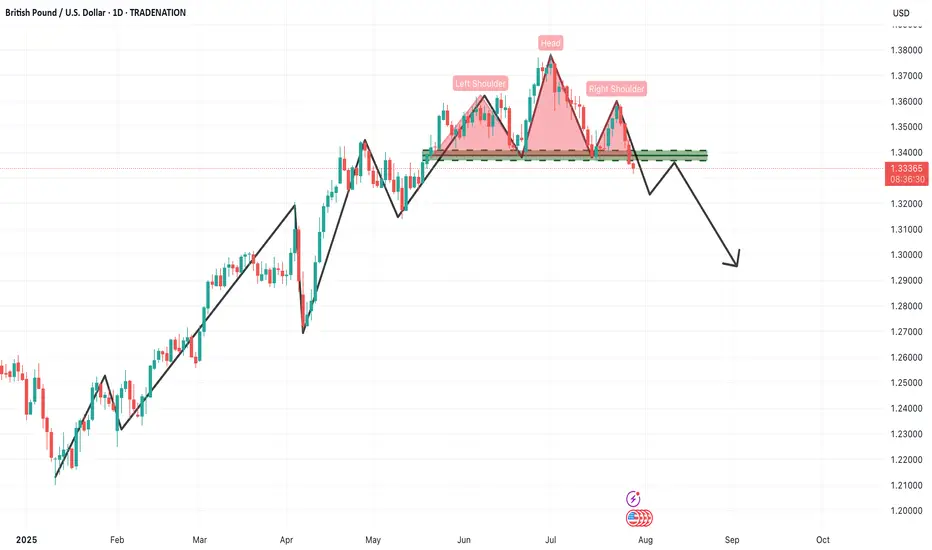
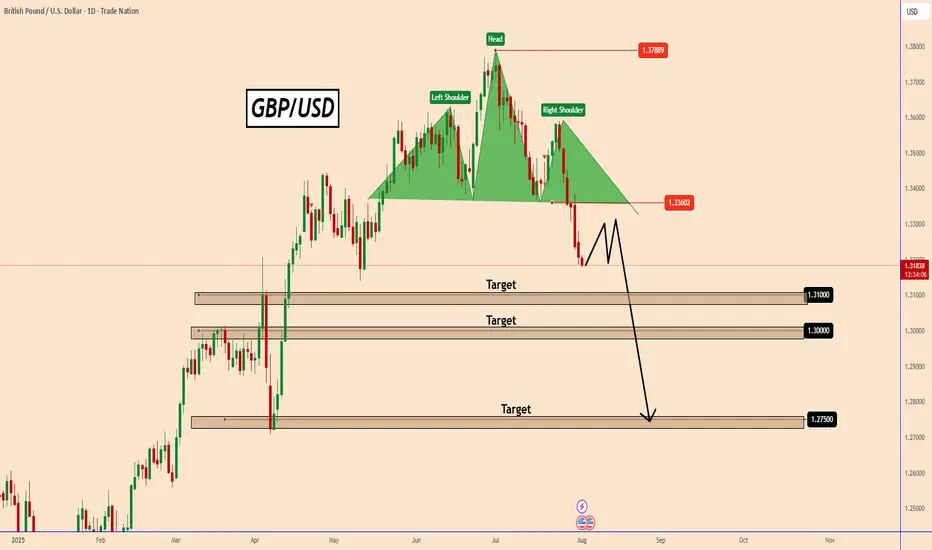
GBPUSD – Daily Timeframe Analysis: Head & Shoulders PatternThe GBPUSD daily chart is currently presenting a textbook Head & Shoulders reversal pattern, a powerful bearish signal that often marks the end of an uptrend and the beginning of a new downward cycle. This setup demands attention from swing and positional traders alike, especially considering the size and clarity of the structure.
🔍 Pattern Breakdown
Left Shoulder: Formed in late May, establishing a significant high before a corrective move.
Head: A higher peak was made in early June, which now stands as the pattern's highest point.
Right Shoulder: A lower high formed in mid-July, indicating weakening bullish momentum.
Neckline: The crucial horizontal support zone around 1.3330–1.3340 was tested multiple times and has now been decisively broken, triggering a confirmed bearish setup.
📊 Technical Significance
This Head & Shoulders pattern becomes especially meaningful due to:
Multiple rejections at the neckline, confirming its strength as support-turned-resistance.
Bearish volume expansion on the breakdown, adding weight to the selling pressure.
Formation on a daily timeframe, suggesting a long-term trend reversal rather than a short-term pullback.
📌 Trading Strategy for Traders
✅ Sell Setup (Short Position)
Entry: Around the neckline zone on retest (1.3320–1.3340)
Stop Loss: Above the right shoulder (~1.3550)
Targets:
🎯 Target 1: 1.3100 (psychological and horizontal support)
🎯 Target 2: 1.2900 (measured move from head to neckline)
🎯 Target 3: 1.2650–1.2600 (extended downside zone based on structure)
⚠️ Risk Management Tips:
Don’t chase the breakdown — wait for a pullback/retest of the neckline to get a better risk/reward entry.
Ensure position sizing is appropriate based on the stop loss distance.
If price reclaims the neckline with strong bullish momentum and closes above 1.3350, exit short and reevaluate.
🧠 What Traders Should Keep in Mind
Macro Fundamentals: Watch upcoming economic events like BoE rate decisions, US NFP, and inflation data, which can cause volatility and impact the technical scenario.
Dollar Index (DXY) trend should also be monitored closely. If DXY rallies, GBPUSD breakdown can accelerate.
Trendline Confirmation: Align this with any break of rising trendlines drawn from previous lows.
📌 Final Thought
This pattern marks a crucial turning point in GBPUSD. The momentum has clearly shifted from buyers to sellers, and the breakdown opens up significant downside room. As a swing or position trader, this is a high-probability setup with a clear invalidation point (above the right shoulder) and a favorable risk-reward ratio.
📉 Patience and precision are key here. Let price come to you at the neckline, confirm rejection, and then take the trade with confidence.
=================================================================
Disclosure: I am part of Trade Nation's Influencer program and receive a monthly fee for using their TradingView charts in my analysis.
=================================================================
GBPUSD Technical Overview GBPUSD Technical Overview
GBPUSD recently peaked at 1.3790, aligning with a key historical resistance zone from October 2021. On the Daily Chart, this move completed a significant bearish pattern, suggesting the potential for further downside.
Over the last 7 trading sessions, the pair has declined nearly 400 pips, moving decisively lower.
Given the steep drop, a technical correction may be on the horizon before GBPUSD potentially resumes its bearish trajectory, as indicated by the current chart setup.
If NFP data can be strong today, GBPUSD could extend to the first target 1.3100 or 1.3000 as shown in the chart.
Overall, GBPUSD looks like it has started a downtrend.
Let's see how the price will unfolds.
You may find more details in the chart!
Thank you and Good Luck!
PS: Please support with a like or comment if you find this analysis useful for your trading day
Disclosure: I am part of Trade Nation's Influencer program and receive a monthly fee for using their TradingView charts in my analysis.
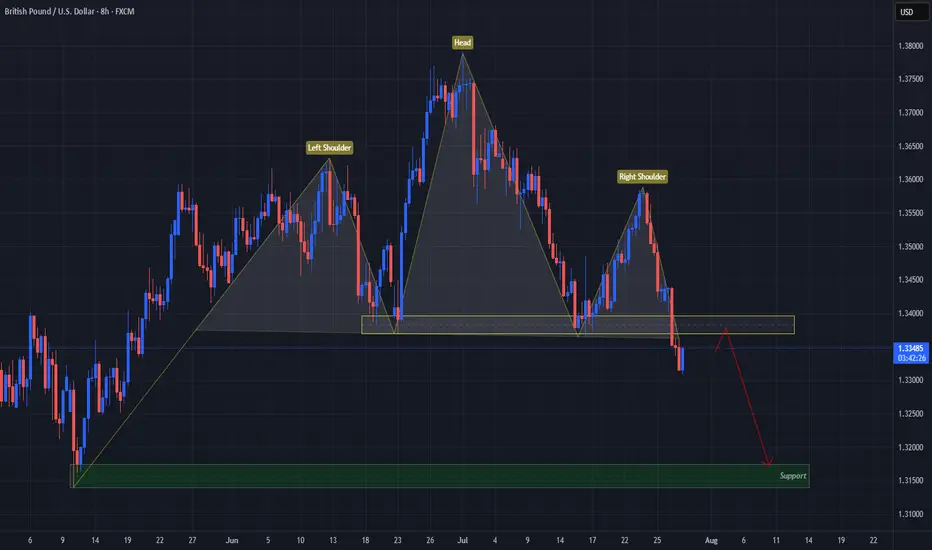
USD Turns GBP On Its "Head"FX:GBPUSD has formed a Head & Shoulders Pattern!
Price has already broken down below the "Neckline" to Confirm that Pattern.
Currently, Price is working its way back up to retest the Breakout and if the level is strong enough and holds, we could see Price follow through with its reversal to lower prices!
If the retest is successful, the May 12th Lows of 1.31741 - 1.31394 could be a good Support level to set as a Price Target.
Now we wait for a Retest!
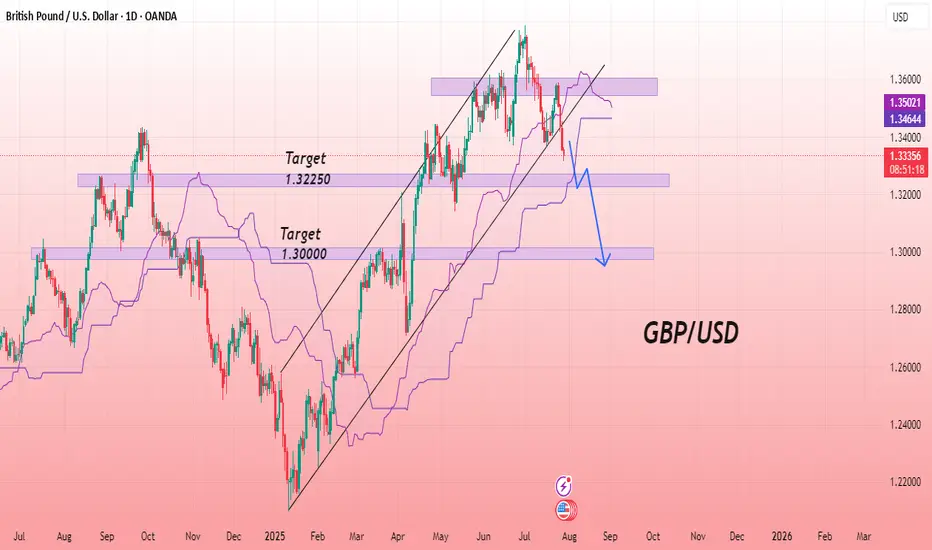
GBP/USD Bearish Breakdown with Downside PotentialThe GBPUSD chart indicates a bearish trend, with price breaking below a key ascending support line. This breakdown suggests a shift in momentum, favoring sellers. The price is currently trading below the Ichimoku cloud, which reinforces the bearish bias. A pullback to the broken support zone may offer a retest before further decline. The structure points toward lower lows, and the chart outlines two potential support levels where price may react. Continued downside is expected if the current resistance zone holds. Bearish continuation appears likely as long as price remains below the recent high and beneath the cloud.
Entry Sell: 1.33360
First Target point: 1.32250
Second Target point: 1.30000
If you found this analysis helpful, don’t forget to drop a like and comment. Your support keeps quality ideas flowing—let’s grow and win together! 💪📈
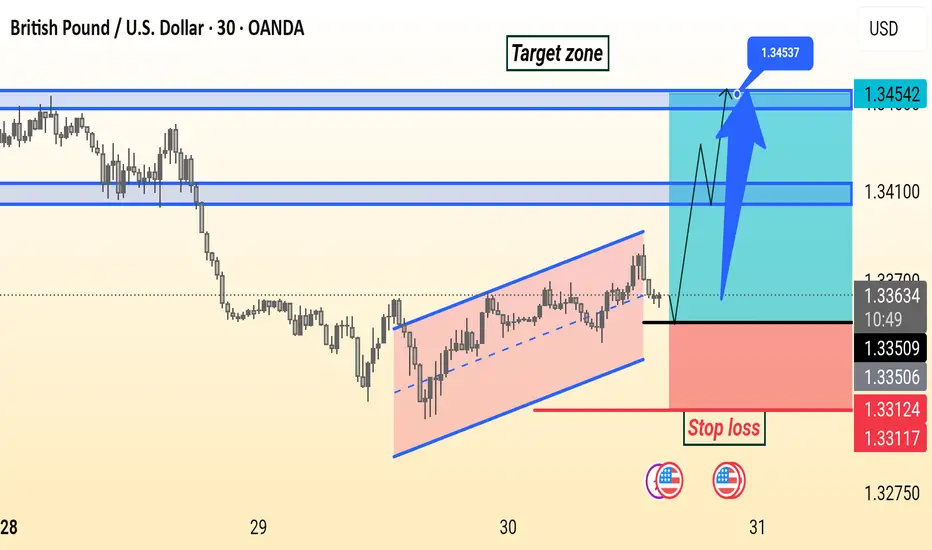
GBPUSD Setup GBP/USD is forming a bullish channel on the 30-minute chart. Price is expected to break above resistance near 1.3365, targeting the 1.3455 zone. Stop loss is set below the channel at 1.3312.
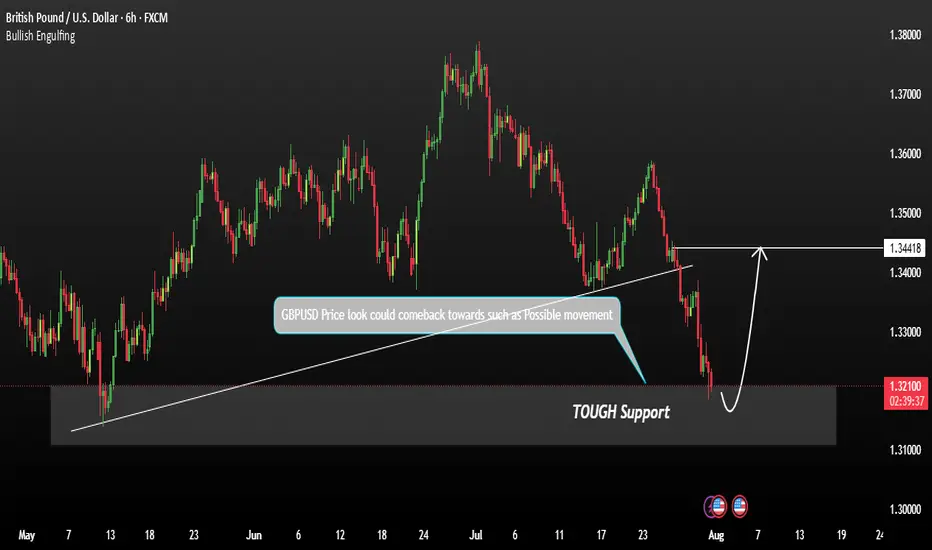
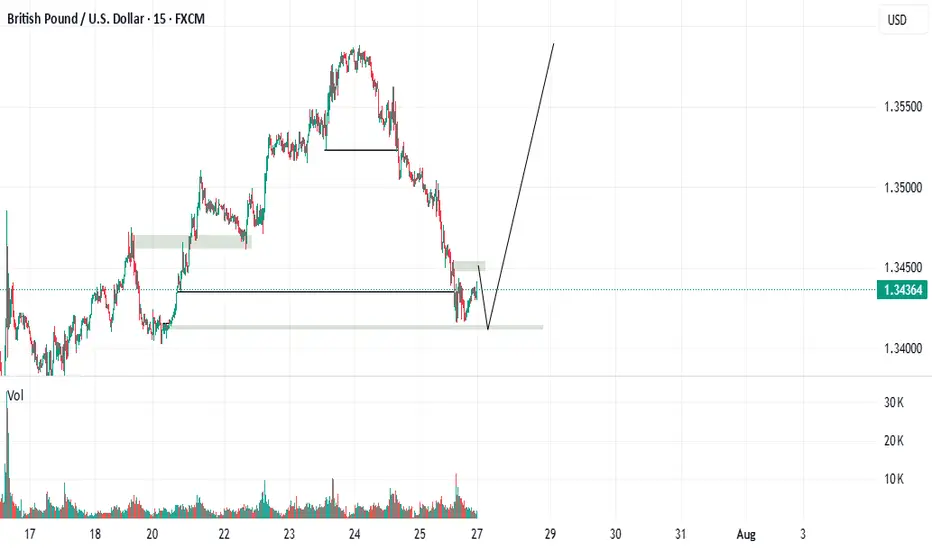
GBPUSD shows signs of a potential recoveryGBPUSD shows signs of a potential recovery towards the resistance zone. This price action indicates a possible short-term reversal or consolidation phase. We are currently observing for confirmation signals such as:
These could signal a build-up for a move back toward the key resistance at 1.34400. Traders should stay alert for price behaviour near this level as it may act as a turning point or breakout trigger.
You may find more details in the chart.
Trade wisely best of luck buddies.
Ps: Support with like and comments like for better analysis.
GBPUSD: Sellers Are Taking ControlWelcome back to the Weekly Forex Forecast for the week of July 28 - Aug 1st
In this video, we will analyze the following FX market:
GBPUSD
GBP is weak vs USD. GU is heading lower with a bit of steam.
The Monthly and the Weekly are still bullish, but the Daily and 4H indicate weakness. I would not entertain longs until I see a bullish BOS.
Look for the CISD on the 4H in the beginning of the week, confirming sells are the way to go.
Enjoy!
May profits be upon you.
Leave any questions or comments in the comment section.
I appreciate any feedback from my viewers!
Like and/or subscribe if you want more accurate analysis.
Thank you so much!
Disclaimer:
I do not provide personal investment advice and I am not a qualified licensed investment advisor.
All information found here, including any ideas, opinions, views, predictions, forecasts, commentaries, suggestions, expressed or implied herein, are for informational, entertainment or educational purposes only and should not be construed as personal investment advice. While the information provided is believed to be accurate, it may include errors or inaccuracies.
I will not and cannot be held liable for any actions you take as a result of anything you read here.
Conduct your own due diligence, or consult a licensed financial advisor or broker before making any and all investment decisions. Any investments, trades, speculations, or decisions made on the basis of any information found on this channel, expressed or implied herein, are committed at your own risk, financial or otherwise.

GBP/USD Short Bias – Bearish Fundamentals + Smart Money StructurThe macro environment continues to favor USD strength and GBP weakness, setting up a clean short scenario both fundamentally and technically.
Fundamentals First:
Bank of England is expected to cut rates in the coming months as inflation falls and growth slows. June CPI came in lower than expected, and consumer spending remains weak.
UK GDP growth is flatlining, and PMI data continues to signal contraction in services and manufacturing.
IMF has warned the UK about fiscal imbalances and productivity issues, adding bearish pressure to GBP outlook.
Meanwhile, the Fed remains on hold, with strong U.S. labor data, robust consumer spending, and persistent core inflation — supporting the USD.
Institutional Outlook:
JPMorgan and Citi see GBP/USD downside risks as BoE policy shifts from restrictive to accommodative.
ING and BofA have noted bearish positioning building in GBP against the USD.
Technical Setup:
On the 4H chart, we’re watching a clean Head & Shoulders structure
A break and retest of the neckline confirms downside continuation.
Setup is backed by:
Institutional sentiment
Macro data divergence (UK vs U.S.)
Smart money structure + liquidity zones
GBPUSD BUY TIGER SETUP LOOOOOOOOOOOONGwelcome
we have strong mitigation order block on time frame weekly and daily
and on 4H we have break downtrend and retest on it
and we in well discount area
and we have demand on high time frame
so this is good idea for buying
Don't forget to follow me
so that get refresh analysis
IDEA GBPUSDhi everyone good monday! have idea buy limit in order price 1.34180 whit 16 pip stop loss. Can be executed manual or put order limit i preffer no take risk and wait till it touch my area.

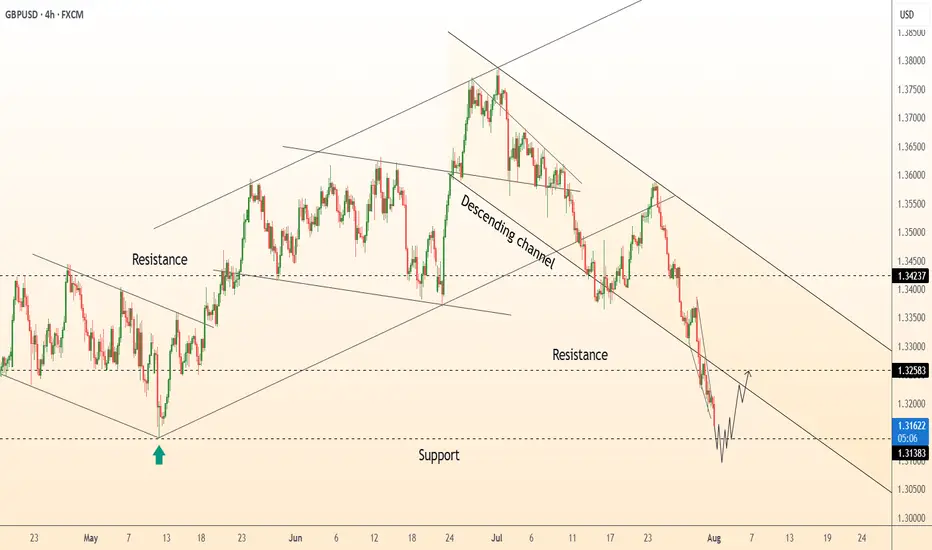
DeGRAM | GBPUSD is forming the falling wedge📊 Technical Analysis
● GBPUSD is attempting a reversal from the lower boundary of a descending channel after forming a short-term double-bottom near 1.3138.
● Price is now climbing toward 1.3258 resistance, supported by bullish divergence and a break of the local falling wedge.
💡 Fundamental Analysis
● The USD is under pressure ahead of key NFP data, as ISM manufacturing misses weighed on Treasury yields.
● Positive UK PMI and consumer lending data have supported GBP, with BoE policy expectations firming above neutral.
✨ Summary
Long bias above 1.3138. Breakout targets 1.3258 ➜ 1.3423. Setup valid while price holds above 1.3110 support.
-------------------
Share your opinion in the comments and support the idea with a like. Thanks for your support!
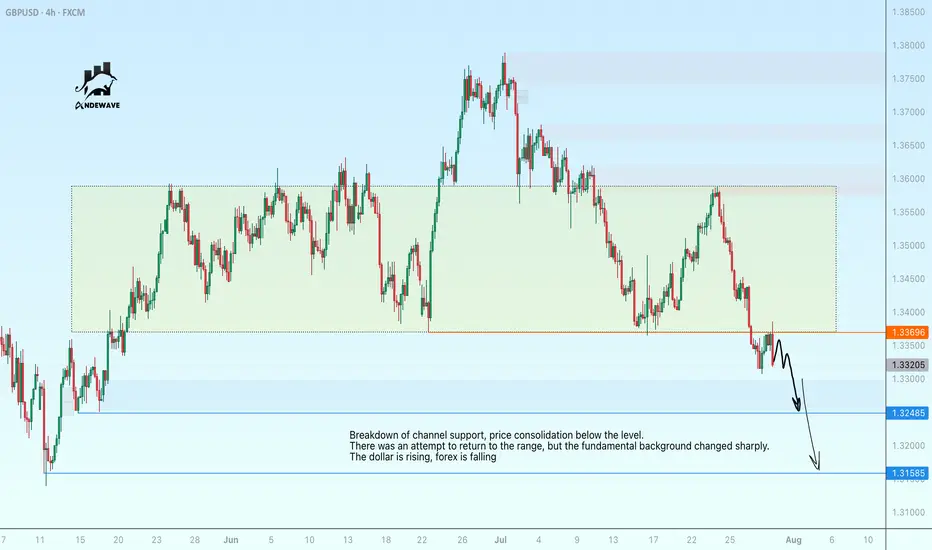
GBPUSD has consolidated in the selling zoneBreakdown of channel support, price consolidation below the level. There was an attempt to return to the range, but the fundamental background changed sharply. The dollar is rising, forex is falling.
GBPUSD may continue its local decline to 1.3158.
GBP/USD 4H Bearish Reversal Setup. GBP/USD 4H Chart Analysis (July 24, 2025):
Price is rejecting resistance near 1.35709, forming a bearish setup. A short position is highlighted with entry around 1.35067, stop loss above resistance, and target near the 1.33786 support zone. Bears aim for continuation toward 1.33745.

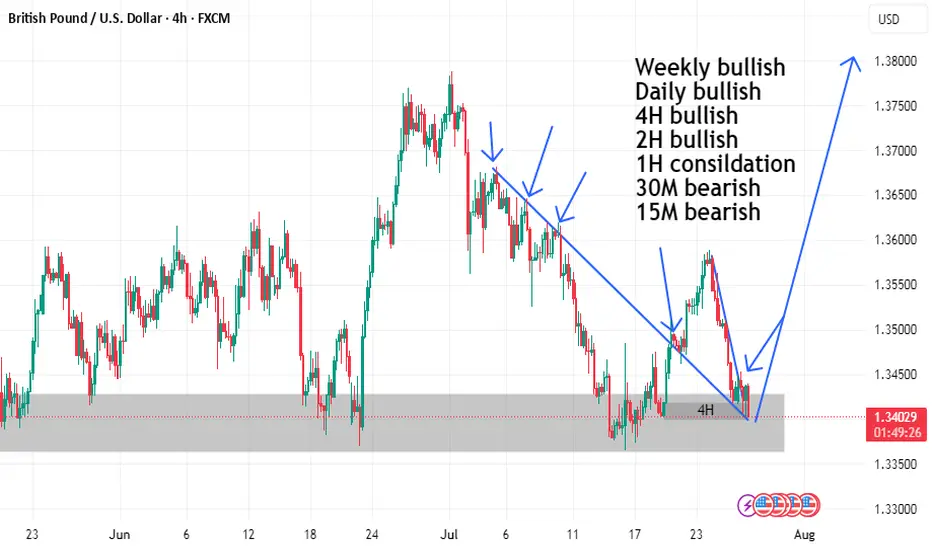
#GBPUSD: Going As Expected, Strong Move AheadHey Everyone,
We have a good opportunity coming up on gbpusd; since our last update on gbpusd, price went as expected. We will see huge increase in price in coming days. Good luck and take care!!
If you like our work then please like and comment.
a bit short then a great long!Hello all. as you see market need a new low and after that it will fly. be happy and earn money right here. I try to fix my bugs and tell what it is better.(wink)
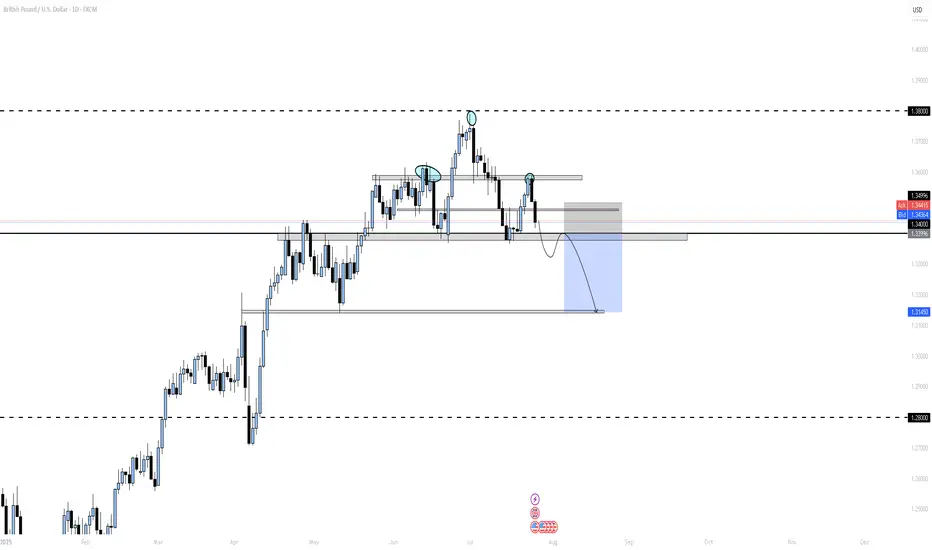
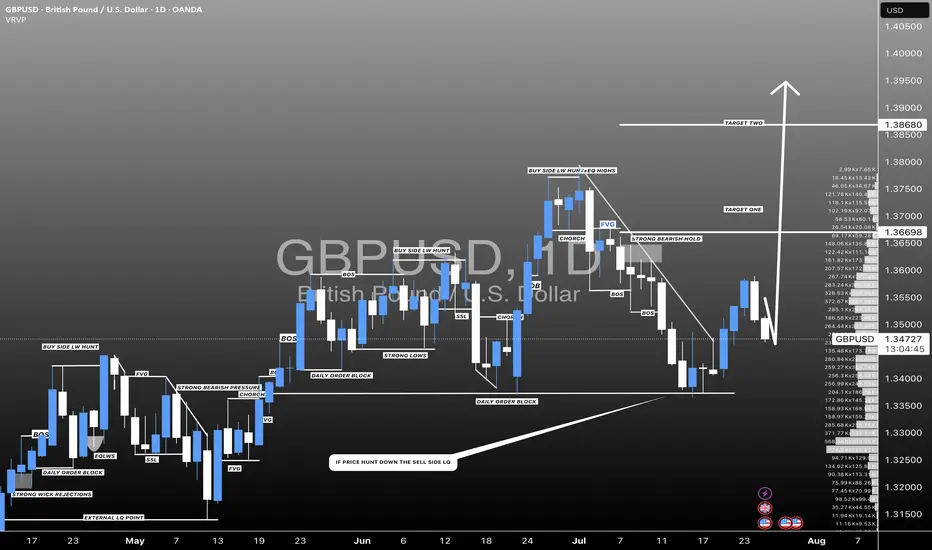
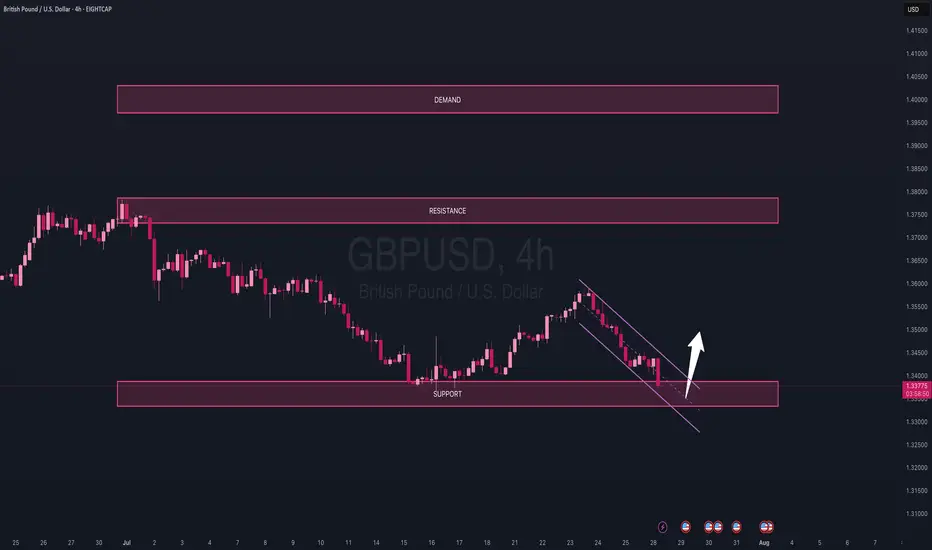
GBP/USD OUTLOOKOn the monthly timeframe, GBP/USD pushed back up this July to retest a key resistance zone, which originally acted as a strong demand area back in January 2022. This level was first tapped again in June, leading to a rejection—and now, July has repeated that pattern, dropping 421 pips from that same zone.
Price is now entering a monthly support level that was previously resistance, showing signs of a potential bounce. My current bias is bullish from this support area, with the expectation that price may begin to climb again from here.
Ideally, I would like to see price eventually reach the next significant demand zone, which was formed in July 2021. However, that level is still quite a distance away, so in the short term, I will be focusing on buy setups.
My plan is to enter longs, placing stop losses just below major daily points of interest (POIs). This approach allows flexibility while managing risk appropriately.
⚠️ Reminder: There is major USD news this week, so it’s crucial to stay disciplined. Always protect your capital and risk no more than 1–2% per day.
Stay patient, stay focused.
Happy trading!
GBPUSD I Its ready for the deeper pullback - COT OverviewHey what up traders welcome to the COT data and Liquidity report. It's always good to go with those who move the market here is what I see in their cards. I share my COT - order flow views every weekend.
🎯 Non Commercials added significant longs and closed shorts at the same time. So for that reason I see the highs as a liquidity for their longs profits taking.
📍Please be aware that institutions report data to the SEC on Tuesdays and data are reported on Fridays - so again we as retail traders have disadvantage, but there is possibility to read between the lines. Remember in the report is what they want you to see, that's why mostly price reverse on Wednesday after the report so their cards are hidden as long as possible. However if the trend is running you can read it and use for your advantage.
💊 Tip
if the level has confluence with the high volume on COT it can be strong support / Resistance.
👍 Hit like if you find this analysis helpful, and don't hesitate to comment with your opinions, charts or any questions.
Analysis done on the Tradenation Charts
Disclosure: I am part of Trade Nation's Influencer program and receive a monthly fee for using their TradingView charts in my analysis.
"Adapt what is useful, reject what is useless, and add what is specifically your own."
— David Perk aka Dave FX Hunter ⚔️

GBP/USD 4H Chart Analysis (Bearish Flag) Read the caption📉 GBP/USD 4H Chart Analysis
Pattern Identified: Bearish Flag Pattern
Timeframe: 4-Hour (4H)
Currency Pair: GBP/USD
🔍 Chart Explanation:
This chart illustrates a classic Bearish Flag Pattern, which is a continuation pattern signaling a potential further decline in price after a temporary consolidation.
Downtrend Leg (Flagpole):
The strong and sharp bearish move on the left side of the chart forms the flagpole, indicating aggressive selling pressure.
Consolidation (Flag Formation):
Price enters a rising channel (the flag) which reflects a short-term corrective phase or pullback. This consolidation occurs within the Resistance Zone, suggesting weakening bullish momentum.
Resistance Zone:
Marked in blue, this zone is where the price struggled to break above, and it acts as a ceiling. Rejection from this zone confirms bearish pressure and increases the likelihood of a breakdown.
Breakdown & Target Levels:
The chart shows that price has broken out downward from the flag pattern, triggering a continuation of the prior downtrend.
Two important support levels are highlighted:
🔸 1st Support: 1.33449 – This is the immediate target where price may pause or react.
🔸 2nd Support: 1.32408 – This is the extended target if selling pressure continues.
Ichimoku Cloud (Background):
The cloud behind the price action represents market sentiment. The red cloud suggests a bearish bias aligning with the flag pattern breakdown.
🧠 Technical Summary:
This setup favors a sell-side outlook. The rejection from resistance within a bearish flag and subsequent breakdown confirm bearish momentum. Traders may look for selling opportunities below the flag breakdown with targets at the mentioned support zones.

DeGRAM | GBPUSD reached the lower boundary of the channel📊 Technical Analysis
● GBPUSD has broken out of a falling wedge within a descending channel, reclaiming the lower boundary of the broader structure.
● Price is consolidating just above 1.33160 support and appears ready to retest the 1.34650 resistance, aided by a series of higher lows and a bullish break of short-term trendlines.
💡 Fundamental Analysis
● Weakening USD sentiment continues after Friday’s softer core PCE and downward revision of Michigan inflation expectations.
● UK economic sentiment improved after recent wage growth and mortgage approval data exceeded forecasts, bolstering GBP.
✨ Summary
Breakout from wedge confirms bullish bias. Support at 1.33160; target 1.34650 short-term. Watch for rally continuation while holding above 1.33625.
-------------------
Share your opinion in the comments and support the idea with a like. Thanks for your support!

GBPUSD ShortGBP/USD Short Bias – Target 1.2697
GBP/USD failed to hold above 1.35 and is forming lower highs, signaling bearish momentum.
A break and close below 1.3350 could trigger further downside to 1.3249 → 1.30 → 1.2697 (major weekly support).
MACD: Bearish crossover, momentum fading.
RSI: 38, room to drop before oversold.
Fundamentals: Weak UK data + expected BoE rate cut, while USD strengthens on trade deal optimism.
Plan: Wait for a clean break below 1.3350 to enter short, invalidation above 1.3450.
