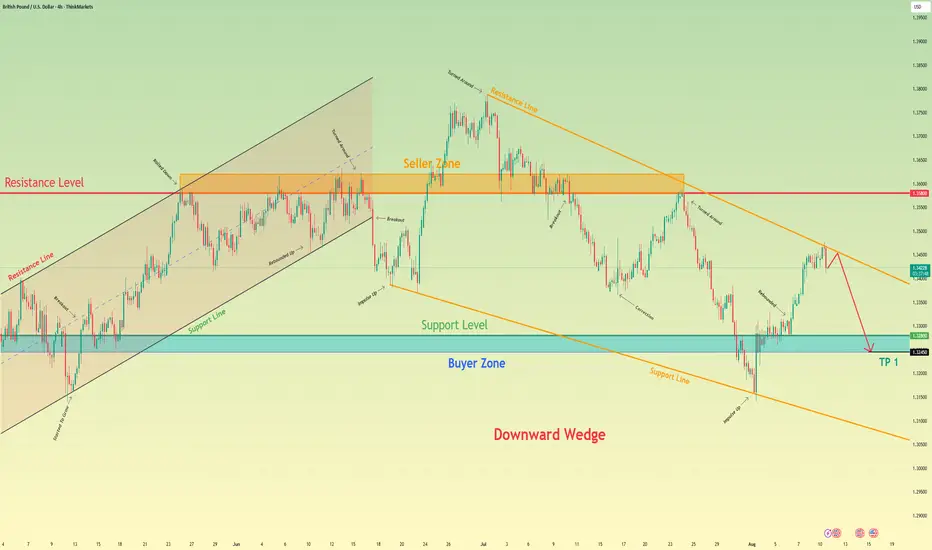
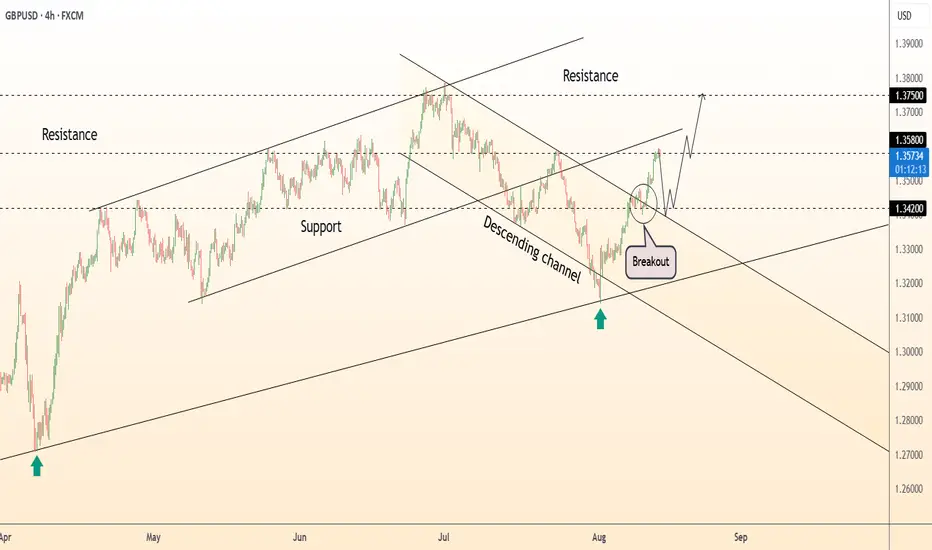
British Pound can little grow and then drop to buyer zoneHello traders, I want share with you my opinion about British Pound. If we look at the chart, we can see how the price started to grow inside an upward channel, where it at once broke the 1.3280 level. In the channel, it rose to the resistance level, which coincided with the seller zone, after which it rebounded and fell to the support line of the channel. Later, GBP rose to the seller zone and dropped, breaking the resistance level and exiting from the upward channel. Then the price entered to wedge and then made an impulse up, breaking the resistance level, and rose to the resistance line of the wedge. After this movement, it turned around and started to decline. Soon, it broke the 1.3580 level one more time and fell more. But later it turned around and rose to the 1.3580 resistance level, which coincided with the resistance line of the wedge. Then it dropped to the support line of the wedge, breaking the support level, but soon it backed up and rose back to the resistance line of the wedge pattern. Now I expect that the British Pound can continue to decline inside the wedge, and reach the buyer zone, breaking the support level. For this case, I set my TP at 1.3245 points, which coincided with the buyer zone. Please share this idea with your friends and click Boost 🚀
Disclaimer: As part of ThinkMarkets’ Influencer Program, I am sponsored to share and publish their charts in my analysis.
GBPUSD trade ideas
GBPUSD: Reached a clear zone, watching for reversal cluesThe market has recently pushed upwards with momentum.
What we’re looking at here is a leg started with a beautiful initial rejection, the kind I love trading and forecasted previously:
Price is now reaching a clear level that might provoke a small term reaction.
And when price finds its feet in these kinds of zones, I immediately think of what opportunity is offering: If price gives us a confirmation cue, that might be the signal to get involved: not just in candlestick structure but also in volume behavior.
Target: 1.34340
It's a risky setup as this leg has pushed up with strength
Disclosure: I am part of Trade Nation's Influencer program and receive a monthly fee for using their TradingView charts in my analysis.

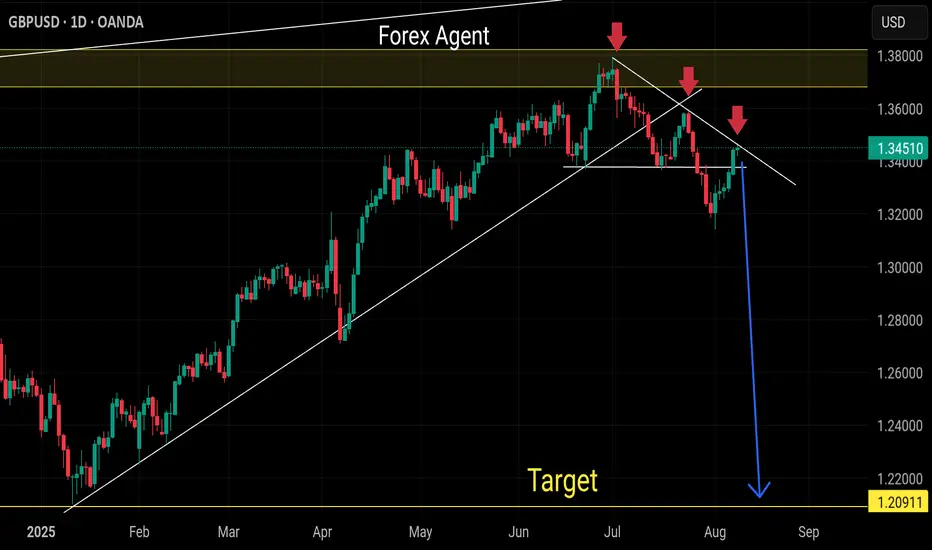
Sell gbpusdBe ready for the big drop coming
Monthly sell structure
Daily resistance trend respecting
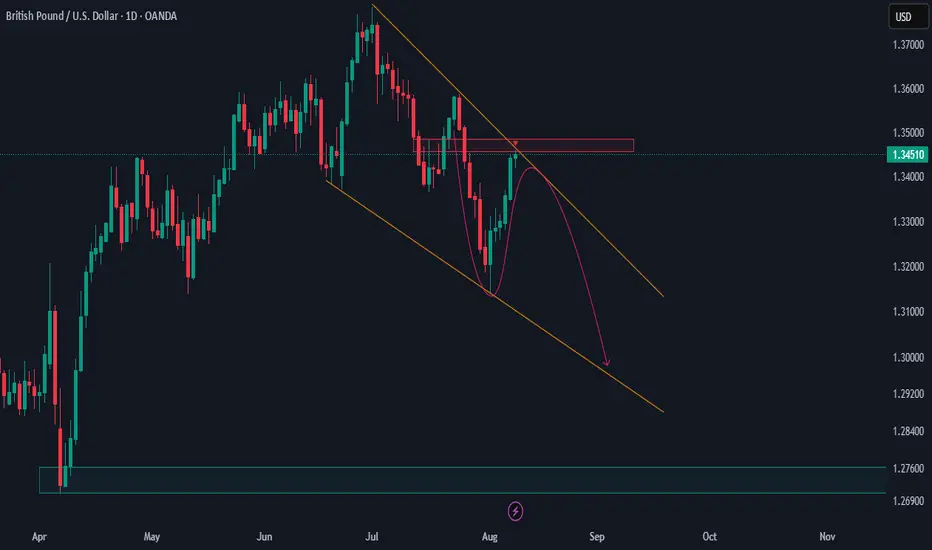
GBPUSD Rally at Potential Turning Point :Is a Reversal Imminent?the pound has been making lower highs and lows on the daily chart, signaling a bearish trend. now hitting a key zone where the trendline and a FVG align, it could be set for a reversal and drop back to the bullish OB below
GBPUSD: Structure AnalysisGBPUSD: Structure Analysis
GBPUSD reached a strong structural resistance area near 1.3590.
In two weeks, GBPUSD rose by almost +450 after the BOE cut interest rates.
However, GBPUSD also rose because the US is expected to cut rates after the BOE cut rates.
As we can see for the same news, the market is not reacting in the same way.
Last week we had the CPI data and the market predicted a rate cut by the FED at the September meeting by 25 to 50 basis points.
US Treasury Secretary Bessent urges Fed cuts, citing models suggesting 1.5% lower rates.
Today, despite this good data, GBP did not rise more than 10 basis points.
The data we have from the US today is preliminary. All are important, but we can have a high impact.
Given that the CPI data has already been released, it is very likely that the CPI data will be consistent with the CPI data insofar as they reflect almost the same thing overall.
I am predicting a downward reaction in prices near our area. However, we need to be careful as the news could easily push the price either way. It is probably better to focus on a sell-off after the news.
You may find more details in the chart!
Thank you and Good Luck!
PS: Please support with a like or comment if you find this analysis useful for your trading day
Disclosure: I am part of Trade Nation's Influencer program and receive a monthly fee for using their TradingView charts in my analysis.

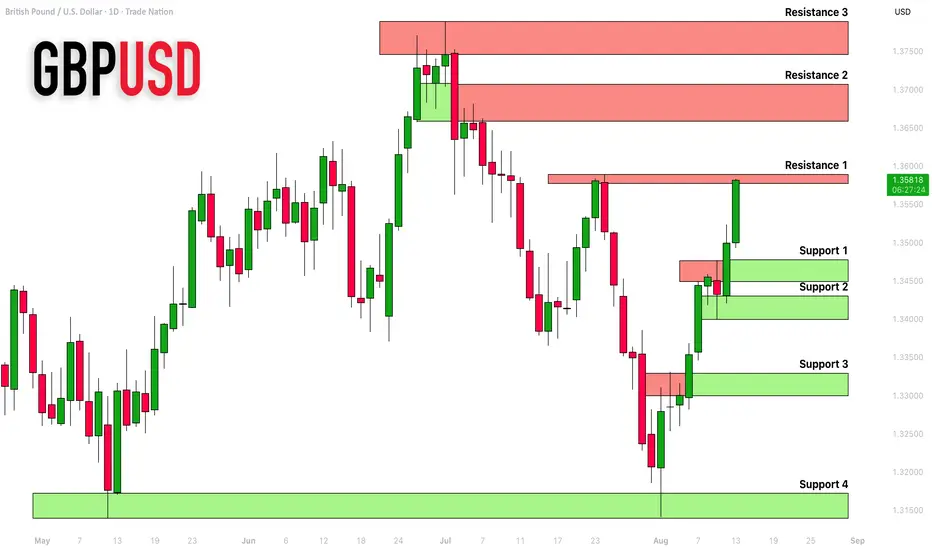
GBPUSD: Complete Support & Resistance Analysis 🇬🇧🇺🇸
Here is my latest structure analysis for GBPUSD.
Resistance 1: 1.3577 - 1.3590 area
Resistance 2: 1.3657 - 1.3705 area
Resistance 3: 1.3745 - 1.3790 area
Support 1: 1.3450 - 1.3480 area
Support 2: 1.3400 - 1.3430 area
Support 3: 1.3300 - 1.3330 area
Support 4: 1.3140 - 1.3174 area
Consider these structures for pullback/breakout trading.
❤️Please, support my work with like, thank you!❤️
I am part of Trade Nation's Influencer program and receive a monthly fee for using their TradingView charts in my analysis.
Cable & Fibre!So, generally I'm happy with the way the market is going. Though a little bit uncertain about how high it wants to go before it resumes its downward spiral, things are going good so far.
Looking at Cable, on an hourly chart, we see that between 06:00 am and 08:00 am (New York Time), there is FVG formed and to its left, there is a breaker. This a perfect setup for me, but I will wait to see if price actually wants to go above the 1.3477 level to reach for the 4H as well as 1H FVG.
I've put a sell limit on the fibre at 1.1635, but I will remove it for now, 'till I have confirmed whether price will go above 1.1698 level, to go into the 4H FVG, the mid-point thereof. I have a sell limit there with a stop loss at .1745.

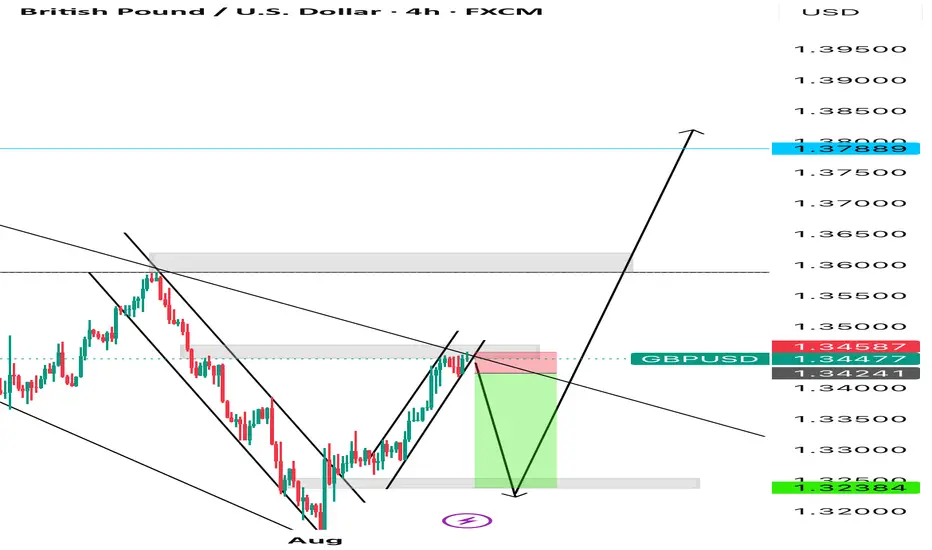
GBPUSD Reached on Resistance Suggesting Downside PhaseGBPUSD has recently pushed higher with momentum Price is now approaching a clear resistance zone, showing an initial rejection from that level. If the rejection strengthens at the current top resistance, we could see a short-term pullback toward 1.34000. This would be a healthy retracement before any further bullish attempts.
The key support in focus is 1.34000.
If price consolidates and breaks above the top resistance with strong volume, it could open room for continuation higher, with the previous rejection becoming invalid.
You May find more details in the Chart.
Ps; Support with like and comments for better analysis Thanks for understanding.

GBPUSD TRADE SETUPWait for recent ranging box then make a decision for new entry otherwise skip this setup

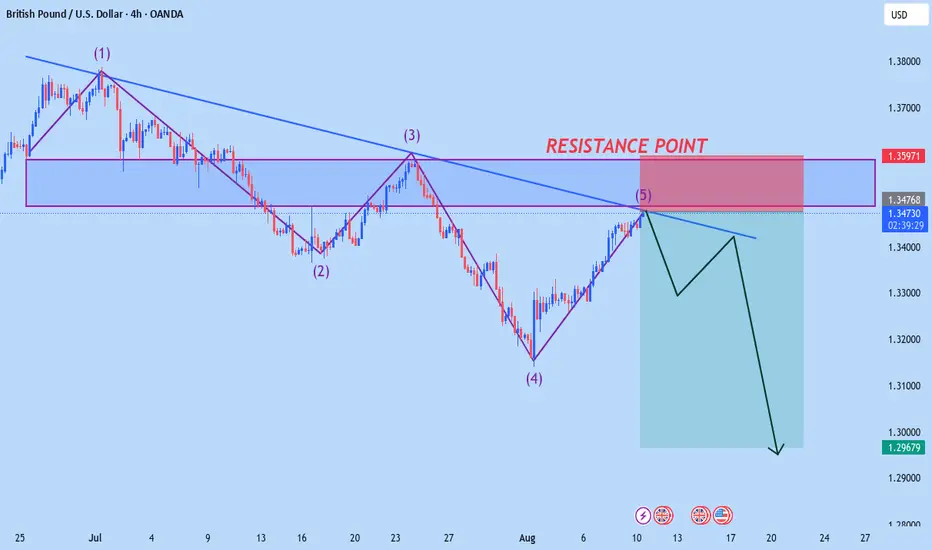
GBPUSD H4 OUTLOOKaccording to H4 analysis GBPUSD market is fowwling in Trade line and Now market will be back from RESISTANCE POINT it is the best chance to go short from resistance level dont be greedy use money management
TRADE AT YOUR OWN RISK
REGARD ALBERT
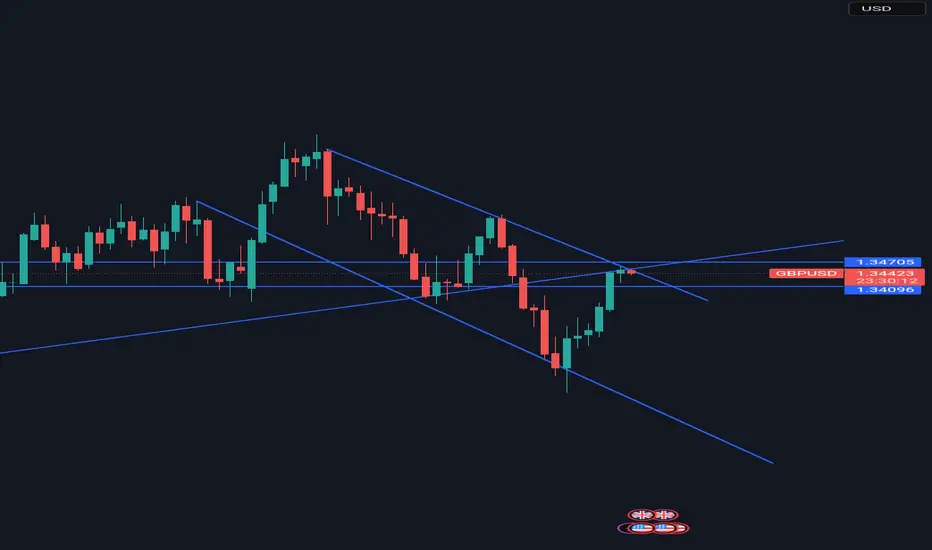
GBPUSD sell setupWhen plenty trading reasons or factors come together in this manner, probability of trade been a success becomes high.
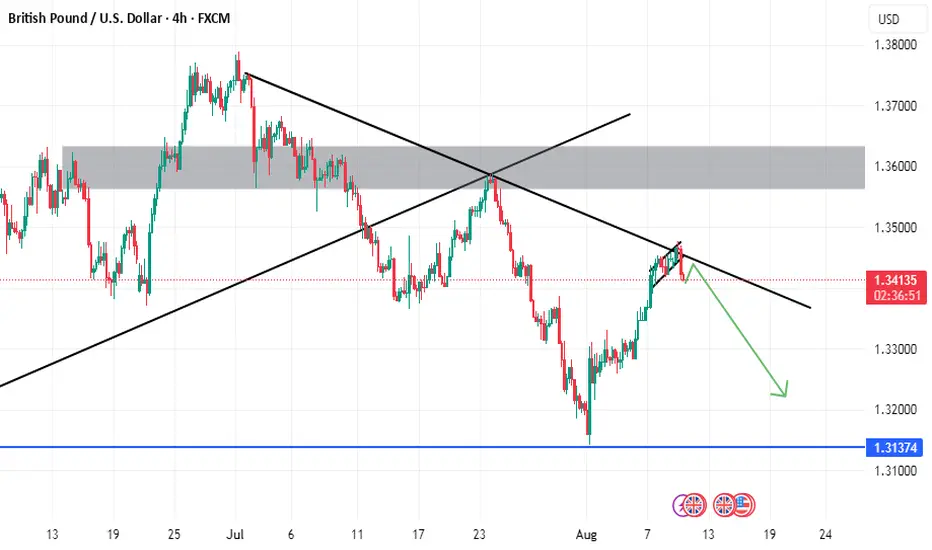
On the daily chart, we have retest of a broken trendline, price touching the upper part of a downward channel plus strong resistance level
Let's see how it plays out
GBPUSD analysis GBPUSD ahead of a week is on third bearish Trendline touch,failure to break out of the structure will result in sharp bearish sentiment,while in contrary breakout will high an increased bullish momentum and sentiment
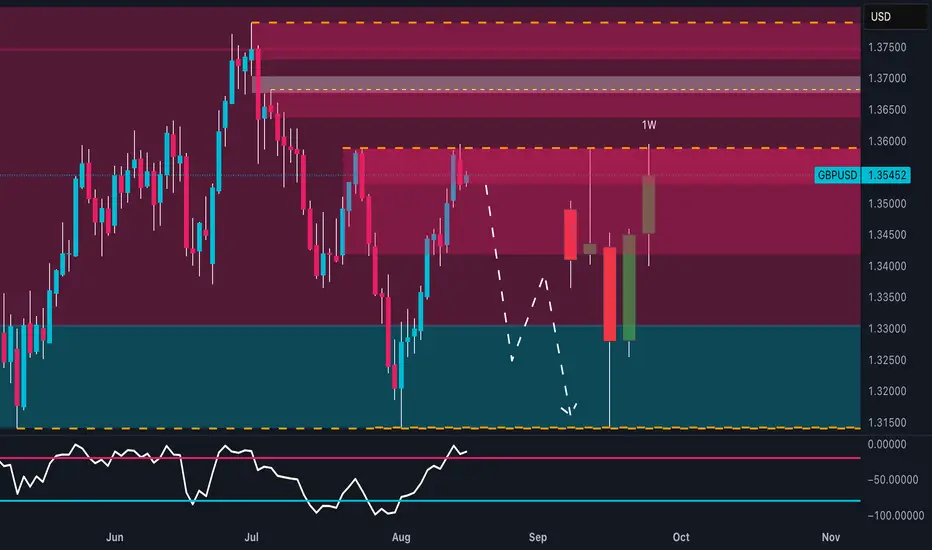
GBP/USD at Weekly Supply – Is the Pound About to Collapse?Technical Outlook:
GBP/USD is currently trading around 1.3535, testing a significant weekly supply zone between 1.3500–1.3600. The recent bullish impulse has brought price back into a strong confluence area marked by prior distribution in late July. The RSI is approaching overbought levels on the daily chart, suggesting a potential short-term exhaustion of buying momentum. My base scenario anticipates a rejection from the current zone, with the possibility of a retracement toward 1.3250–1.3150, aligning with the next demand area and historical price reaction. The projected short-term pattern shows a potential lower high forming before a deeper move down toward the yearly lows.
COT Positioning:
USD Index (as of 05 Aug 2025): Non-commercials decreased longs by -2,561 and slightly increased shorts (+313), showing a minor bearish tilt for USD in the short term.
GBP Futures: Large specs significantly reduced longs (-22,164) while also trimming shorts (-889), with commercials adding substantial long exposure (+20,125). This shift indicates reduced speculative confidence in GBP upside, while commercial buying suggests hedging or value positioning. Overall, COT data tilts toward a potential GBP correction rather than sustained breakout.
Seasonality:
GBP/USD historically underperforms in the second half of August across 5, 10, and 15-year averages. The 20-year tendency shows a mild decline starting mid-month into early September, aligning with the current resistance test and potential for downside momentum.
Sentiment:
Retail sentiment shows 66% short vs. 34% long. The majority of retail traders are positioned against the recent bullish push, which could fuel a brief squeeze higher before reversal. However, the confluence of COT, technical resistance, and seasonality keeps the medium-term bias bearish.
Conclusion & Bias:
Primary scenario: Short bias from 1.3530–1.3600 supply zone targeting 1.3250, then 1.3150 if momentum confirms.
Invalidation: Daily close above 1.3650 would weaken the short setup and open the path toward 1.3700–1.3750.
DeGRAM | GBPUSD reached the resistance level📊 Technical Analysis
● GBPUSD has extended gains after retesting the breakout zone, confirming bullish control within a recovering channel structure.
● Sustained buying pressure targets 1.3750, with intraday pullbacks expected to hold above 1.3500 for trend continuity.
💡 Fundamental Analysis
● BoE policymakers signaled vigilance on inflation persistence, boosting sterling demand alongside stabilizing UK bond yields.
✨ Summary
Bullish above 1.3500; targets 1.3750. Invalidation below 1.3420.
-------------------
Share your opinion in the comments and support the idea with a like. Thanks for your support!
Support & Resistance – Quick Guide In 5 StepsSupport and resistance are key concepts in technical analysis that help traders identify where price is likely to react.
Support acts like a floor — a level where buying interest is strong enough to prevent further declines.
Resistance acts like a ceiling — a level where selling pressure can stop price from rising.
These zones often lead to bounces, reversals, or breakouts, and are used to plan entries, exits, and stop-losses.
How to Identify them:
1. Assess the chart.
2. Identify Swing Points: Look for repeated highs/lows and label them. (Flags)
3. Multiple touches: Highlight the zones with multiple touches. 2+ Touches are stronger.
4. Define: Clearly define the zones. Above is resistance, below is support.
5. Entry: When price makes it way down to support, wait for the reversal. Upon reversal enter on the low time confirmation. Ensure price has failed to break below the support.
Then set TP to the previous High/Resistance zone.
Tips:
Always treat S&R as zones, not exact lines.
Combine with trend, candlestick patterns, or volume for better confluences.
Avoid trading into strong S/R — wait for breaks or retests.

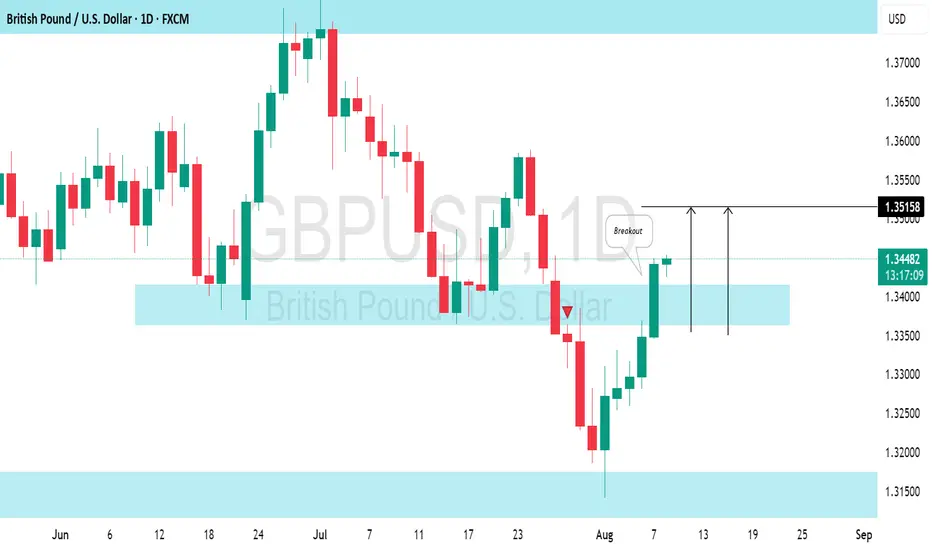
GBPUSD: Back to Bullish Trend?!GBPUSD pair is showing signs of recovery after a prolonged bearish trend.
A confirmed bullish breakout from a significant daily resistance level indicates strong buying pressure.
I anticipate that the market will continue to rise and approach the 1.3515 level shortly.
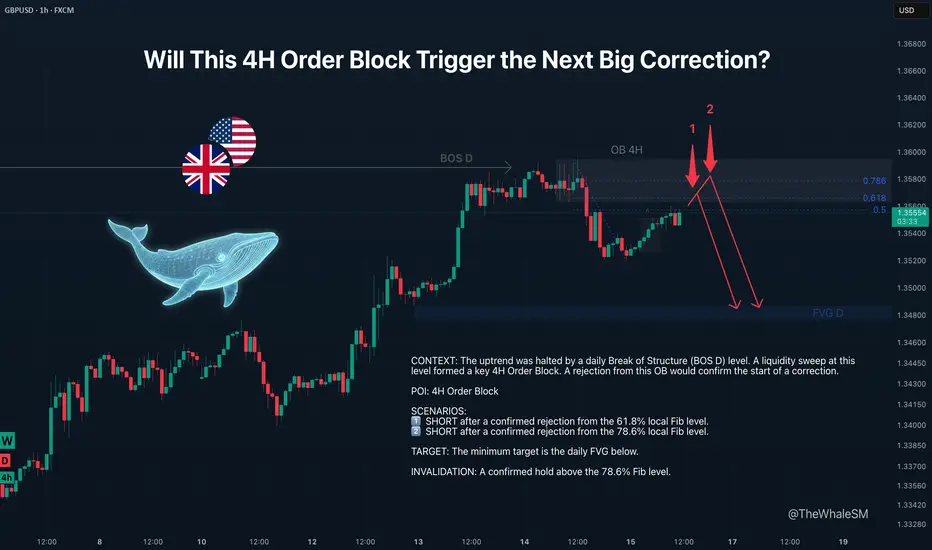
GBPUSD: The Rally Hits a Wall at the Daily Break of StructureEvery powerful trend eventually meets an obstacle it cannot immediately overcome. For the GBPUSD rally, that obstacle has appeared in the form of a major daily break of structure level. The upward momentum has stalled, and the price action is now signaling a potential correction. This analysis breaks down the high-probability short setup that has formed at this critical juncture.
The bullish move on the GBPUSD pair was halted by the daily Break of Structure (BOS D) level. The liquidity sweep from this level was carried out via a manipulation in the form of a 4H order block .
A mitigation of and reversal reaction from this order block would confirm the price's intention to correct, at a minimum, to the daily FVG below.
As an additional condition for opening a short position from this zone, I am considering the 61.8% or 78.6% local Fibonacci retracement levels .
► The first potential entry scenario involves the price reaching the 61.8% level and finding acceptance below it.
► If this level is broken, the second scenario will come into effect, which involves the price reaching the 78.6% level, also with a confirmed hold below it.
► Invalidation: The invalidation of the short scenario would be a break of the 78.6% level.
~~~~~~~~~~~~~~~~~~~~~~~~~~~~~~~~~~~~~~~~~~~~~~~~~~~~~~~~~~~~~~~~~
The principles and conditions for forming the manipulation zones I show in this trade idea are detailed in my educational publication, which was chosen by TradingView for the "Editor's Picks" category and received a huge amount of positive feedback from this insightful trading community. To better understand the logic I've used here and the general principles of price movement in most markets from the perspective of institutional capital, I highly recommend checking out this guide if you haven't already. 👇
P.S. This is not a prediction of the exact price direction. It is a description of high-probability setups that become valid only if specific conditions are met when the price reaches the marked POI. If the conditions are not met, the setups are invalid. No setup has a 100% success rate, so if you decide to use this trade idea, always apply a stop-loss and proper risk management. Trade smart.
~~~~~~~~~~~~~~~~~~~~~~~~~~~~~~~~~~~~~~~~~~~~~~~~~~~~~~~~~~~~~~~~~
If you found this analysis helpful, support it with a Boost! 🚀
Have a question or your own view on this idea? Share it in the comments. 💬
► Follow me on TradingView for timely updates on THIS idea (entry, targets & live trade management) and not to miss my next detailed breakdown.
~~~~~~~~~~~~~~~~~~~~~~~~~~~~~~~~~~~~~~~~~~~~~~~~~~~~~~~~~~~~~~~~~
GBPUSD SELL SETUPI EXPECT THE PRICE Will fall as we have bearish flag has been broken
and we have down trend and we have supply
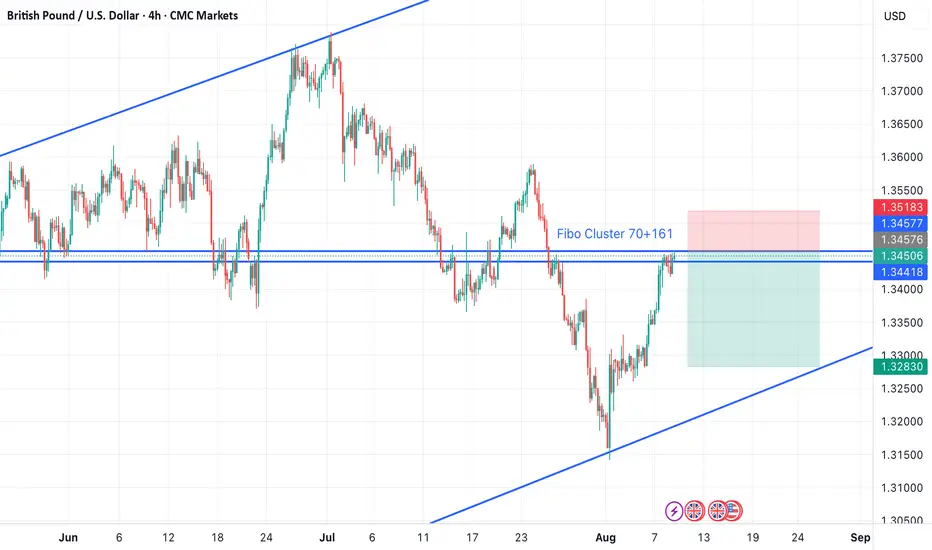
Fibo cluster on GBPUSD short position 70+161 fibo cluster short sell tit sl the close of 4h candle above the cluster zone
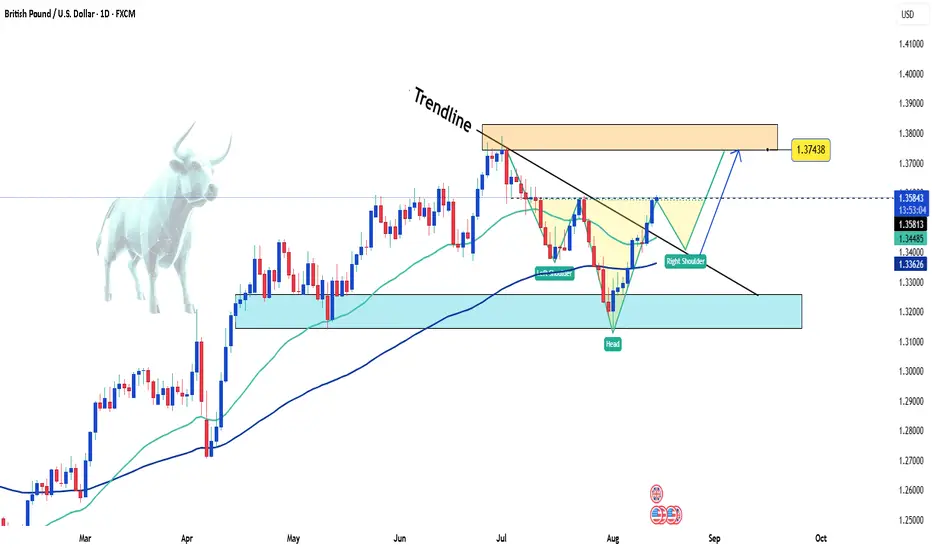
GBP/USD Extends Rally After Breaking Key TrendlineHello everyone, what are your thoughts on FX:GBPUSD ?
Today, the pair continues its winning streak, currently trading around 1.358. Broad selling pressure on the US Dollar (USD) has fueled GBP/USD’s bullish momentum. From a technical perspective, the pair has successfully broken above the descending trendline and closed higher, adding further strength to the bulls.
Price is now testing immediate resistance, and the formation of a head-and-shoulders pattern is showing strong potential. If this setup completes, the next target could be the resistance at the 1.374 high.
What about you — where do you think GBP/USD is heading next? Share your thoughts in the comments!
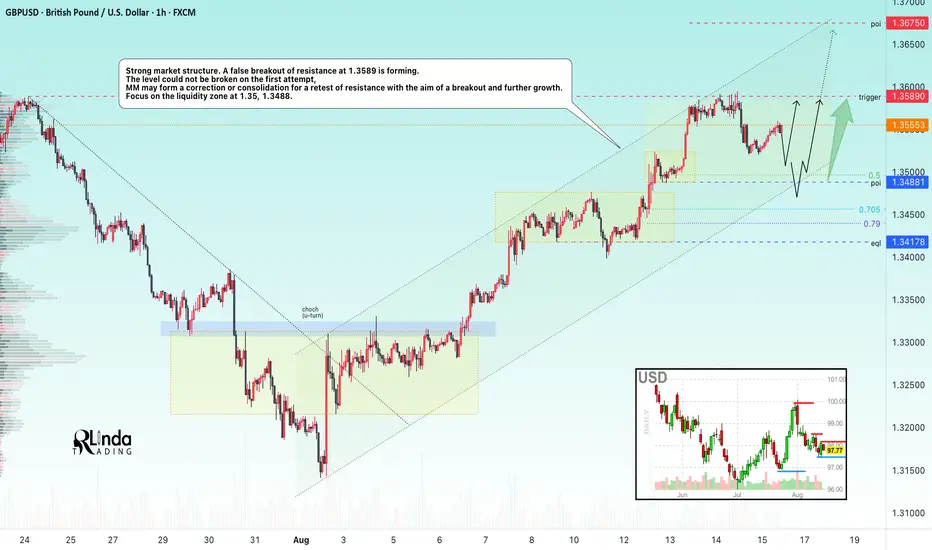
GBPUSD → Breakout of resistance after consolidationFX:GBPUSD is rebounding from strong daily resistance with the aim of consolidating its pre-breakout potential. The fundamental background for the pound is positive...
GBPUSD has a strong market structure. A false breakout of resistance at 1.3589 is forming. The level could not be broken on the first attempt, MM may form a correction or consolidation for a retest of resistance with the aim of a breakout and further growth. Focus on the liquidity zone at 1.35, 1.3488. The dollar is in a downward movement within the global bearish trend. Despite conflicting news, the index continues to decline, giving the pound a chance...
Resistance levels: 1.3589
Support levels: 1.3521, 1.3488
The market needs consolidation in order to break through this barrier. Against the backdrop of a bullish trend, which is already supporting the market, we can expect a rebound from support with the aim of continuing growth.
Best regards, R. Linda!
GBPUSD - trade breakdown, 3RR , 100 pips profit , target HIT This took me 3 hours of recording. It’s my first video, and the next ones will be better. Even though my ideas are clear in my head, I didn’t realize how different it is when you actually speak. I forgot to mention the other targets, but I’ll cover those in future videos.
Thanks for your understanding, and I hope you appreciate the effort I’m putting in.

A Simple Structure Trading Opportunity I like to keep my trading simply and it doesn't get any simpler than this.
IF price action can break & closes beyond the current level of structure resistance, THEN I would expect that price will travel higher... Yeah, that's pretty much it.
If you have any questions or comments, please leave them below.
Akil
