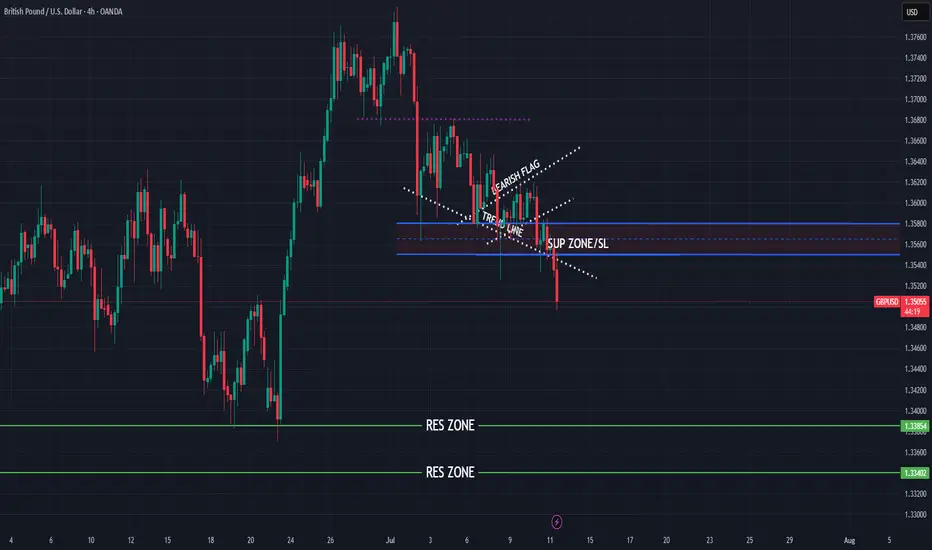
GBPUSD bearish continuation for expect
FX:GBPUSD strong bearish pushing, we can see BEARISH FLAG pat and trend line breaked, here still strong bearish to expect till TPs.
SUP zone: 1.35500
RES zone: 1.33850, 1.33400
GBPUSD trade ideas
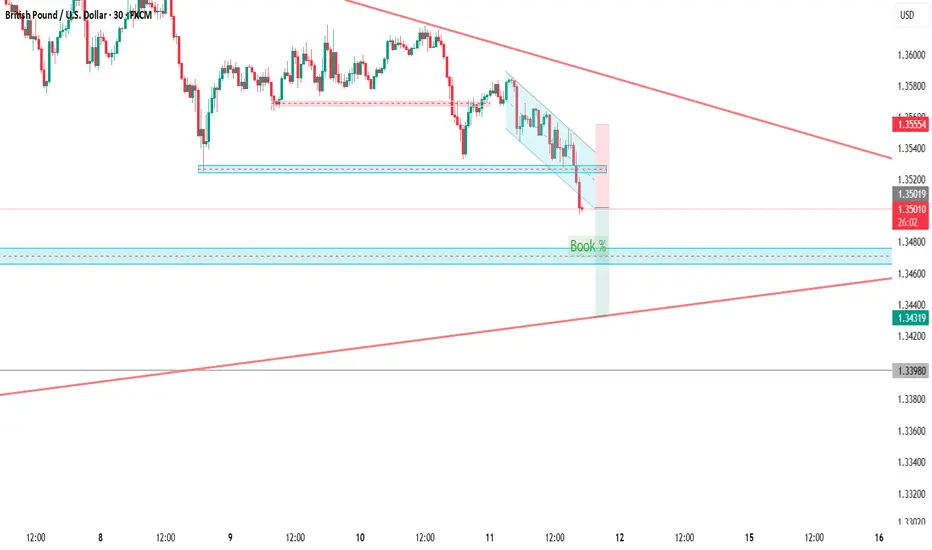
GBP USD SHORT RESULT Trend was still overall bearish and ongoing a minor pullback to continue downward movement also formed an ascending wedge pattern on the pullback which is also a strong indicator of bearish movement.
With all the conflunce above is why I took the short and it moved perfectly as predicted 🔥💪👌🎯
_THE_KLASSIC_TRADER_.🔥
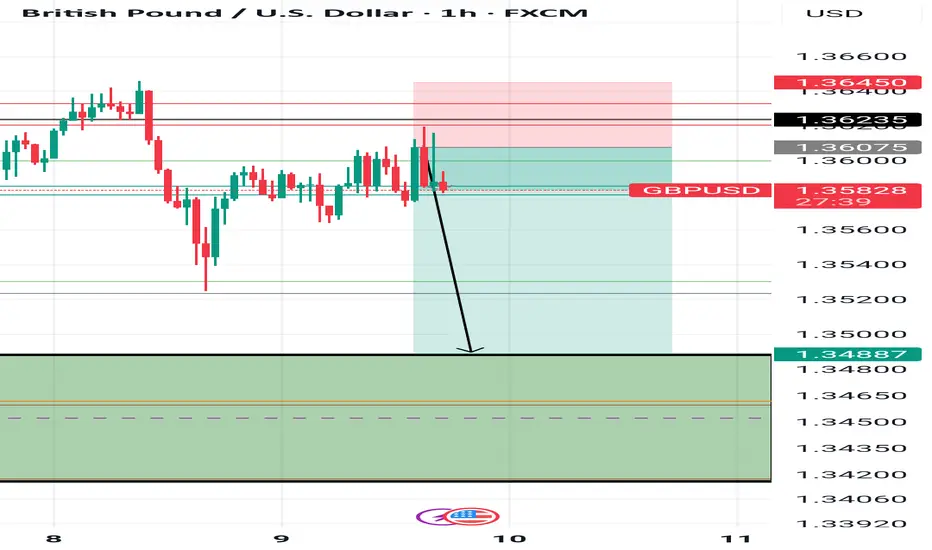
GBPUSD - 1H - 95% PredictionGBPUSD - 1H
Bumping to 5 minutes order block and then dumping to create new lower low.

GBP USD SHORT RESULT Price is in an overall bearish trend and also created a double top pattern at 4HTF Bearish Trendline and also holding minor resistance Trendline.
With all this Confluence was why I decided to open the Short position at the order block. Price just missing the set entry before rolling down to TP.
Better Set-ups to come 🔥💪
_THE_KLASSIC_TRADER_.

GBP/USD FUNDAMENTAL ANALYSISGBP/USD holds its winning streak for the fourth successive session, trading above 1.3700 in the European session on Thursday. The pair hangs close to three-year highs amid sustained US Dollar weakness, in light of US President Trump's fresh attack on the Fed's credibility. US data and BoE-speak awaited.

GBPUSD July Playbook: Bearish Setup at Channel High GBPUSD just printed a CC SELL signal right at the top of its rising channel — setting the stage for a potential July pullback.
📌 Breakdown using Vinnie’s Trading Cheat Code System:
✅ RSI Overbought zone triggered
✅ CC Sell + Confirm Sell combo at channel resistance (~1.38)
✅ Price stretched far above the mean with no higher timeframe support nearby
✅ MACD histogram rolling over — momentum shift in play
🎯 Targets:
1.3500 (channel median / recent base)
1.3280 (deeper support / previous Confirm Buy area)
This looks like a textbook trap-the-buyers setup. Patience on the entry — I’ll be stalking rallies to sell into.
🧠 Tools Used:
Vinnie’s Confirm Alerts
CC Trend Indicator
RSI OB/OS Scanner
MACD HPS Screener
Following this closely — could be one of the cleanest short opportunities of the month.


Buy on weekly As you look at the weekly , u see last week felt to break below the green support. So I expect it to go up
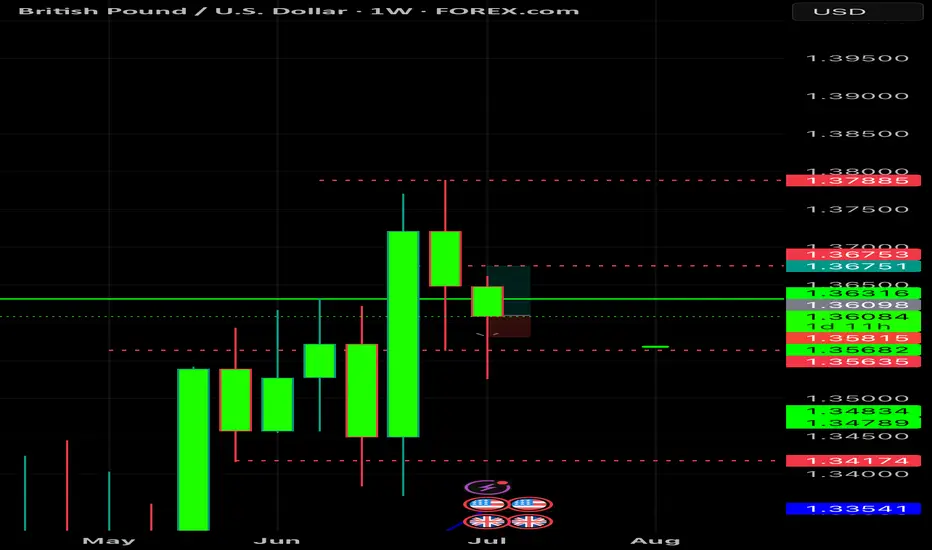
GBPUSD Bullish continuation pattern breakout?The GBPUSD remains in a bullish trend, with recent price action showing signs of a corrective pullback within the broader uptrend.
Support Zone: 1.3544 – a key level from previous consolidation. Price is currently testing or approaching this level.
A bullish rebound from 1.3544 would confirm ongoing upside momentum, with potential targets at:
1.3770 – initial resistance
1.3830 – psychological and structural level
1.3890 – extended resistance on the longer-term chart
Bearish Scenario:
A confirmed break and daily close below 1.3544 would weaken the bullish outlook and suggest deeper downside risk toward:
1.3500 – minor support
1.3440 – stronger support and potential demand zone
Outlook:
Bullish bias remains intact while the FTSE holds above 1.3544. A sustained break below this level could shift momentum to the downside in the short term.
This communication is for informational purposes only and should not be viewed as any form of recommendation as to a particular course of action or as investment advice. It is not intended as an offer or solicitation for the purchase or sale of any financial instrument or as an official confirmation of any transaction. Opinions, estimates and assumptions expressed herein are made as of the date of this communication and are subject to change without notice. This communication has been prepared based upon information, including market prices, data and other information, believed to be reliable; however, Trade Nation does not warrant its completeness or accuracy. All market prices and market data contained in or attached to this communication are indicative and subject to change without notice.

The Day AheadEconomic Data Overview:
United States – Initial Jobless Claims:
This weekly indicator will offer a timely snapshot of US labor market conditions. A rise could signal softening employment dynamics, potentially supporting a dovish bias from the Fed. Conversely, sustained low claims would reaffirm resilience in the jobs market, complicating rate-cut timing.
United Kingdom – June RICS House Price Balance:
This measure of sentiment among surveyors regarding house prices will provide insight into the UK housing market. A negative reading would suggest downward pressure from higher mortgage rates, while stability or improvement may reflect increased buyer demand amid easing inflation.
Japan – June Producer Price Index (PPI):
Key for tracking upstream price pressures. Slowing PPI growth would suggest disinflationary momentum, reducing the urgency for further BoJ tightening. Any upside surprise may reinforce speculation of policy normalization beyond the recent rate hike.
Italy – May Industrial Production:
A barometer of Eurozone manufacturing health. Weak output would highlight the region's ongoing industrial stagnation, potentially reinforcing the ECB’s dovish tilt. Resilience could challenge expectations of sustained easing.
Scandinavia – CPI & GDP Indicators:
Denmark & Norway June CPI:
Will test disinflation progress. Norway, in particular, could see market repricing of Norges Bank's stance if inflation proves stickier than expected.
Sweden May GDP Indicator:
Offers a snapshot of economic momentum. Weakness could justify the Riksbank’s cautious stance despite persistent inflation concerns.
Central Bank Speakers:
Federal Reserve – Musalem and Daly:
Markets will be looking for clarity on rate cut timing. If comments lean dovish, they could reinforce market pricing for a September cut. Any resistance to easing amid still-strong activity data would introduce volatility.
European Central Bank – Cipollone and Villeroy:
Focus will be on signaling around September policy. Villeroy, in particular, is seen as a policy bellwether—any firm commitment to a second rate cut could steepen the EUR yield curve and weigh on the euro. Hawkish caution, however, may reflect concerns about lingering service inflation.
Takeaway:
Thursday’s data and central bank commentary will refine expectations for H2 policy shifts. Jobless claims and CPI prints across Europe remain pivotal for gauging the pace of disinflation, while central bank rhetoric may hint at how aggressively easing cycles might proceed amid mixed economic signals.
This communication is for informational purposes only and should not be viewed as any form of recommendation as to a particular course of action or as investment advice. It is not intended as an offer or solicitation for the purchase or sale of any financial instrument or as an official confirmation of any transaction. Opinions, estimates and assumptions expressed herein are made as of the date of this communication and are subject to change without notice. This communication has been prepared based upon information, including market prices, data and other information, believed to be reliable; however, Trade Nation does not warrant its completeness or accuracy. All market prices and market data contained in or attached to this communication are indicative and subject to change without notice.
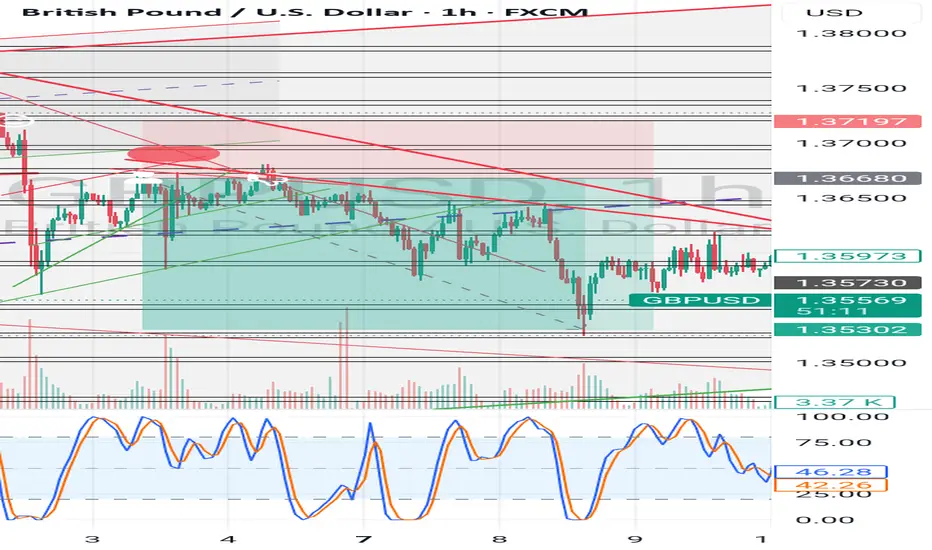
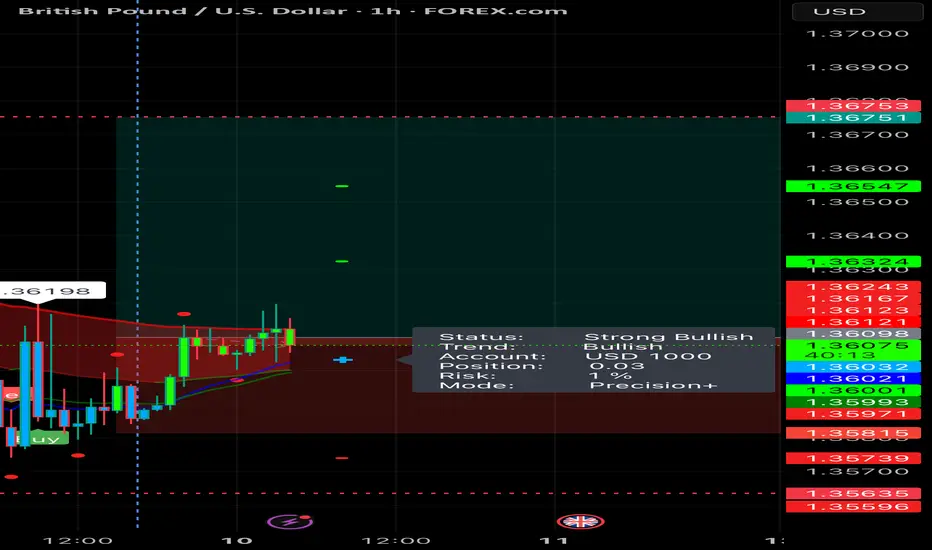
GBPUSD Is Going Up! Buy!
Take a look at our analysis for GBPUSD.
Time Frame: 1h
Current Trend: Bullish
Sentiment: Oversold (based on 7-period RSI)
Forecast: Bullish
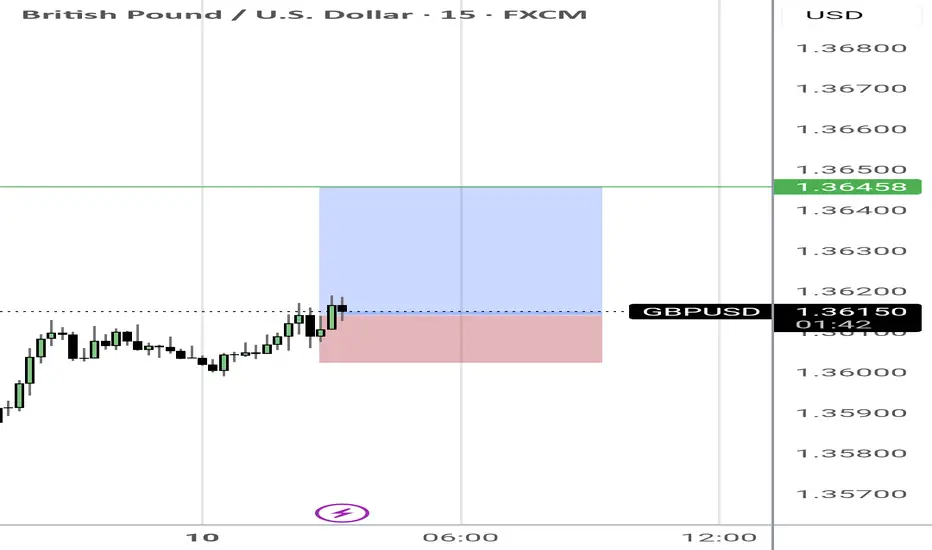
The market is on a crucial zone of demand 1.360.
The oversold market condition in a combination with key structure gives us a relatively strong bullish signal with goal 1.364 level.
P.S
The term oversold refers to a condition where an asset has traded lower in price and has the potential for a price bounce.
Overbought refers to market scenarios where the instrument is traded considerably higher than its fair value. Overvaluation is caused by market sentiments when there is positive news.
Disclosure: I am part of Trade Nation's Influencer program and receive a monthly fee for using their TradingView charts in my analysis.
Like and subscribe and comment my ideas if you enjoy them!
Gbpusd long scalp I like current consolidations near equal high depicted with green line.
I want to see a draw towards the equal highs.
This would be simulation trade #7 out of 100
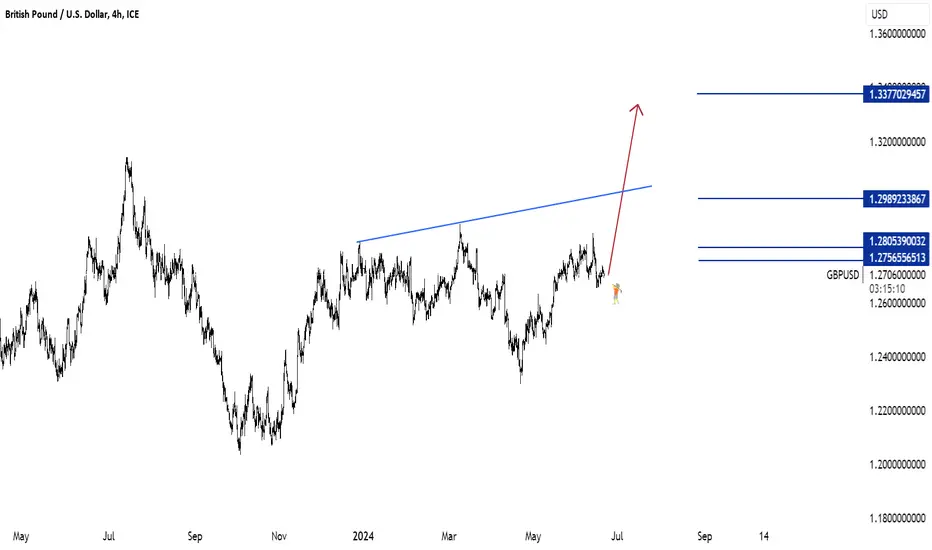
GBPUSDThe GBP/USD pair appears strongly bullish based on multiple technical indicators and fundamental considerations. Currently trading at 1.2700, the pair exhibits a robust uptrend, reinforced by the Relative Strength Index (RSI) holding above 45.00, indicating significant buying momentum.
Anticipation of the Bank of England's rate decision further fuels expectations of substantial market movement. Initial targets for the pair lie at 1.2735-1.2760, supported by key resistance levels and technical patterns suggesting further upside potential.
Looking ahead, extended projections suggest the pair could aim for 1.2800 in the near term, with potential extensions towards 1.2870-1.2900. These levels are identified through Fibonacci extensions and historical price action, aligning with current market sentiment and technical analysis.
Traders are advised to monitor any developments in central bank policy, economic data releases, and geopolitical events that could influence the pair's trajectory. Risk management strategies should be carefully implemented to navigate potential volatility associated with high-impact events.
Fundamental Market Analysis for July 10, 2025 GBPUSDEvent to watch today:
15:30 EET. USD - Initial Jobless Claims
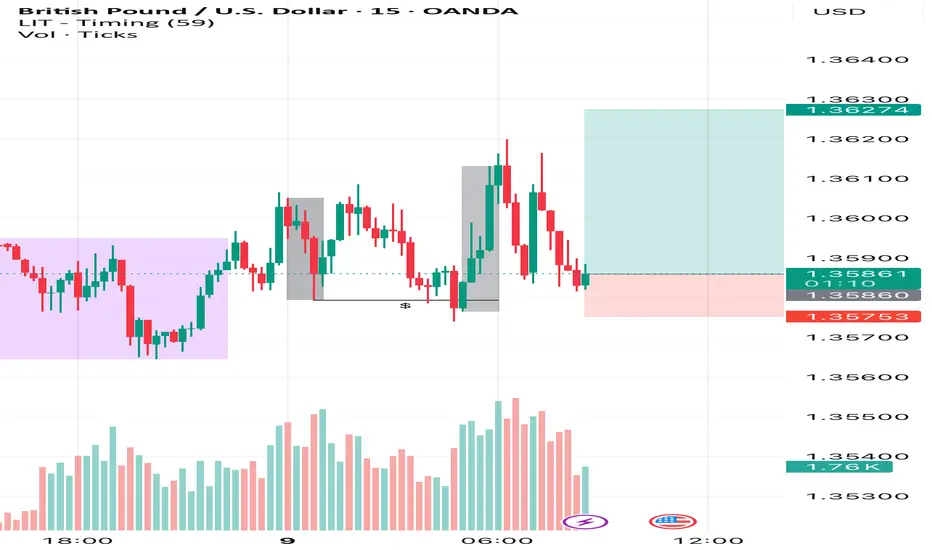
GBPUSD:
The British pound remains under pressure amid increased risk-off sentiment linked to new White House statements about additional tariffs from August 1. This is boosting demand for the US dollar as a safe haven and prompts investors to take profits on long GBP positions.
Domestic factors in the UK also have a negative impact: revisions to social spending programs and weak manufacturing PMI and retail sales data signal a slowdown in economic activity. The Bank of England is expected to keep the rate at 5.50% until year-end, which limits the pound’s attractiveness for investors.
The current GBP/USD rate is 1.35900. In the absence of positive drivers from the UK economy and persistent demand for the dollar, the pair remains vulnerable to further declines toward 1.3520.
Trade recommendation: SELL 1.36000, SL 1.36300, TP 1.35200

BUYMy analysis tells me that the market is going up. Hit me up on the comments section I want to hear from you.
GBPUSD BuyPrice took liquidity and created a new high. Internal structure has been sweeped(liquidity). Price should continue daily cycle.
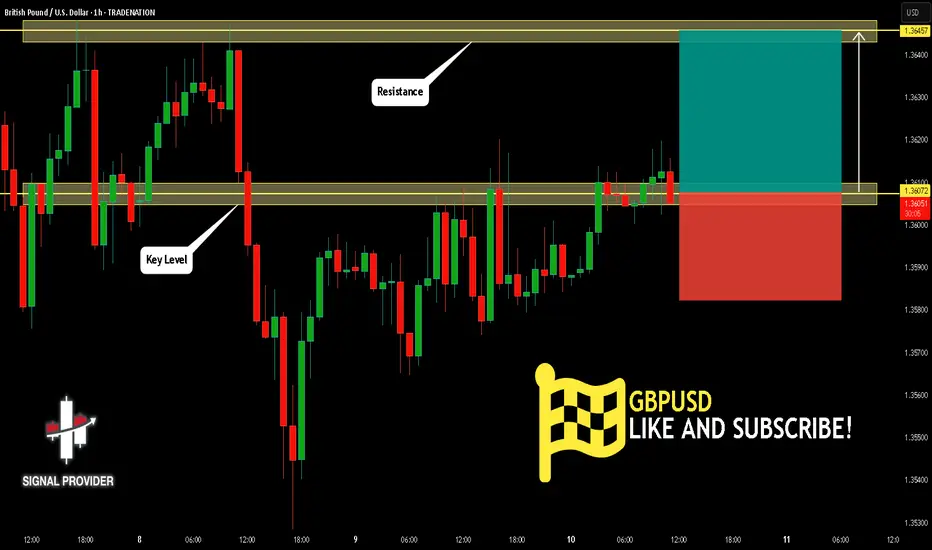
SELL GBPUSD🚨 Trade Alert 🚨
📉 SELL GBPUSD NOW!
🔻 Market hitting key resistance level – expect bearish momentum.
🎯 Target: | 🛑 Stop Loss:
💹 Risk management is key – stay sharp!
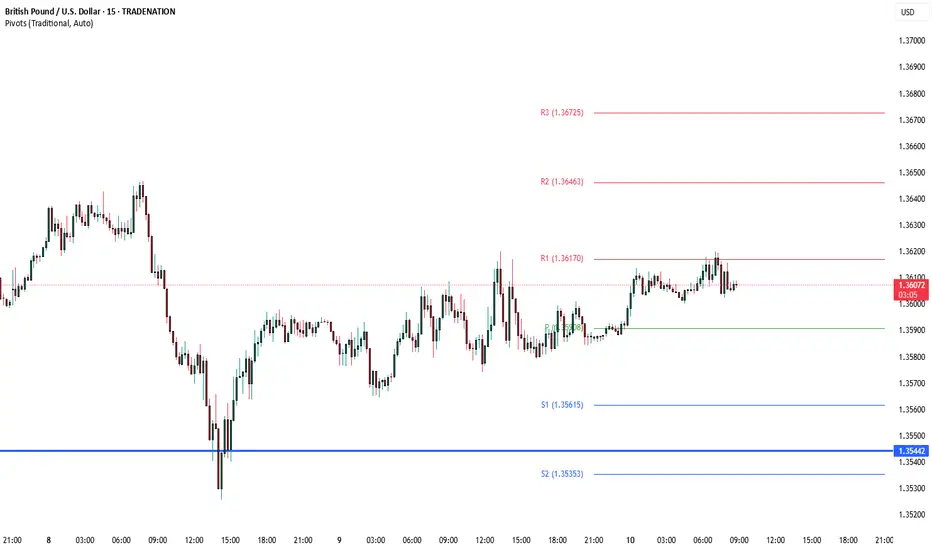
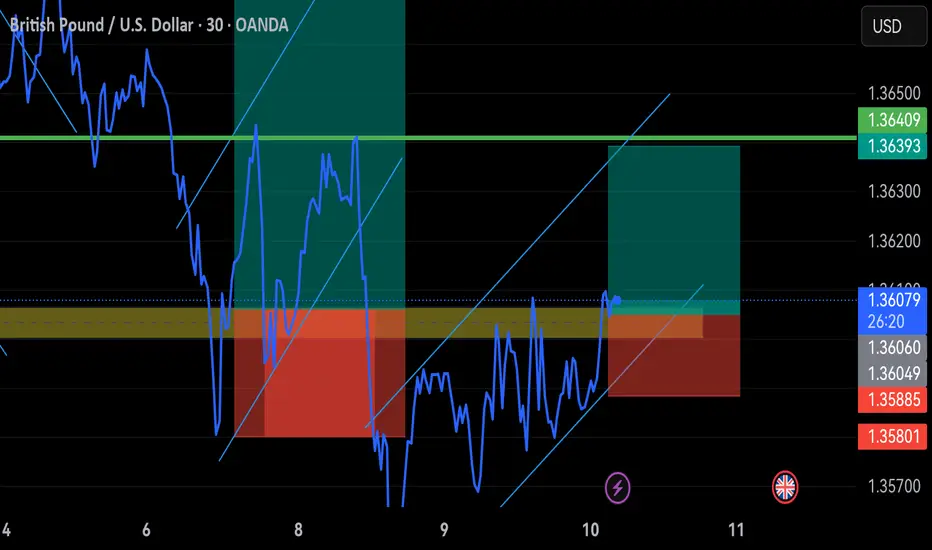
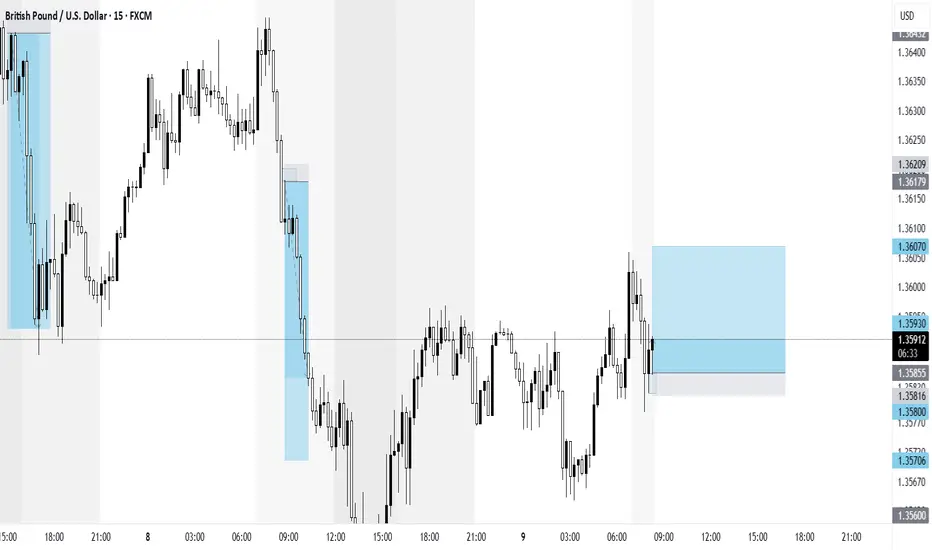
GBP/USD Rebounds Inside Channel – Long Opportunity in MotionHi traders! Analyzing GBP/USD on the 30-minute timeframe, price is currently respecting a descending channel, showing signs of a bullish bounce after retesting lower support.
🔹 Entry: 1.3586
🔹 Take Profit (TP): 1.3618
🔹 Stop Loss (SL): 1.3555
Price is attempting to recover after holding at the bottom of the channel, and is now pushing toward the 20 EMA. If momentum builds, a retest of the upper trendline and the 1.3618 zone is likely. RSI is slightly recovering from neutral levels, adding confluence to this rebound setup.
This long trade offers a solid risk-to-reward ratio within a possible short-term counter-trend move. Watch closely as price approaches dynamic resistance.
⚠️ DISCLAIMER: This is not financial advice. Every trader is responsible for their own decisions and risk management.

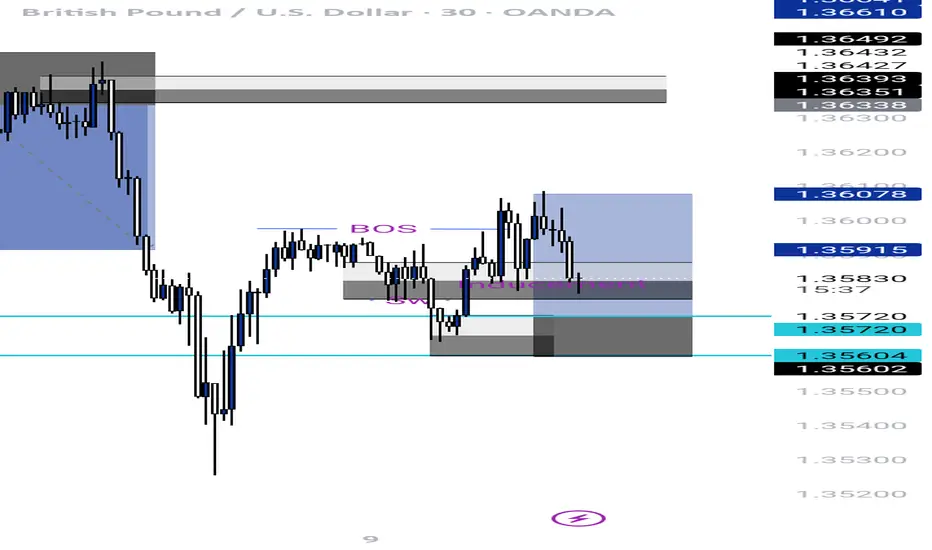
GBPUSD buy setup From my strategy system, the point I mark as my entry,is an order block poi,
From the sence that , price has swept liquidity, and bos and an inducement, so I look to enter from the order block, because the liquidity and the inducement has been mitigated so price next target is to sweep the order block then reverse. Let's go, risk management involved please, just my opinion I am sharing
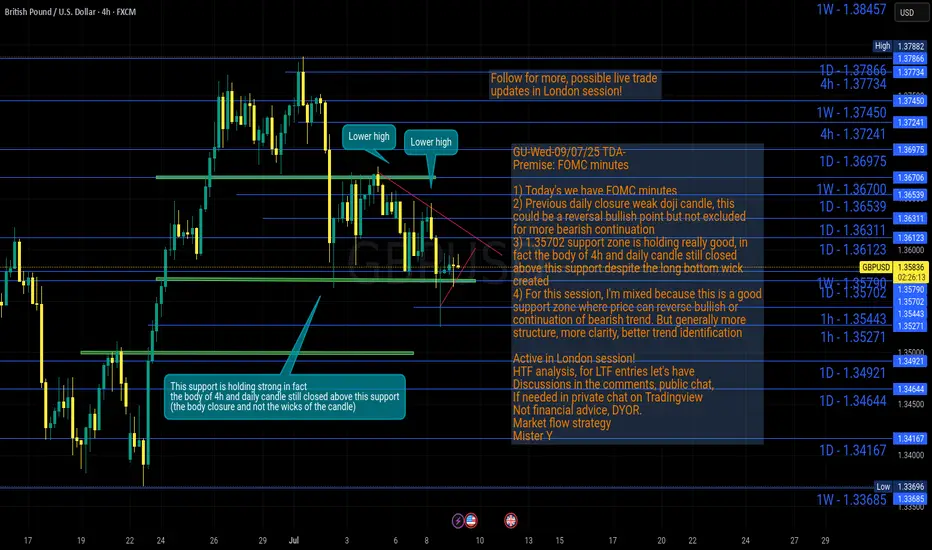
GU-Wed-09/07/25 TDA-Daily support (DS) 1.35702 is holding strongAnalysis done directly on the chart
Follow for more, possible live trades update!
I often share my live trades in Tradingview public chat in London session, stay tuned!
One of the basic concept of trading: Parts of candlestick
-The body
-The bottom wick
-The upper wick
Generally speaking, waiting for body closure above or below
certain levels gives higher probability of a certain move to
continue.
But it depends also on the timeframe you are considering:
-The 5m-15m body closure optimal for lower timeframe
-The 1h-4h body closure optimal for higher timeframe
-Etc...
These are all general considerations, in fact as a trader you
should evaluate each case based on market conditions and more.
Premise:
A simple idea plan (like Tradingview public posts) won't describe everything.
No one can predict how market will move, it's always good to react to how it moves.
It gives an idea of how price might move, but no one come from FUTURE.
So I always encourage people to openly and actively discuss in real time.
For example discussing on Tradingview public chat (and more).
I don't give signals blindly, people should learn
and understand the skill.
Following blindly signals you won't know how to
manage the trade, where precisely put sl and tp,
lot size and replicate the move over time.
That's why you need active real time discussions.
Trading is not get rich quick scheme!
Active in London session!
Not financial advice, DYOR.
Market Flow Strategy
Mister Y