GBPUSD trade ideas
GBPUSD buyer in controlDaily candle closed with strong bullish.
Expecting a healthy retracement before another bullish movement
Good Luck
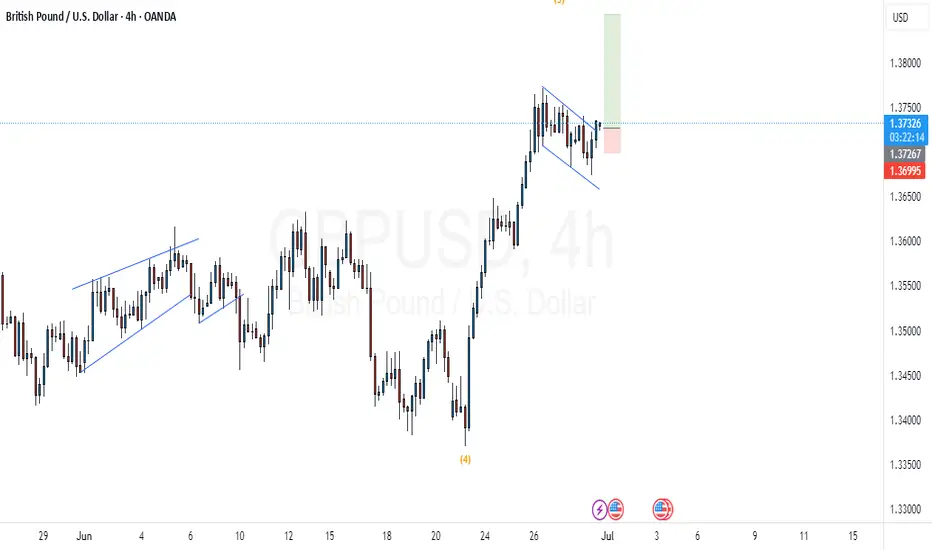
Bullish IdeaMarket forming what seems to be a bullish flag pattern, which results into an upward move. So we expect a good bullish pattern. Break out the structure and we
ready for the show now
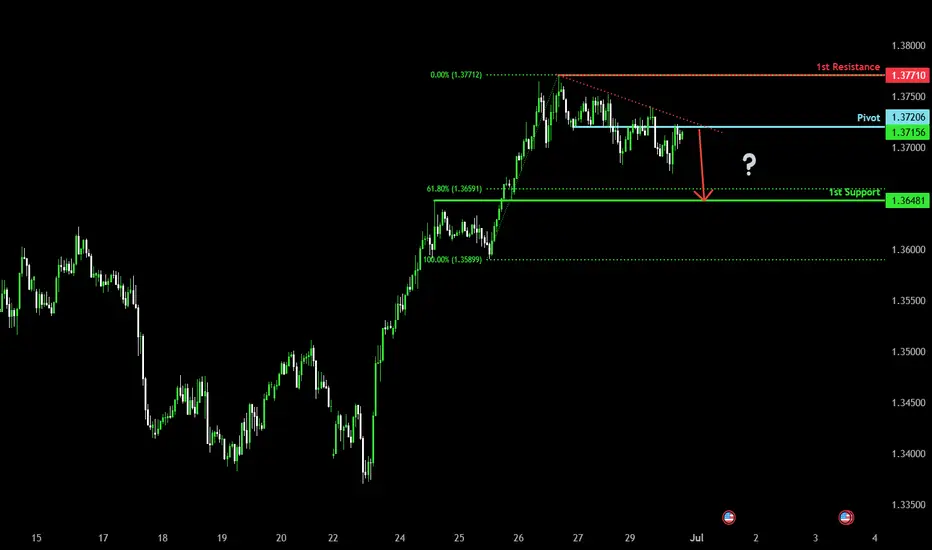
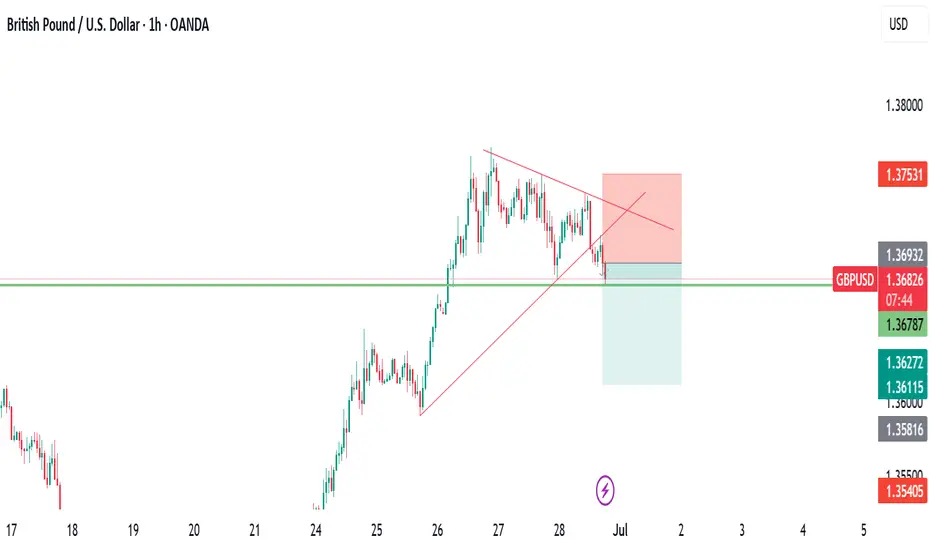
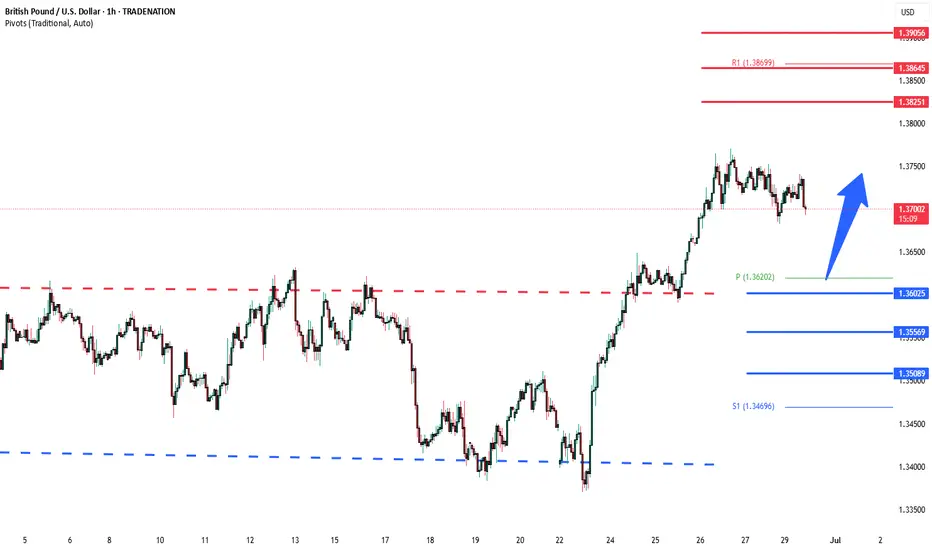
Bearish drop?The Cable (GBP/USD) is reacting off the pivot and could drop to the 1st support.
Pivot: 1.3720
1st Support: 1.3648
1st Resistance: 1.3771
Risk Warning:
Trading Forex and CFDs carries a high level of risk to your capital and you should only trade with money you can afford to lose. Trading Forex and CFDs may not be suitable for all investors, so please ensure that you fully understand the risks involved and seek independent advice if necessary.
Disclaimer:
The above opinions given constitute general market commentary, and do not constitute the opinion or advice of IC Markets or any form of personal or investment advice.
Any opinions, news, research, analyses, prices, other information, or links to third-party sites contained on this website are provided on an "as-is" basis, are intended only to be informative, is not an advice nor a recommendation, nor research, or a record of our trading prices, or an offer of, or solicitation for a transaction in any financial instrument and thus should not be treated as such. The information provided does not involve any specific investment objectives, financial situation and needs of any specific person who may receive it. Please be aware, that past performance is not a reliable indicator of future performance and/or results. Past Performance or Forward-looking scenarios based upon the reasonable beliefs of the third-party provider are not a guarantee of future performance. Actual results may differ materially from those anticipated in forward-looking or past performance statements. IC Markets makes no representation or warranty and assumes no liability as to the accuracy or completeness of the information provided, nor any loss arising from any investment based on a recommendation, forecast or any information supplied by any third-party.
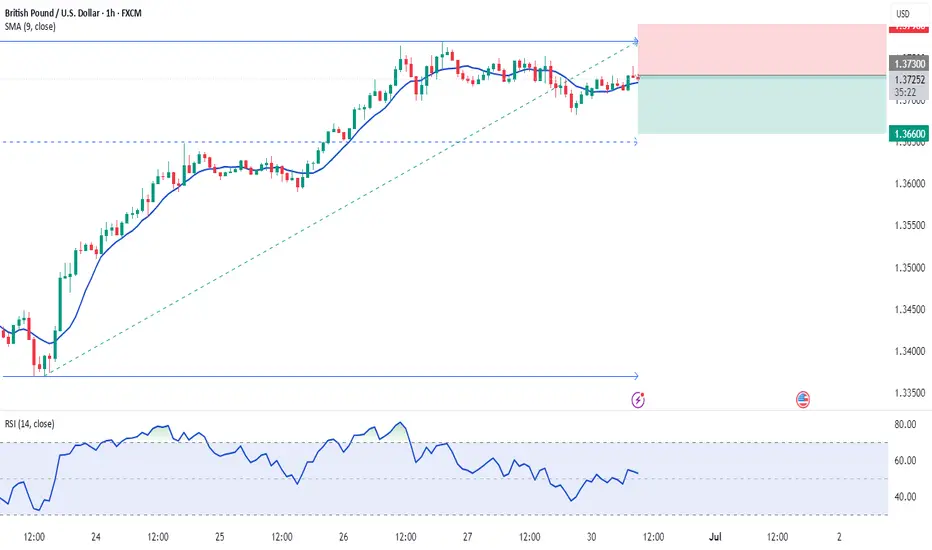
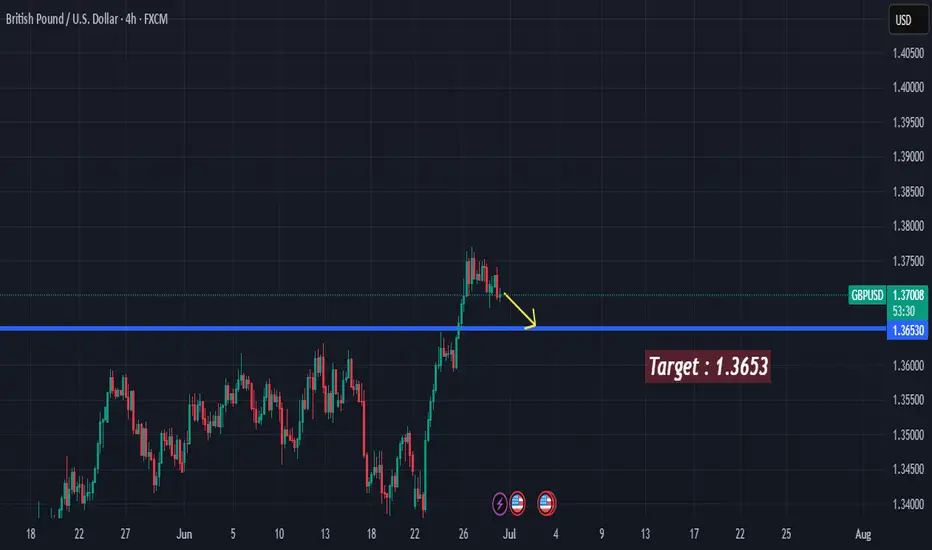
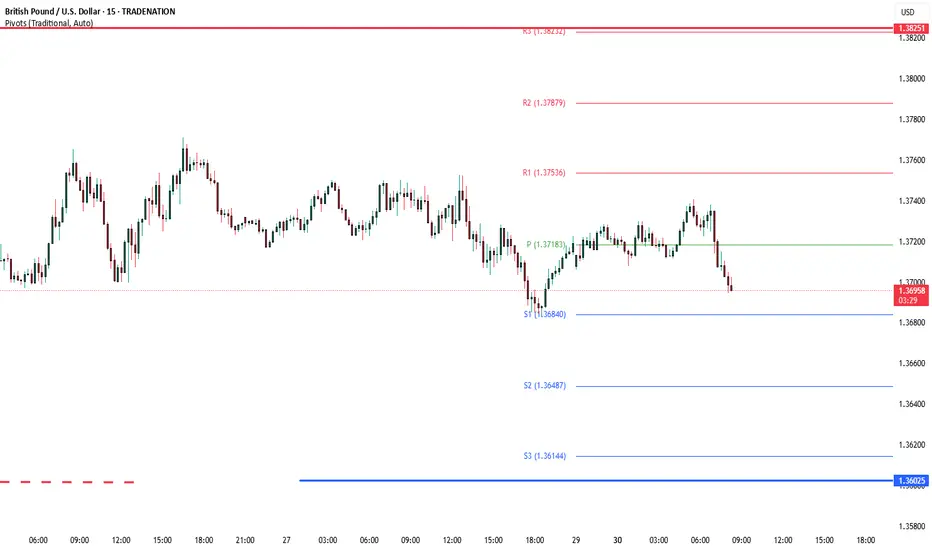
30.06.2025 #GBPUSDSELL 1.37300 | STOP 1.37900 | TAKE 1.36600 | Downward local corrective price movement.
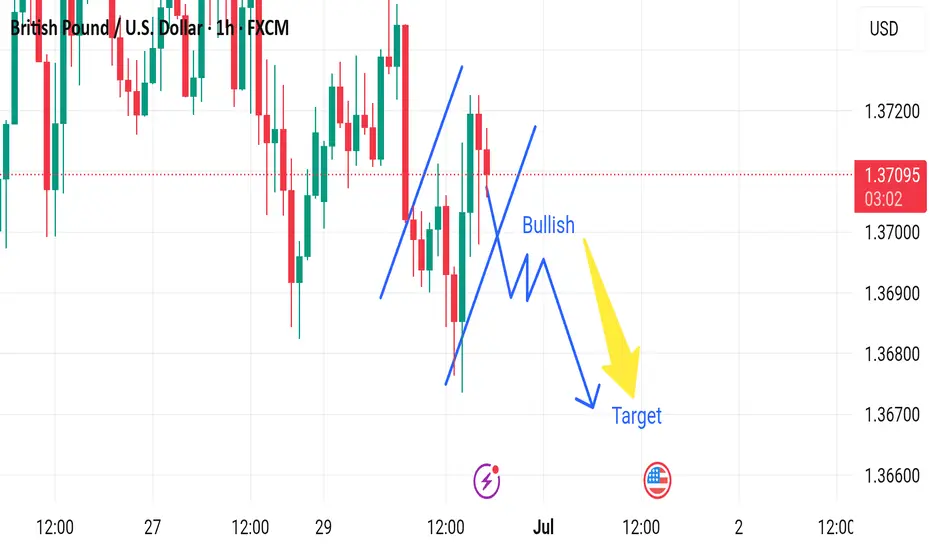
Market next target 🔀 Disruption Analysis – Bullish Alternative Scenario
While the current chart outlines a bearish scenario after a short-term bullish correction, leading to a drop toward the target near 1.36600, here’s how a bullish disruption could unfold instead:
---
🟢 Bullish Disruption Possibility:
1. False Breakdown / Bear Trap:
The market may dip slightly below recent lows to trigger sell stops and liquidity grab, then reverse upward.
If price finds strong buying interest around 1.3690–1.3700, it could spark a bullish reversal.
2. Strong Rejection Candles:
Watch for bullish engulfing or pin bar formations on lower timeframes (15m or 30m) near the dip area.
These would signal loss of bearish momentum.
3. Break of Lower High Structure:
A break above 1.3720 would shift short-term market structure to bullish.
It could lead to a move toward 1.3750–1.3780.
4. Macro Fundamentals:
Hawkish BOE comments or weak U.S. data could reverse USD strength, lifting GBP/USD.
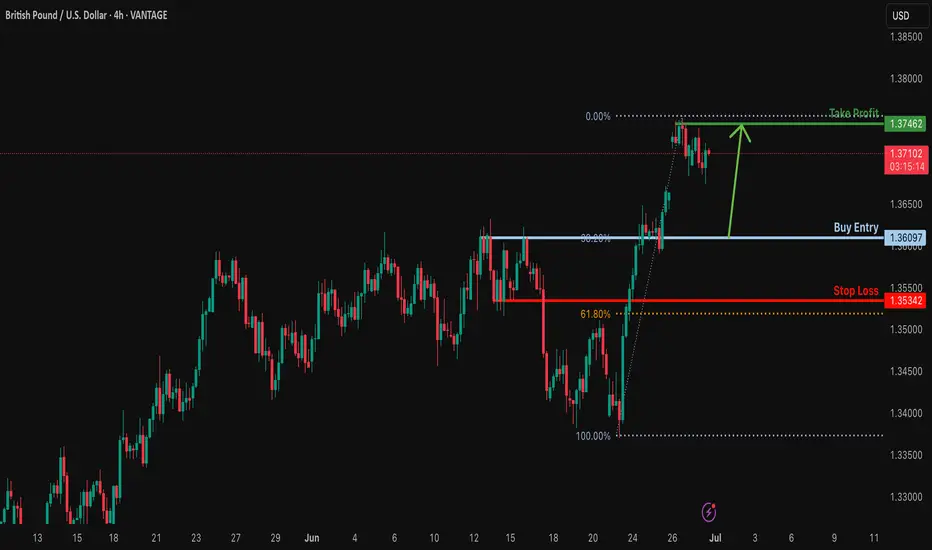
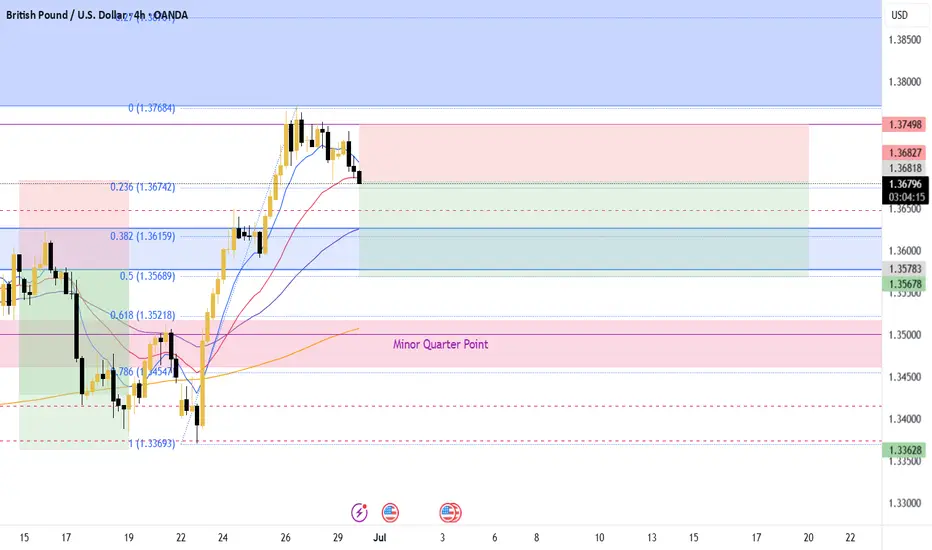
Falling towards pullback support?GBP?USD is falling towards the support level which is a pullback support that lines up with the 38.2% Fibonacci retracement and could drop from this level to our take profit.
Entry: 1.3609
Why we like it:
There is a pullback support level that lines up with the 38.2% Fibonacci retracement.
Stop loss: 1.3534
Why we like it:
There is a pullback support.
Take profit: 1.3746
Why we like it:
There is a pullback resistance.
Enjoying your TradingView experience? Review us!
Please be advised that the information presented on TradingView is provided to Vantage (‘Vantage Global Limited’, ‘we’) by a third-party provider (‘Everest Fortune Group’). Please be reminded that you are solely responsible for the trading decisions on your account. There is a very high degree of risk involved in trading. Any information and/or content is intended entirely for research, educational and informational purposes only and does not constitute investment or consultation advice or investment strategy. The information is not tailored to the investment needs of any specific person and therefore does not involve a consideration of any of the investment objectives, financial situation or needs of any viewer that may receive it. Kindly also note that past performance is not a reliable indicator of future results. Actual results may differ materially from those anticipated in forward-looking or past performance statements. We assume no liability as to the accuracy or completeness of any of the information and/or content provided herein and the Company cannot be held responsible for any omission, mistake nor for any loss or damage including without limitation to any loss of profit which may arise from reliance on any information supplied by Everest Fortune Group.
GBPUSD is in Bearish Trend !GBPUSD in Bearish Trend Because in 1 hour Chart Pattarn Double Top Found there and in RSI Bearish Divergence also there so the Meaning is Market IS Down

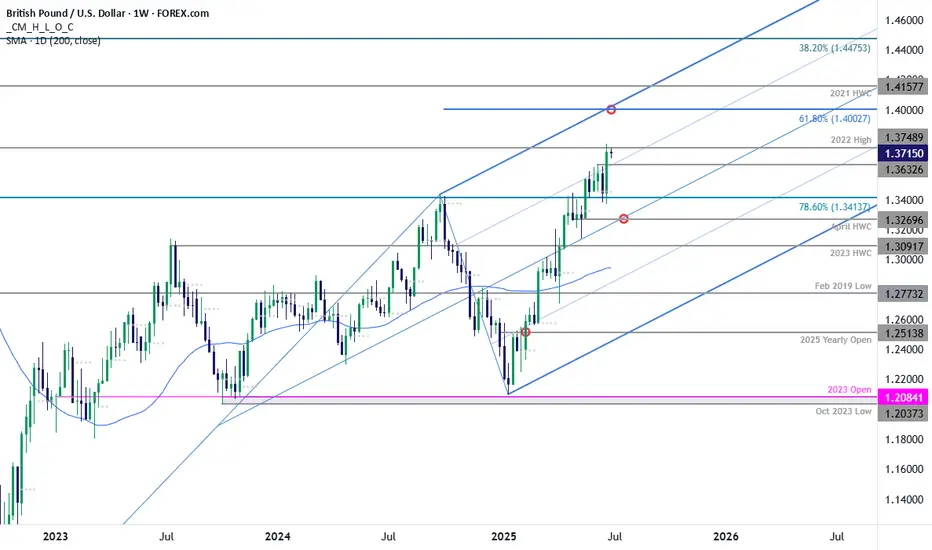
GBP/USD Testing Resistance at 2022 HighsSterling marked an outside weekly-reversal through slope resistance last week with the rally trading just below resistance into the close of the month at the 2022 swing high at 1.3749. Look for support at the June high at 1.3633 IF price is heading higher on this stretch with a breach / close higher exposing the 61.8% extension of the 2022 advance at 1.4003. Weekly support rests with the 78.6% retracement at 1.3414 with media-term bullish invalidation now raised to the April high-week close (HWC) at 1.3270.
-MB
GBPUSD My analysis on GBPUSD not a financial advice do your due diligence. Thank you
Feel free to hop on this
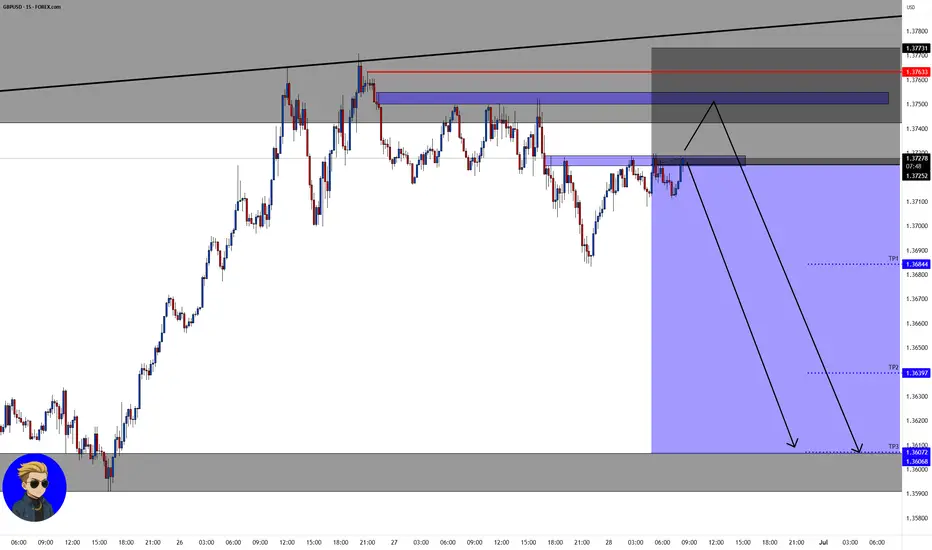
GBP/USD💰Symbol: { GBP/USD }
🟩Price: { 1.37252 & 1.37500 }
🟥Stop: { 1.37731 }
1️⃣profit: { 1.36844 }
2️⃣profit: { 1.36397 }
3️⃣profit: { 1.36072 }
📊Check your chart before entering.
🚨Check before use to make sure there is no important news.🚨
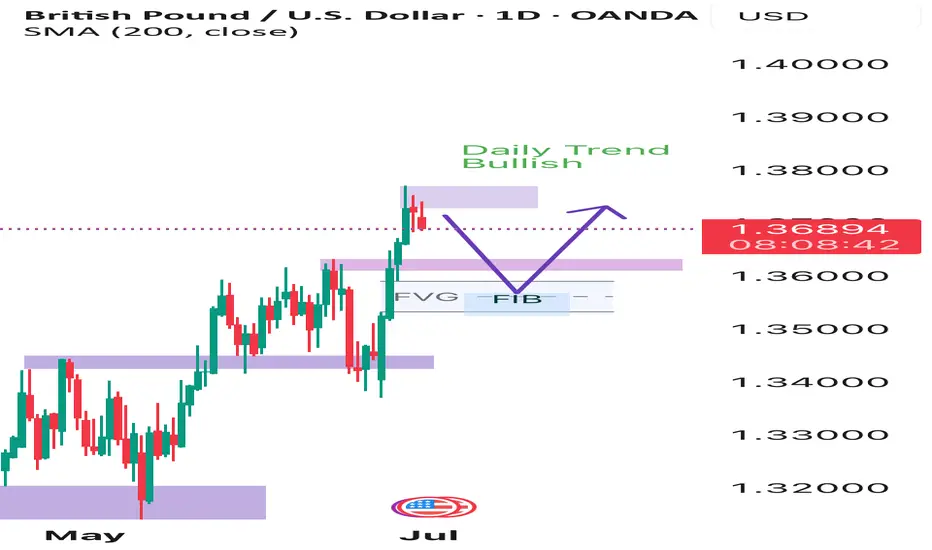
Trading Recommendation and Analysis for GBP/USDThe British pound is rising, but the accompanying Marlin oscillator is quite weak. Before the bulls are not just the desired targets - 1.3834, 1.3935, etc. - but also potential traps from which the bears could launch an unstoppable offensive.
On the daily chart, the trend remains upward, which is also confirmed by the Marlin oscillator breaking upward out of its own descending channel. However, there is also suspicion that this might be a trap - it may be a false breakout from the channel, similar to what occurred on May 12, when it was a breakout to the downside (highlighted by a yellow rectangle) .A trend reversal would occur if the price breaks below the support level at 1.3635, which is additionally reinforced by the MACD line.
On the four-hour chart, the price appears to be finishing a consolidation phase. During this consolidation, the Marlin oscillator has had time to decompress and prepare for further growth. As long as the trend remains intact the no signs of reversal appear, we expect the price to continue moving gradually upward.
GBPUSD PullbackGBPUSD is in an overall bullish market
However, after a large bullish push, I am expecting price to pullback (sell off).
Price met resistance a weekly supply zone and closed as an indecision candle on the Daily.
The lower blue EMA crossed below the higher RED EMA on the 1hr chart.
Expecting price to selloff and find support at the 50.0 Fib level which also correlates with a demand zone, before continuing the overall trend.
GBPUSD bullishExpecting GU to continue bullish after clear rejection from the 1H support. We wait for a bullish confirmation candle before entry.
GBP/USDPrice action trading is a methodology in financial markets where traders make decisions based on the actual price movements of an asset over time, rather than relying heavily on technical indicators or fundamental analysis. It involves observing and interpreting patterns and trends in price charts to predict future price movements.
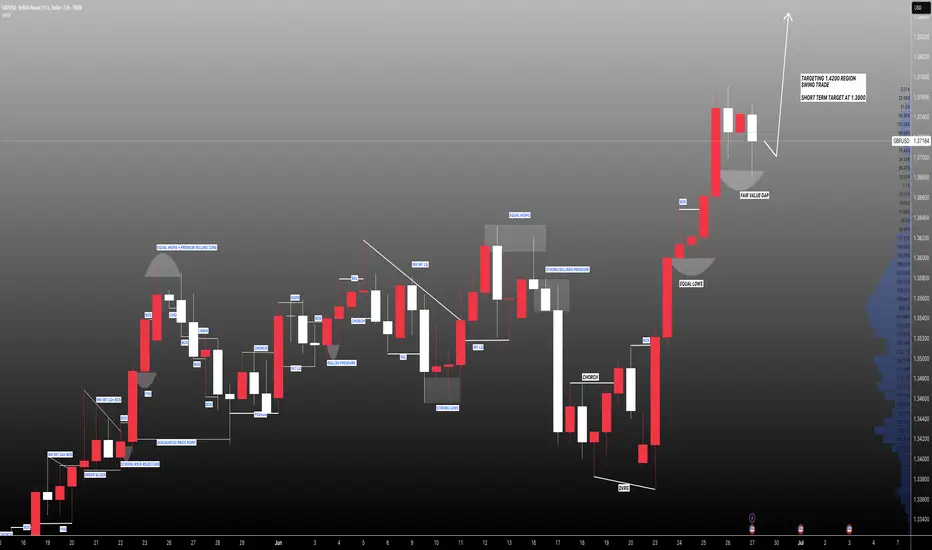
GBPUSD: Targeting 1.4200 Swing Move Target! Swing Trading GBPUSD: We’ve identified a key reversal zone where our long-term take-profit target is set at 1.4200. This is a long-term approach, but in the short term, we could target 1.3900, which is a reasonable take-profit area. Before taking any buying entry, please do your own analysis.
Good luck and trade safely!
Like
Comment
Share
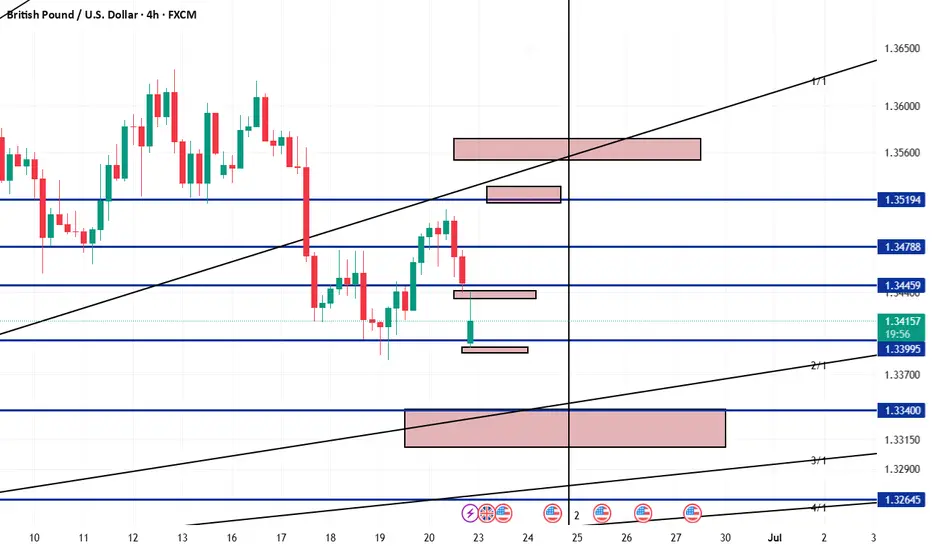
Team Setupsfx_
GBPUSD AnalaysisGBPUSD Analaysis on 4H frame According to my own analysis strategy
Selling Zones :
1.35150 - 1.35300
1.35530 - 1.35720
buying zones
1.33427 - 1.33080
GBP/USD What do people’s think about my chart 😅 waiting for hourly to match daily trend before placing a trade
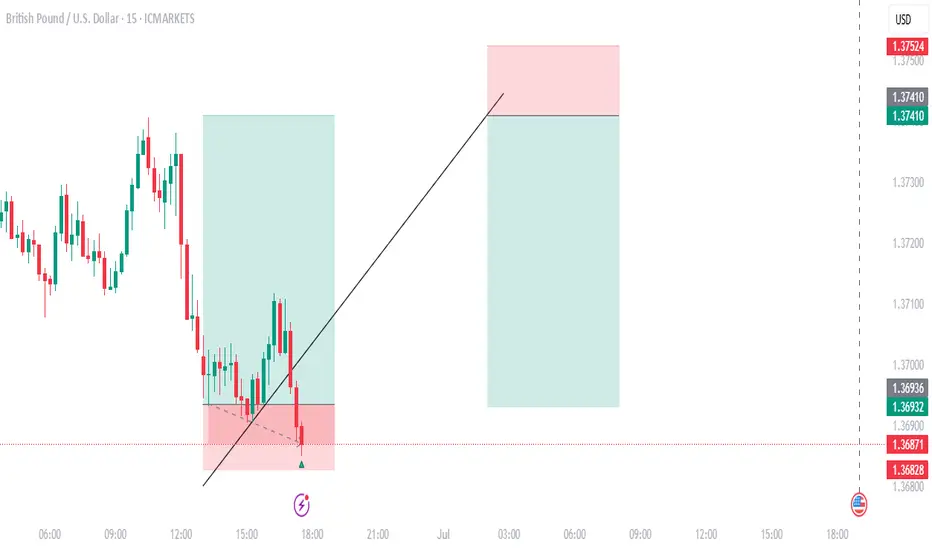
Smart Scalping on GBP/USD: 15-Minute Chart StrategyUnlock the power of precision trading with my exclusive GBP/USD 15-minute scalping strategy. This isn’t just another chart setup—it’s a battle-tested system built on real-time confluence: EMA crossovers, RSI confirmation, Supertrend alignment, and Fibonacci retracement zones. Every trade idea I share is backed by deep analysis, strict risk management, and a clear entry/exit plan.
Whether you're a beginner looking to learn or a trader seeking consistency, my strategy delivers clarity in the chaos of the markets. Join me to gain access to high-probability setups, live breakdowns, and mentorship that turns theory into profit.
💼 Ready to level up your trading? 💸 Invest in insights that pay for themselves. 📈 Let’s grow together—one smart trade at a time.
GBPUSD sideways consolidation support at 1.3550The GBPUSD currency pair continues to exhibit a bullish price action bias, supported by a sustained rising trend. Recent intraday movement reflects a sideways consolidation breakout, suggesting potential continuation of the broader uptrend.
Key Technical Level: 1.3600
This level marks the prior consolidation range and now acts as pivotal support. A corrective pullback toward 1.3600 followed by a bullish rejection would reinforce the bullish trend, targeting the next resistance levels at:
1.3825 – Near-term resistance
1.3865 – Minor swing high
1.3900 – Longer-term bullish objective
On the other hand, a decisive daily close below 1.3600 would invalidate the bullish setup, shifting the outlook to bearish in the short term. This could trigger a deeper retracement toward:
1.3550 – Initial support
1.3500 – Key downside target
Conclusion:
As long as 1.3600 holds as support, the technical outlook remains bullish, favoring long positions on dips. A confirmed break below this level would signal a shift in sentiment and open the door to a corrective pullback phase.
This communication is for informational purposes only and should not be viewed as any form of recommendation as to a particular course of action or as investment advice. It is not intended as an offer or solicitation for the purchase or sale of any financial instrument or as an official confirmation of any transaction. Opinions, estimates and assumptions expressed herein are made as of the date of this communication and are subject to change without notice. This communication has been prepared based upon information, including market prices, data and other information, believed to be reliable; however, Trade Nation does not warrant its completeness or accuracy. All market prices and market data contained in or attached to this communication are indicative and subject to change without notice.
The Day Ahead A packed data slate and central bank commentary will shape market sentiment today. Key focus will be on China’s official PMIs for June, offering the first major insight into the health of the global manufacturing cycle as Q3 begins. A soft print could amplify global growth concerns, while a surprise to the upside may support risk sentiment across Asia and commodities.
In the US, attention will turn to the June MNI Chicago PMI and the Dallas Fed manufacturing activity index for further clarity on the state of US industry after mixed regional data earlier this month. The consumer credit and M4 money supply data, along with Q1 current account figures, could influence the USD via their implications for domestic demand and external balances.
The UK sees the release of the Lloyds Business Barometer, which will provide a gauge of corporate confidence amid sticky inflation and persistent BoE rate cut speculation.
In the Eurozone, eyes will be on Germany’s June CPI flash estimate, retail sales, and import prices, all feeding into inflation expectations ahead of the ECB’s July policy meeting. Italy’s CPI and Eurozone May M3 will also be watched closely for signs of disinflation and liquidity trends.
From Japan, May industrial production and housing starts will help assess whether the domestic economy is managing to maintain momentum amid a weak yen and global headwinds.
On the central bank front, the ECB Forum in Sintra kicks off, running through July 2. President Christine Lagarde is due to speak, and any remarks on the rate path or inflation outlook will be closely parsed. Markets will also hear from Fed’s Bostic and Goolsbee, potentially offering clues on the FOMC’s stance amid rising speculation around a September cut.
This communication is for informational purposes only and should not be viewed as any form of recommendation as to a particular course of action or as investment advice. It is not intended as an offer or solicitation for the purchase or sale of any financial instrument or as an official confirmation of any transaction. Opinions, estimates and assumptions expressed herein are made as of the date of this communication and are subject to change without notice. This communication has been prepared based upon information, including market prices, data and other information, believed to be reliable; however, Trade Nation does not warrant its completeness or accuracy. All market prices and market data contained in or attached to this communication are indicative and subject to change without notice.
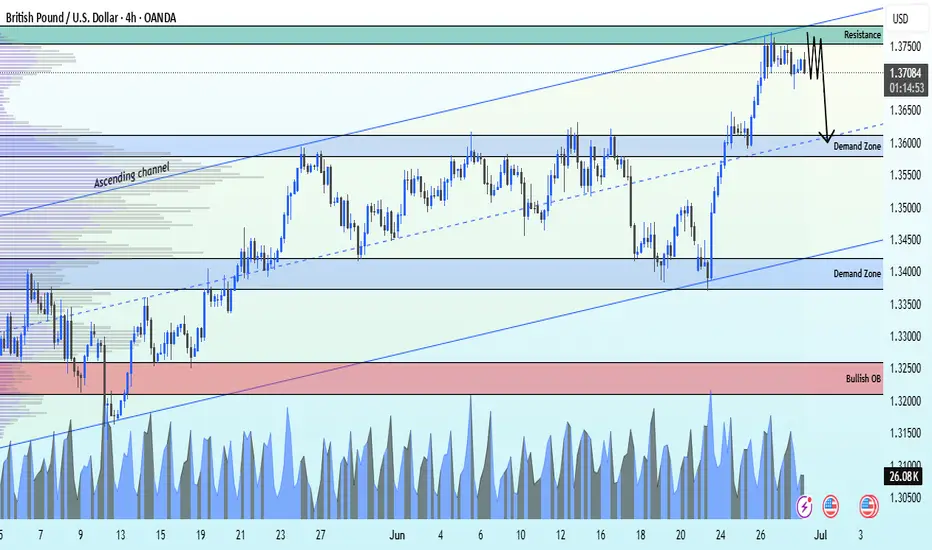
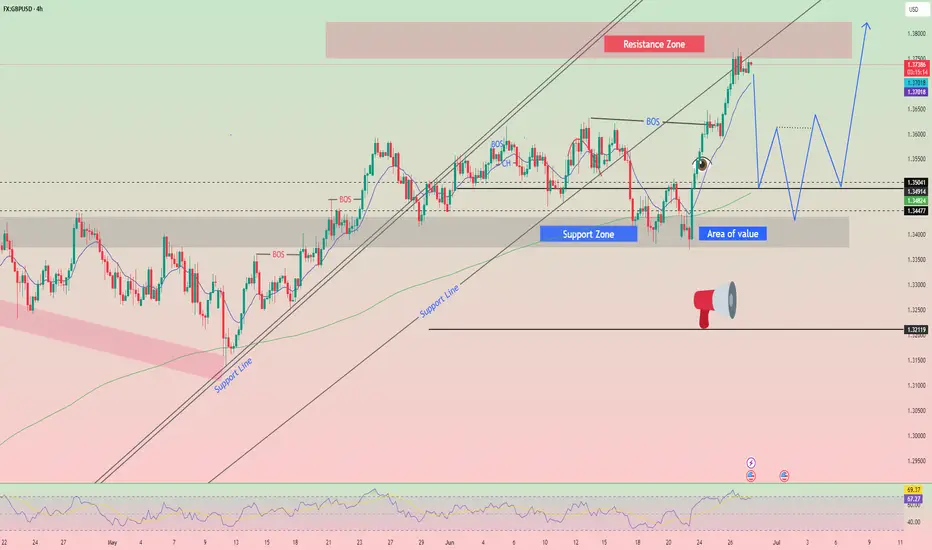
GBPUSD Selling from resistance at 1.37600📈 GBPUSD – Technical Analysis (4H Timeframe)
The pair is currently respecting an ascending channel, but price is reacting to a key resistance at 1.37600, indicating a potential short opportunity.
🔻 Sell Scenario:
If rejection holds, we could see a move toward the following technical targets:
📍 1st Target – 1.36000 (Demand Zone)
📍 2nd Target – 1.34000 (Demand Zone)
📍 3rd Target – 1.32500 (Bullish Order Block)
Stay sharp — structure remains bullish overall, but short-term corrections are in play!
---
📲 Like, Follow & Comment
💬 Drop your thoughts below & join us for more real-time trade setups and market insights!
#Forex #GBPUSD #PriceAction #TechnicalAnalysis #ForexSignals #LiviaTrades 😜