A Good Trade & An Even Better Trading LessonA good trading idea on the GBPUSD, looking at a potential bearish trend continuation trade using a breakout & pullback technique. But an even better trading lesson on the importance of having rules for how to analyze the market so that you can avoid confusion and/or conflicting signals.
If you have any questions or comments please leave them below.
Akil
GBPUSD trade ideas

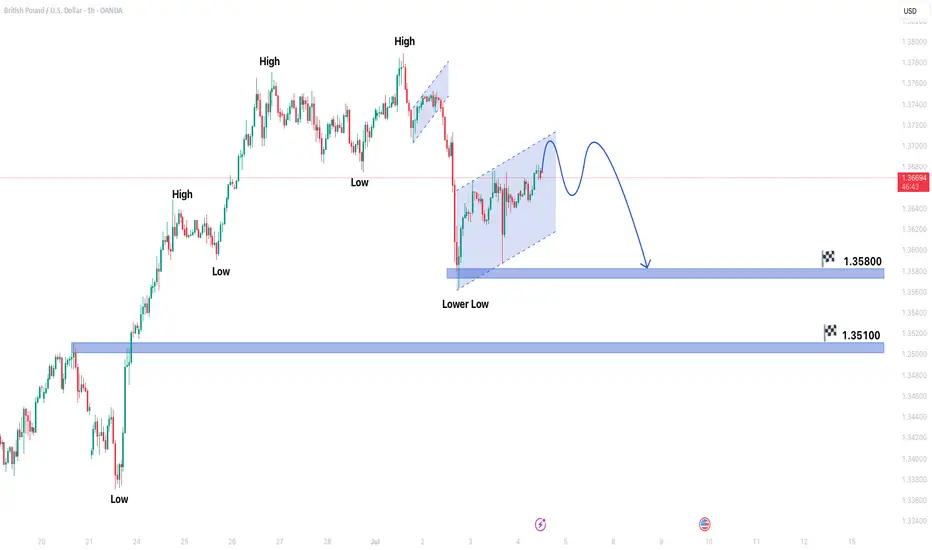
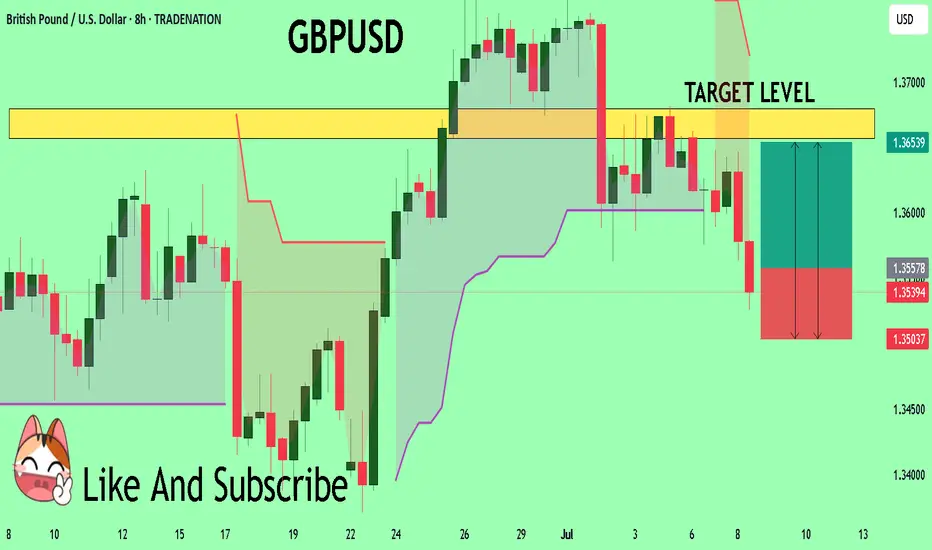
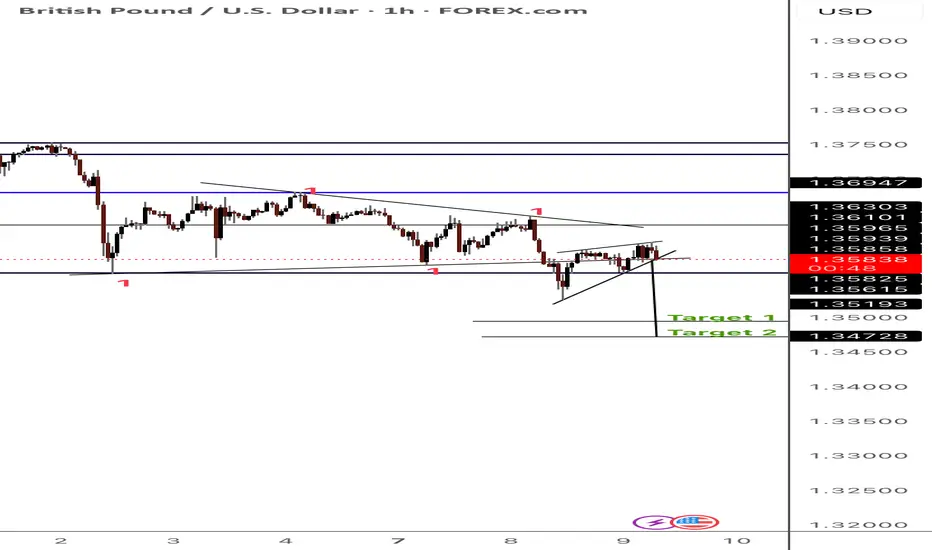
GBPUSD forming bearish trend in 1 hour time frameGBPUSD forming bearish trend in 1 hour time frame.
Market is forming lower low which shows indicates bearish trend.
Price is also forming Bearish flag pattern.
Market is expected to remain bearish in upcoming trading sessions.
On lower side market can hit the target levels of 1.35800 & 1.35100.
On higher side market may test the resistance level of 1.37900.
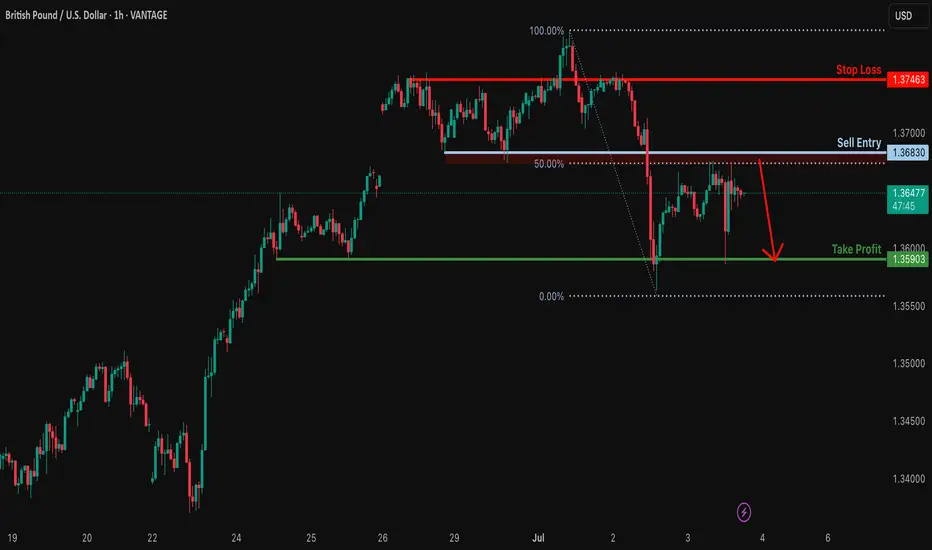
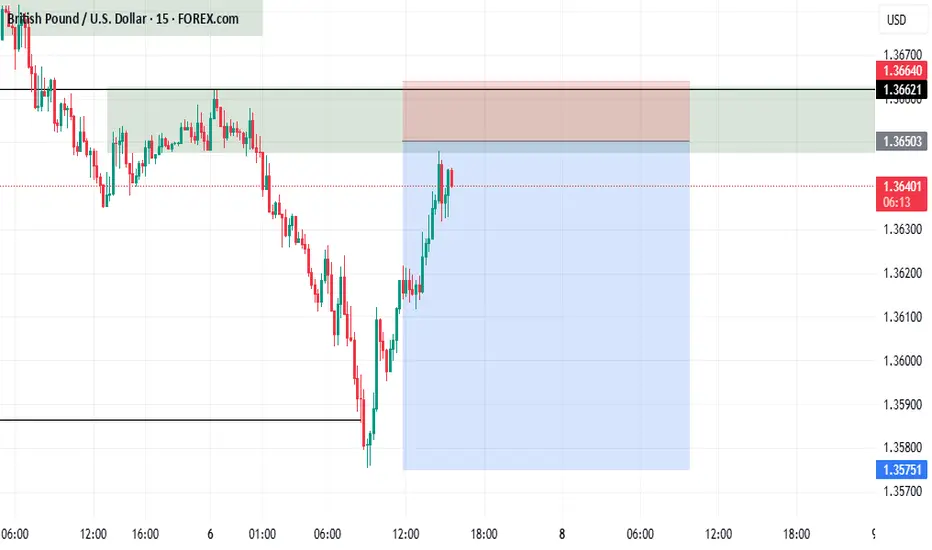
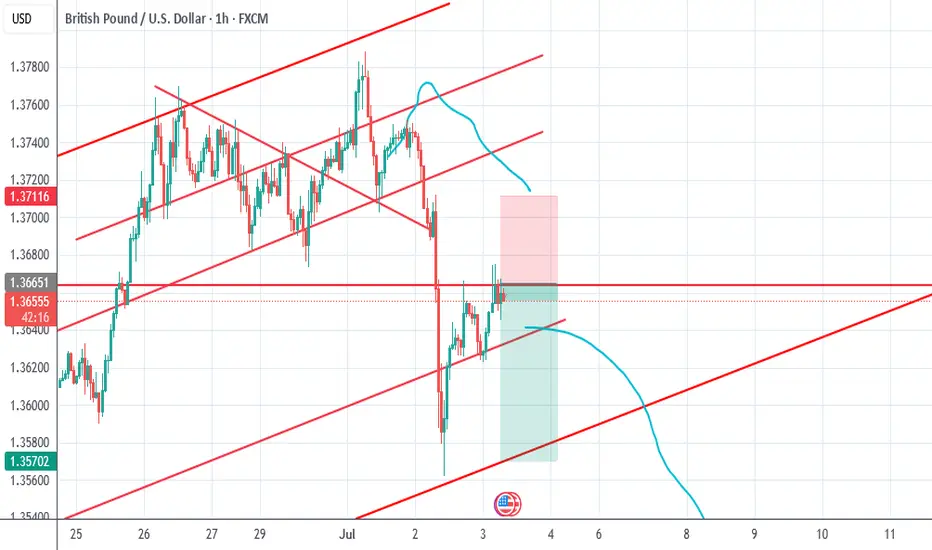
Bearish reversal off pullback resistance?GBP/USD is rising towards the resistance level which is a pullback resistance that is slightly above the 50% Fibonacci retracement and could drop from this level to our take profit.
Entry: 1.3683
Why we like it:
There is a pullback resistance level that is slightly above the 50% Fibonacci retracement.
Stop loss: 1.3746
Why we like it:
There is a pullback resistance level.
Take profit: 1.3590
Why we like it:
There is a pullback support level.
Enjoying your TradingView experience? Review us!
Please be advised that the information presented on TradingView is provided to Vantage (‘Vantage Global Limited’, ‘we’) by a third-party provider (‘Everest Fortune Group’). Please be reminded that you are solely responsible for the trading decisions on your account. There is a very high degree of risk involved in trading. Any information and/or content is intended entirely for research, educational and informational purposes only and does not constitute investment or consultation advice or investment strategy. The information is not tailored to the investment needs of any specific person and therefore does not involve a consideration of any of the investment objectives, financial situation or needs of any viewer that may receive it. Kindly also note that past performance is not a reliable indicator of future results. Actual results may differ materially from those anticipated in forward-looking or past performance statements. We assume no liability as to the accuracy or completeness of any of the information and/or content provided herein and the Company cannot be held responsible for any omission, mistake nor for any loss or damage including without limitation to any loss of profit which may arise from reliance on any information supplied by Everest Fortune Group.
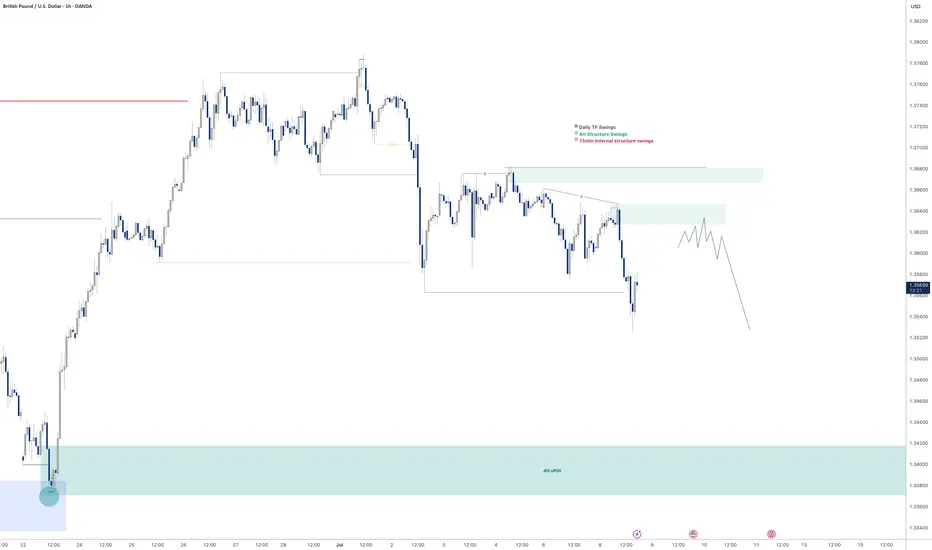
GBPUSD Short idea! Yes, we're bullish on the Daily timeframe. This is a continuation of the 4H bearish pullback. For me, we're not far enough into the discount leg of the daily swing. I'd like to see some of those hefty imbalances get filled first.
Risky, given that we've only wicked that recent 4H swing low, so waiting for 15m confirmation within that 1H extreme OB. Targeting the 4H swing low for a 2.5RR.
We could switch up, and rally up now, but the DXY is showing some more potential upside strength in the short term. So, this aligns well with my notion of more GBP downside, ahead of the next rally up!
we wait patiently while eating graduallycheck my previous post to see a comprehensive explanation of why i took this trade in the first place

GBPUSD - 2 potential selling opportunitiesLooking at GBPUSD
We have 2 potential selling POI's.
The first one being a point in which we will need to sit on our hands for a little bit to see what price does at there is no inducement in the push down in the impulse leg. With that being the case we will need to see some sort of inducement built before we enter that POI
IF we clear the first POI I think I will take a more aggressive entry on the secondary POI that sits a little bit higher. This is due to us having already put in some sort of liquidity in and around that POI before pushing lower.
Will wait and see what happens.
Tomorrow could be a very good trading day
short idea!hi all. after hitting to a WA and reversing, market needs an LOZ to go lower more. be careful and use your conformation before entering. be happy(wink)
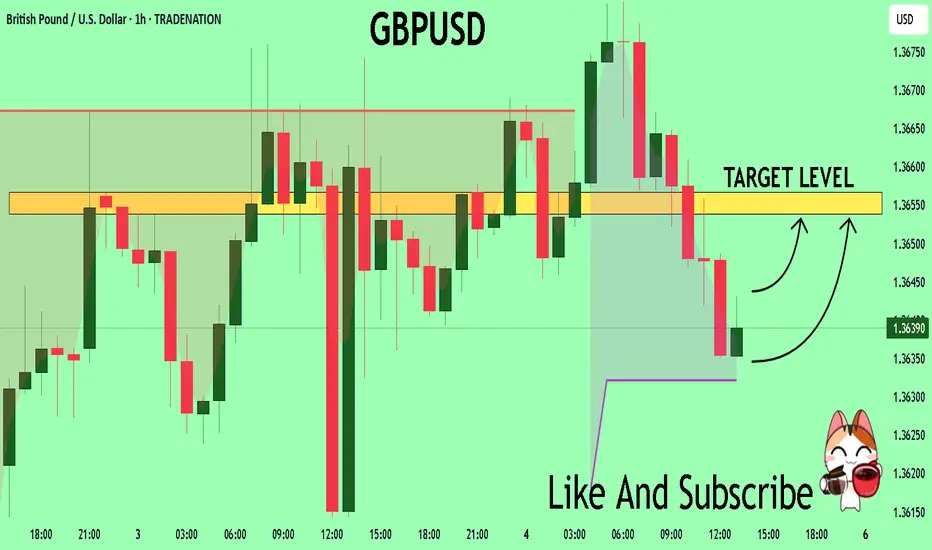
GBPUSDGBPUSD also needs one more push up once the correction is completed. Correction needs more time, perhaps this week drop and next week more upside.
Disclosure: We are part of Trade Nation's Influencer program and receive a monthly fee for using their TradingView charts in our analysis.
GBPUSD Expected Growth! BUY!
My dear friends,
GBPUSD looks like it will make a good move, and here are the details:
The market is trading on 1.3557 pivot level.
Bias - Bullish
Technical Indicators: Supper Trend generates a clear long signal while Pivot Point HL is currently determining the overall Bullish trend of the market.
Goal - 1.3657
Recommended Stop Loss - 1.3503
About Used Indicators:
Pivot points are a great way to identify areas of support and resistance, but they work best when combined with other kinds of technical analysis
Disclosure: I am part of Trade Nation's Influencer program and receive a monthly fee for using their TradingView charts in my analysis.
———————————
WISH YOU ALL LUCK
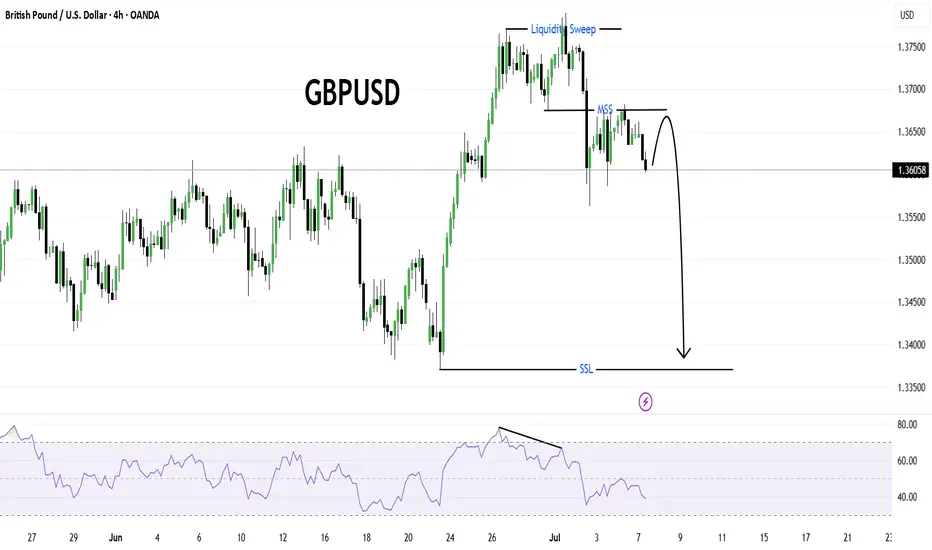
GBPUSDThe market structure on GBPUSD shows a clear liquidity sweep above recent highs, followed by a market structure shift (MSS) to the downside, signaling a potential reversal. After the liquidity grab, price failed to sustain above the swept highs and started to form lower highs.
The RSI indicator also confirms a bearish divergence, strengthening the bearish bias. Currently, price is consolidating below the MSS level, which could act as a supply zone on any retest.
A strong bearish continuation is expected, targeting the SSL (Sell-side Liquidity) level marked below, which aligns with a potential demand zone from late June. The bearish projection suggests a move toward the 1.3350–1.3400 area.
This setup favors short opportunities on lower timeframe pullbacks, maintaining a bearish outlook as long as the price remains below the MSS.
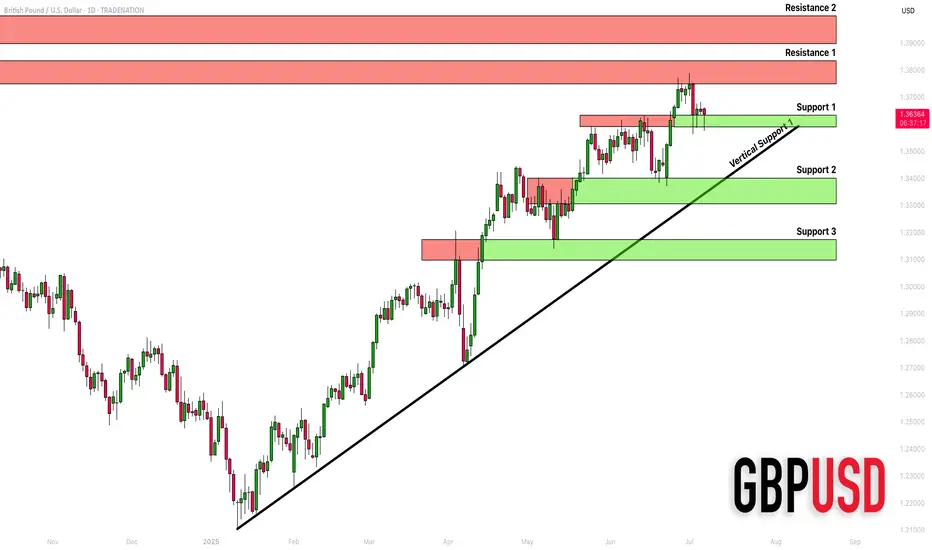
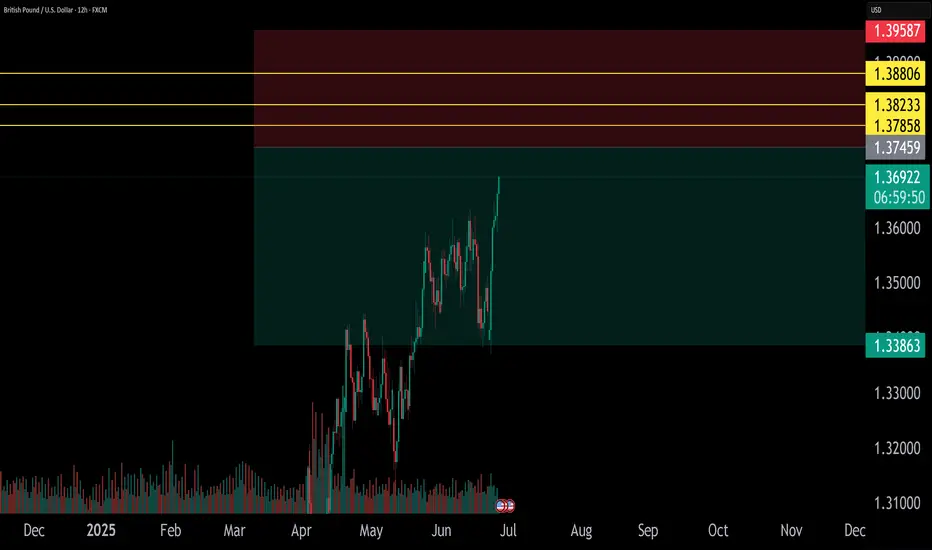
GBPUSD: Detailed Support & Resistance Analysis 🇬🇧🇺🇸
Here is my structure analysis for GBPUSD.
Horizontal Structures
Support 1: 1.3588 - 1.3633 area
Support 2: 1.3305 - 1.3400 area
Support 3: 1.3097 - 1.3175 area
Resistance 1: 1.3748 - 1.3835 area
Resistance 2: 1.3900 - 1.3400 area
Vertical Structures
Vertical Support 1: rising trend line
Consider these structures for pullback/breakout trading.
❤️Please, support my work with like, thank you!❤️
I am part of Trade Nation's Influencer program and receive a monthly fee for using their TradingView charts in my analysis.
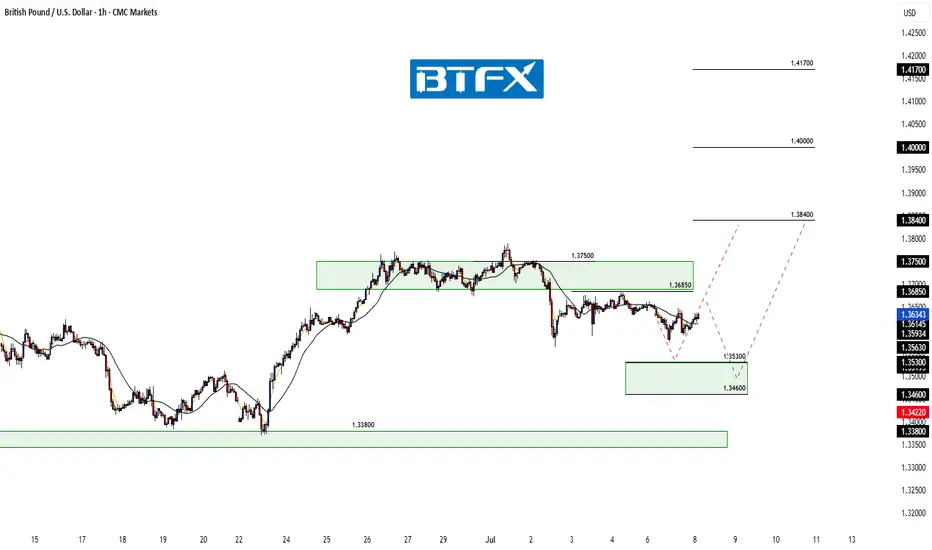
GBP/USD: Short‑Term Pullback Likely Before Fresh Upside AttemptHi everyone,
GBP/USD continues to consolidate below the 1.36850 level. We expect a retest of this level today; should price fail to break above, we anticipate a move lower to find buying interest between the 1.35300 and 1.34600 zones. A drop into this area appears to be the more probable short‑term path and could set the stage for another push higher.
As previously noted, a decisive break above 1.37500 would renew our expectation for further upside, with the next key target around 1.38400. We'll be monitoring price action closely to see how it unfolds.
We’ll continue to provide updates on the projected path for GBP/USD as price approaches this target.
The longer-term outlook remains bullish, and we expect the rally to continue extending further from the 1.20991 January low towards 1.40000 and 1.417000.
We’ll be keeping you updated throughout the week with how we’re managing our active ideas. Thanks again for all the likes/boosts, comments and follows — we appreciate the support!
All the best for the week ahead. Trade safe.
BluetonaFX
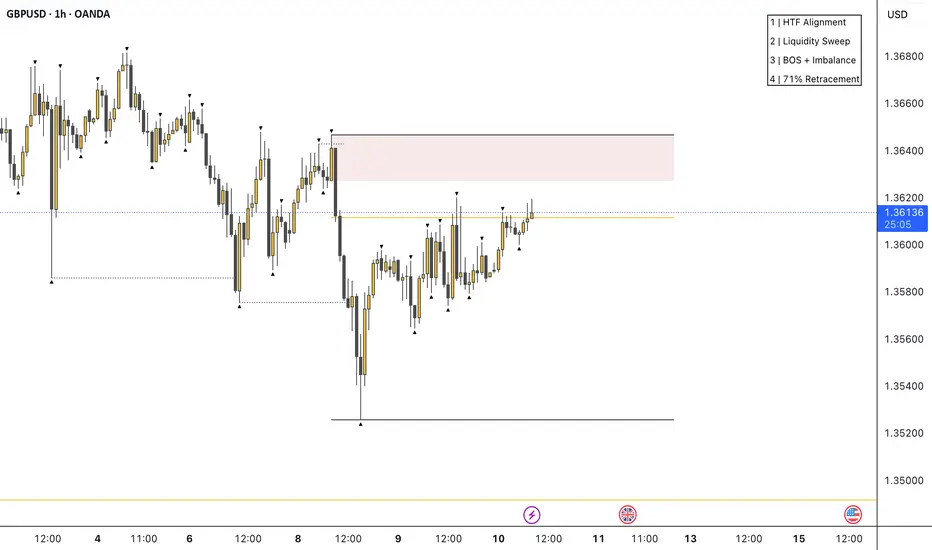
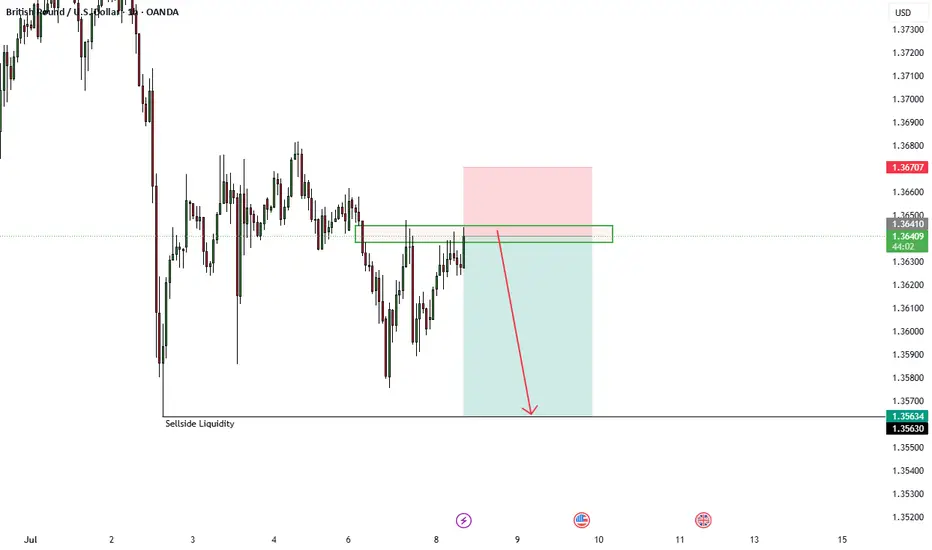
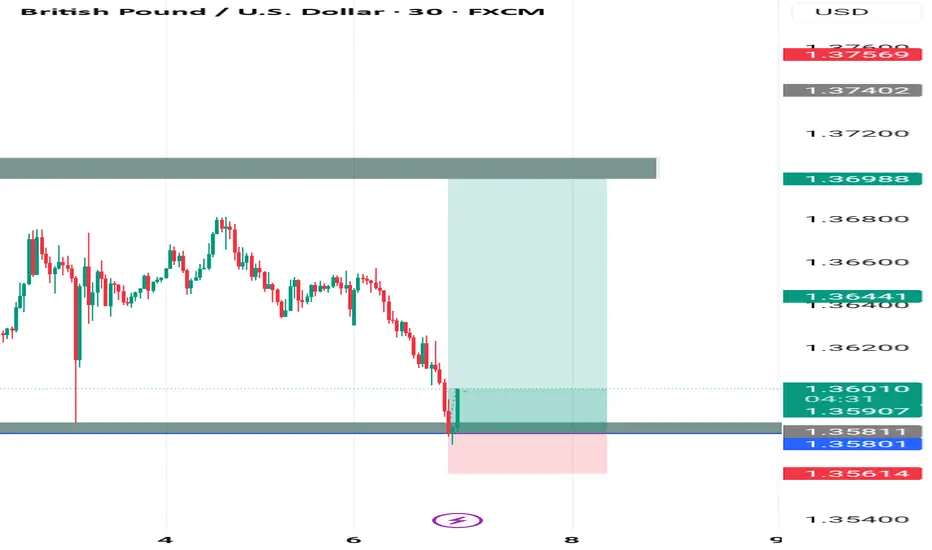
GBPUSD 1:2.64 R Trade Idea - 1hr Liquidity Sweep - ICTBeautiful 1:2.64 Trade Idea for a short on GPBUSD, aiming for the 1hr low to take out the 1hr SS Liquidity
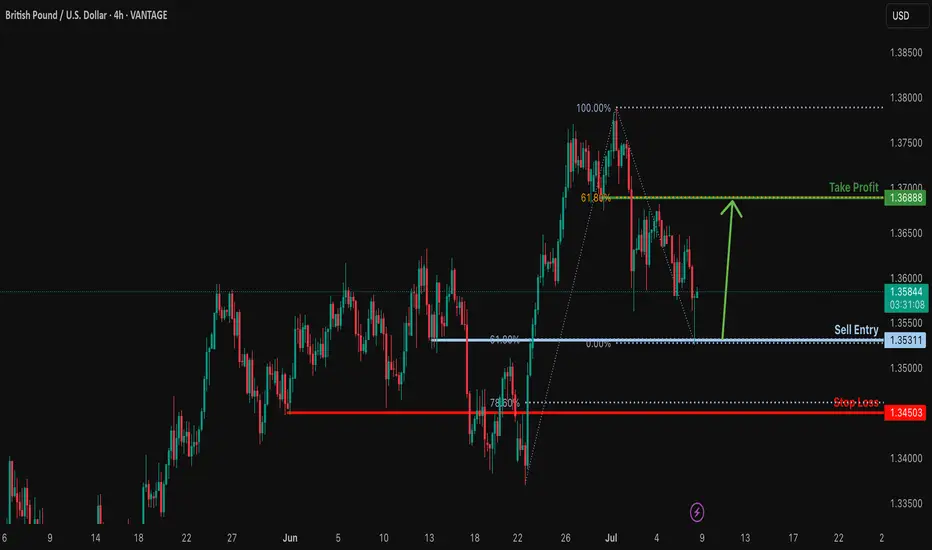
Bullish bounce?GBP/USD has bounced off the support level which is a pullback support that aligns with the 61.8% Fibonacci retracement and could rise from this level too ur take profit.
Entry: 1.3531
Why we like it:
There is a pullback support level that aligns with the 61.8% Fibonacci retracement.
Stop loss: 1.3450
Why we like it:
There is a pullback support level that lines up with the 78.6% Fibonacci retracement.
Take profit: 1.3688
Why we like it:
There is an overlap resistance level that aligns with the 61.8% Fibonacci retracement.
Enjoying your TradingView experience? Review us!
Please be advised that the information presented on TradingView is provided to Vantage (‘Vantage Global Limited’, ‘we’) by a third-party provider (‘Everest Fortune Group’). Please be reminded that you are solely responsible for the trading decisions on your account. There is a very high degree of risk involved in trading. Any information and/or content is intended entirely for research, educational and informational purposes only and does not constitute investment or consultation advice or investment strategy. The information is not tailored to the investment needs of any specific person and therefore does not involve a consideration of any of the investment objectives, financial situation or needs of any viewer that may receive it. Kindly also note that past performance is not a reliable indicator of future results. Actual results may differ materially from those anticipated in forward-looking or past performance statements. We assume no liability as to the accuracy or completeness of any of the information and/or content provided herein and the Company cannot be held responsible for any omission, mistake nor for any loss or damage including without limitation to any loss of profit which may arise from reliance on any information supplied by Everest Fortune Group.
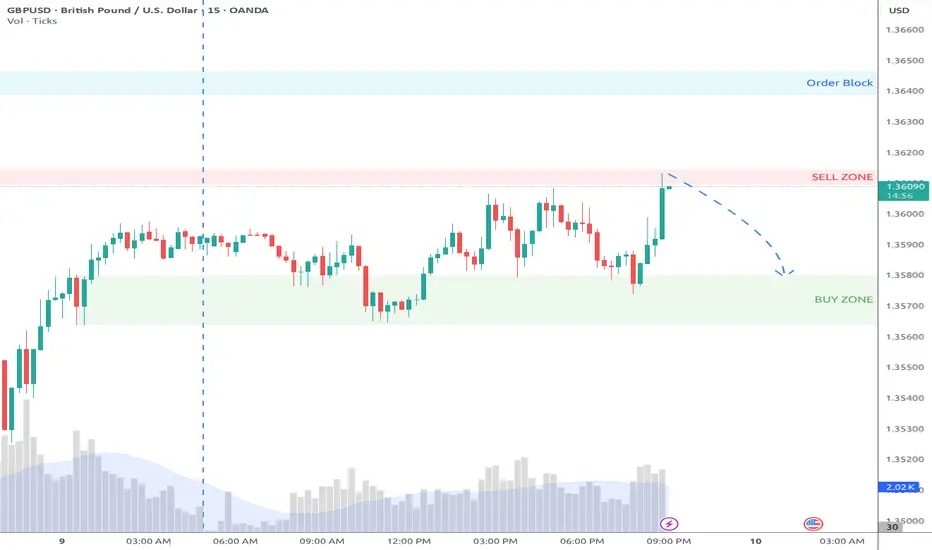
GBPUSD 15/3 Sell1-hr and 15 are all bear. And it is in a sell zone. Will need to drop down to 3-min to confirm market shift in order to sell to the demand zone.
GBPUSD Sell analysis/ideaThis analysis is based on the daily and 4-hour timeframes and executed using reversal trading and trend formation. Complete explanation in the video!

GBPUSD Sellers In Panic! BUY!
My dear friends,
Please, find my technical outlook for GBPUSD below:
The price is coiling around a solid key level - 1.3638
Bias - Bullish
Technical Indicators: Pivot Points Low anticipates a potential price reversal.
Super trend shows a clear buy, giving a perfect indicators' convergence.
Goal - 1.3653
About Used Indicators:
The pivot point itself is simply the average of the high, low and closing prices from the previous trading day.
Disclosure: I am part of Trade Nation's Influencer program and receive a monthly fee for using their TradingView charts in my analysis.
———————————
WISH YOU ALL LUCK
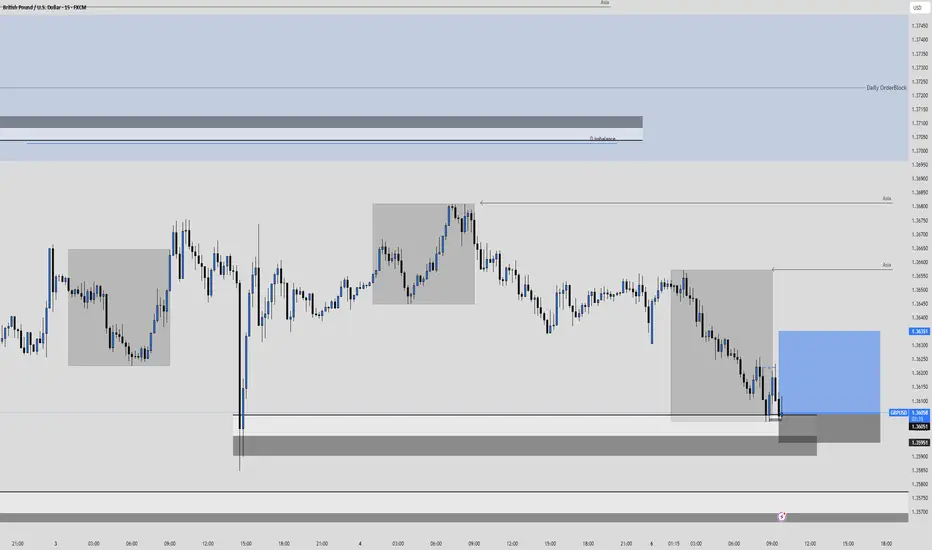
GBPUSD Long, 07 JulyAsia Fill Setup
This is a pure Asia Fill trade, backed by recent bullish LTF structure and a clean reaction from a 15m decisional OB. Although HTF isn’t perfectly aligned for longs, the momentum and intraday structure make this setup valid.
📍 Entry: 1m BOS from 15m OB, refined entry from 1m OB
📈 Confluence: Trend, structure, and Asia high as a clear target
🔁 Risk: SL doesn’t fully cover the OB, but BOS + clean reaction justifies the entry
🎯 Target: Asia High (1:3 RR), with BE secured quickly if price moves favorably
Not a perfect setup HTF-wise, but strong intraday alignment makes it worth the shot.
GBPUSDTake trade at a strong green candle and sell as per technical analysis. Profit should be as per price action
GBP/USD Short Idea Analysis : GBP/USD is approaching a critical resistance zone between 1.37850 and 1.38800 on the daily timeframe, presenting a potential short opportunity based on technical and fundamental factors.
Technical Analysis:
Price Action: The 1.37850–1.38800 zone aligns with prior highs and a strong resistance area, likely to trigger rejection or a bearish reversal pattern (e.g., double top or bearish engulfing).
Support/Target: Initial support at 1.3700, with a deeper target at 1.3600 if bearish momentum builds.
Indicators: RSI is approaching overbought territory (near 70), signaling potential exhaustion. MACD shows slowing bullish momentum, supporting a short bias.
Fibonacci: The 1.37850–1.38800 zone coincides with the 76.4%–88.6% Fibonacci retracement of the prior downmove, reinforcing resistance.
Fundamental Context:
UK economic data (e.g., weaker retail sales or PMI) suggests GBP vulnerability. Meanwhile, USD strength is bolstered by hawkish Fed expectations and resilient US economic indicators.
Risks: A breakout above 1.3900 could invalidate the setup. Monitor BoE rhetoric and US data releases for sudden shifts.
Conclusion: The 1.37850–1.38800 resistance zone offers a high-probability short setup for GBP/USD, supported by technical resistance and USD-favorable fundamentals. Use strict risk management due to potential volatility.
Triangle Formation (Rising wedge STF) I believe we can see some downside here. Price has bounced of the 61.8 fib level and looks to have created a triangle pattern. I’m not currently in any positions, I will wait for a breakout of the rising wedge for a short position.
GBPUSD BUY OPPORTUNITY Buy GBPUSD Now. It on key level
Entry: 1.35800
Stoploss: 1.35600
Take profit: 1.3700
Comment your opinion now.
For Fund Management Contact me on X @shajudeakinoba1
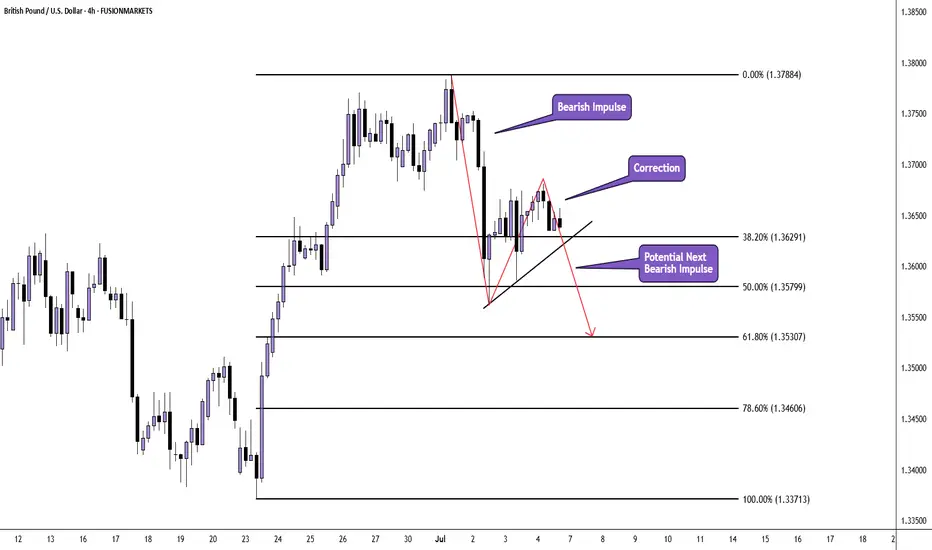
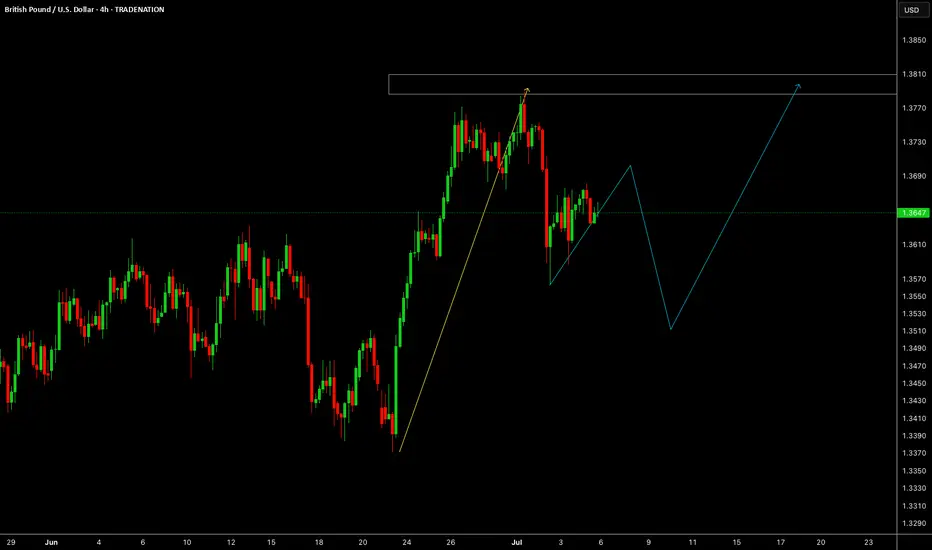
GBP/USD H4 AnlysisPrice appears to be correcting the huge bullish impulse move which originated on 23rd June 2025 and ended on 1st July 2025.
We have already seen an impulse from the sellers after price peaked at 1.37887 at the beginning of the month.
Current price action is taking the form of a correction and there is the potential of another move down.
If you agree with this analysis, look for a trade that meets your strategy rules.