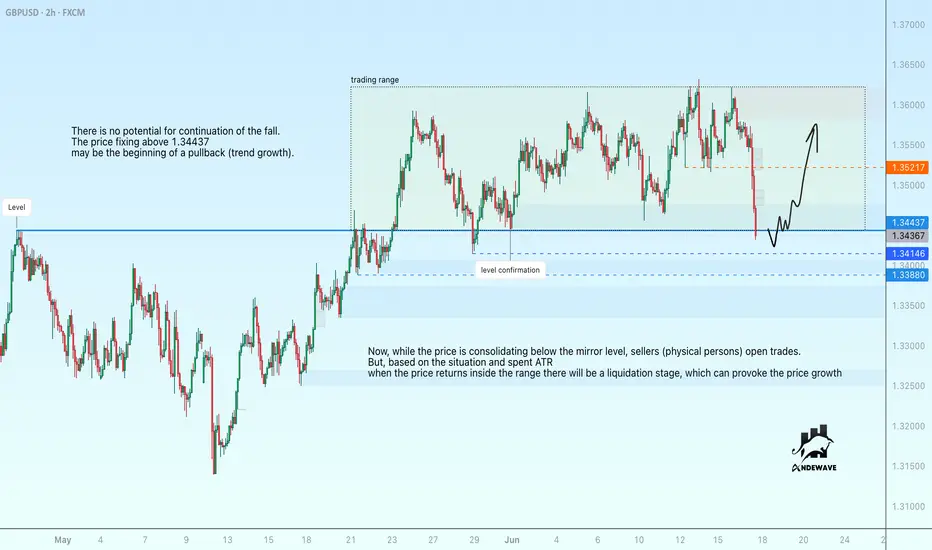
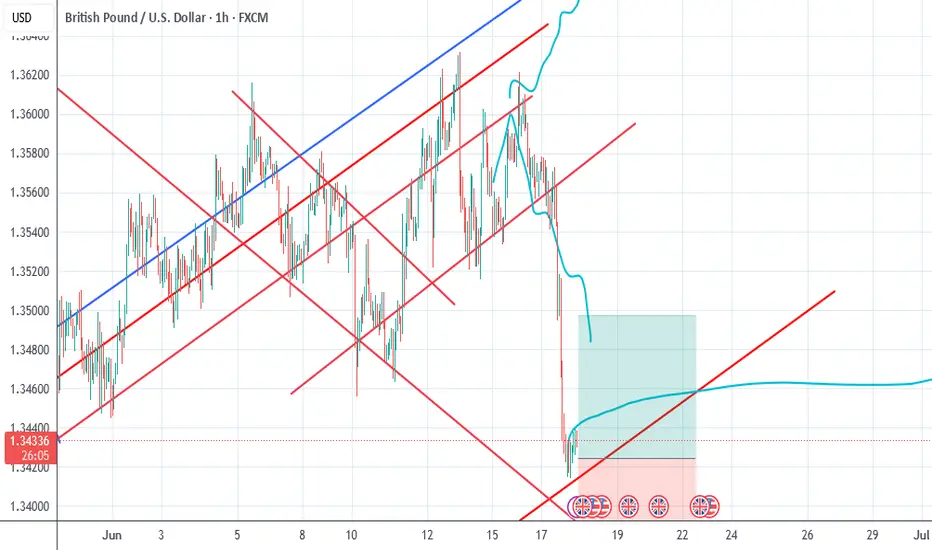
GBPUSD may form a false break of supportGBPUSD has wasted the entire daily move (ATR) and is forming a false break of the mirror level support and trading range support. The price fell on the background of the dollar growth (which is trading on the background of the global downtrend)
Now, while the price is consolidating below the mirror level, sellers (physical persons) open deals. But, based on the situation and spent ATR when the price returns inside the range there will be a liquidation stage, which can provoke the price growth
The price fixing above 1.34437 may be the beginning of a pullback (trend growth).
Scenario: if the decline does not continue, and the price is able to consolidate above 1.3448, in this case we can expect a correction to 1.35, 1.353.
GBPUSD trade ideas
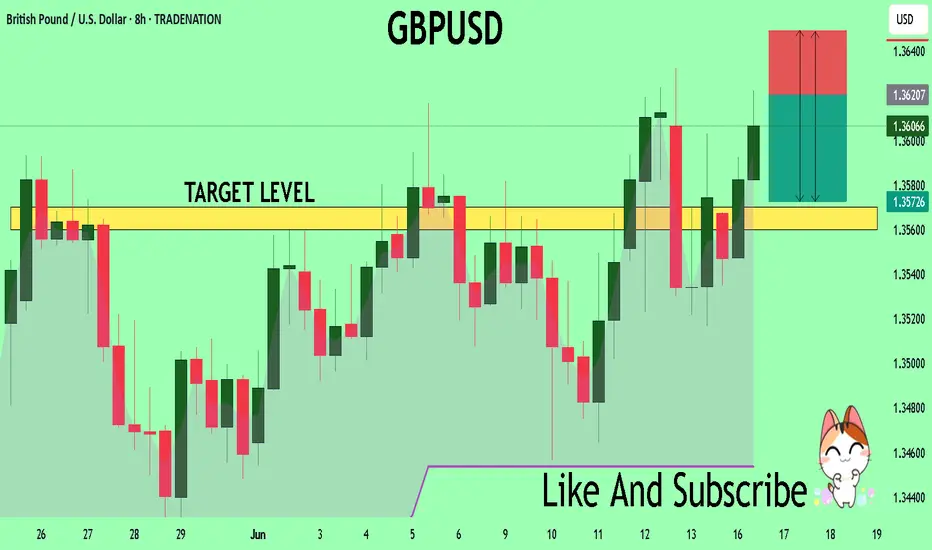
GBPUSD SHORT FORECAST Q2 W25 D18 Y25GBPUSD SHORT FORECAST Q2 W25 D18 Y25
Professional Risk Managers👋
Welcome back to another FRGNT chart update📈
Diving into some Forex setups using predominantly higher time frame order blocks alongside confirmation breaks of structure.
Let’s see what price action is telling us today!
💡Here are some trade confluences📝
✅Weekly order block
✅15' order block
✅Intraday 15' break of structure
✅Tokyo ranges to be filled
🔑 Remember, to participate in trading comes always with a degree of risk, therefore as professional risk managers it remains vital that we stick to our risk management plan as well as our trading strategies.
📈The rest, we leave to the balance of probabilities.
💡Fail to plan. Plan to fail.
🏆It has always been that simple.
❤️Good luck with your trading journey, I shall see you at the very top.
🎯Trade consistent, FRGNT X

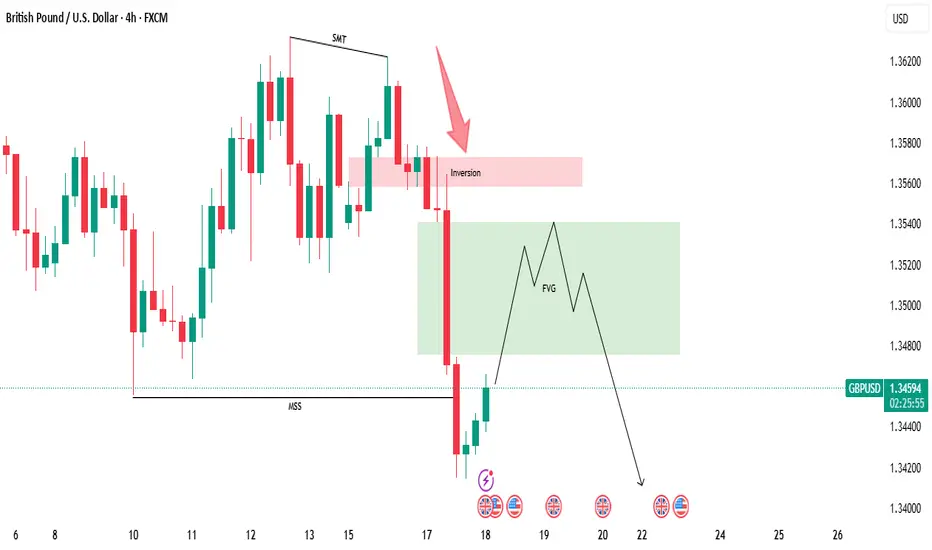
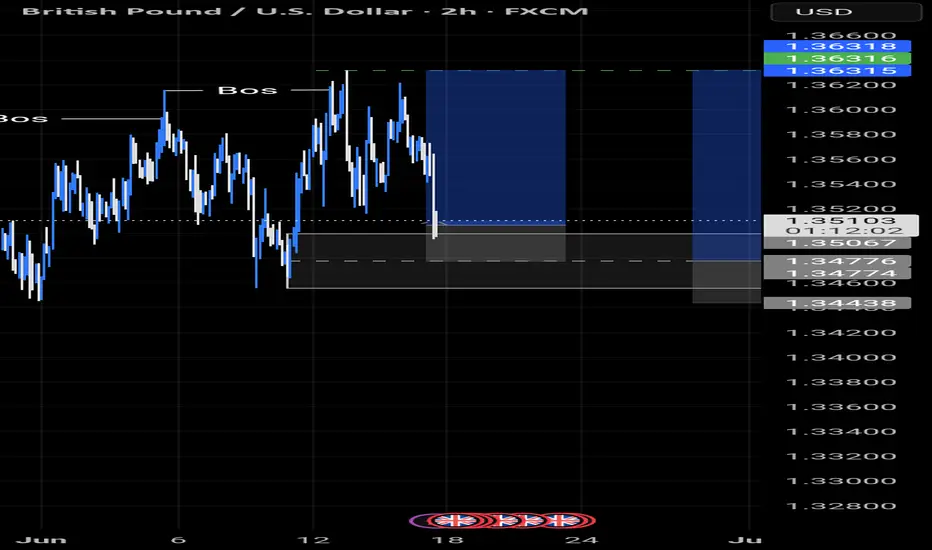
What to Watch For Next!💡 GBPUSD Bearish Trade Outlook – Detailed Analysis
The GBPUSD pair has recently shown a clear Market Structure Shift (MSS) to the downside — a strong sign that bearish momentum may be taking control. Alongside this shift, we’ve also seen the formation of a Bearish Fair Value Gap (FVG) on the 4-hour timeframe, which adds further confluence to the potential for continued downside.
📍 What This Means:
The break in structure combined with the FVG suggests that institutional activity may be driving price lower, possibly targeting areas of untapped liquidity beneath previous lows. These are often high-probability setups when traded with confirmation.
🔎 What to Watch For Next:
At this point, it's best to wait patiently for the price to retrace into the 4H FVG zone. Once price taps this area, we should closely monitor lower timeframes (such as 15M or 5M) for bearish confirmation entries — like a bearish engulfing pattern, change in character (ChoCH), or internal MSS.
📉 Potential Trade Idea:
If confirmation occurs, we can look to enter a sell position, targeting downside liquidity levels, such as previous swing lows or equal lows — where the market often hunts liquidity.
⚠️ Risk Reminder:
As always, avoid entering blindly. Let the market give you a clear sign. Use proper risk management, and stick to your strategy.
📚 DYOR – Do Your Own Research!
The market doesn’t guarantee outcomes. Your own analysis, patience, and discipline are your best tools.
GU-Wed-18/06/25 TDA-Amid middle east tensions, USD strengtheningAnalysis done directly on the chart
Follow for more, possible live trades update!
Just like a person that wants to become a doctor,
an engineer or whatever. It needs to study, learn,
apply, improve, and repeat the process again and again.
You can't pretend to know how to trade, if you haven't
gone through the process of study, learning, applying
and improving.
Active in London session!
Not financial advice, DYOR.
Market Flow Strategy
Mister Y

GBPUSD - Analysis (18th June 2025)Here is an analysis on Cable, and basically showcasing how I would form a bias, a narrative, an potential trade setups.
I hope it is insightful for you.
- R2F Trading

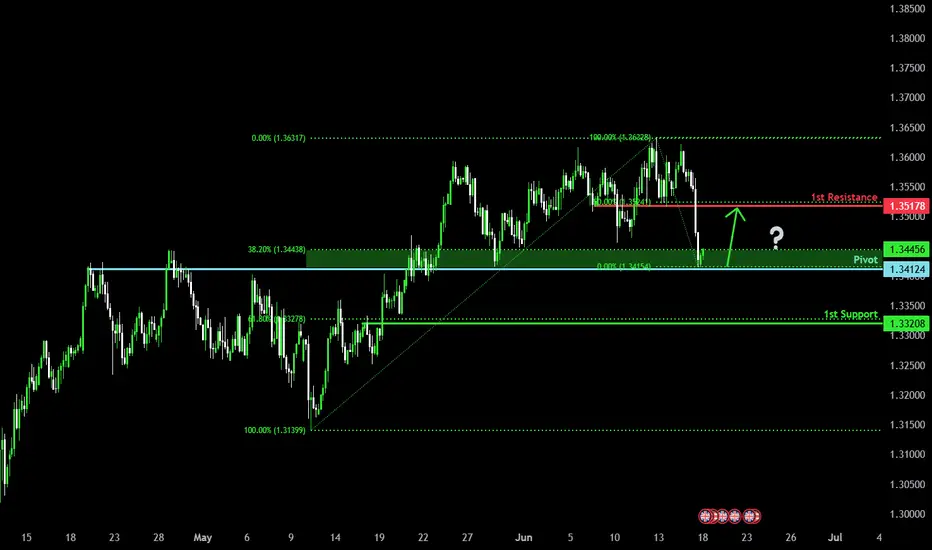
Bullish reversal off overlap support?The Cable (GBP/USD) has bounced off the pivot and could rise to the 50% Fibonacci resistance.
Pivot: 1.3412
1st Support: 1.3320
1st Resistance: 1.3517
Risk Warning:
Trading Forex and CFDs carries a high level of risk to your capital and you should only trade with money you can afford to lose. Trading Forex and CFDs may not be suitable for all investors, so please ensure that you fully understand the risks involved and seek independent advice if necessary.
Disclaimer:
The above opinions given constitute general market commentary, and do not constitute the opinion or advice of IC Markets or any form of personal or investment advice.
Any opinions, news, research, analyses, prices, other information, or links to third-party sites contained on this website are provided on an "as-is" basis, are intended only to be informative, is not an advice nor a recommendation, nor research, or a record of our trading prices, or an offer of, or solicitation for a transaction in any financial instrument and thus should not be treated as such. The information provided does not involve any specific investment objectives, financial situation and needs of any specific person who may receive it. Please be aware, that past performance is not a reliable indicator of future performance and/or results. Past Performance or Forward-looking scenarios based upon the reasonable beliefs of the third-party provider are not a guarantee of future performance. Actual results may differ materially from those anticipated in forward-looking or past performance statements. IC Markets makes no representation or warranty and assumes no liability as to the accuracy or completeness of the information provided, nor any loss arising from any investment based on a recommendation, forecast or any information supplied by any third-party.
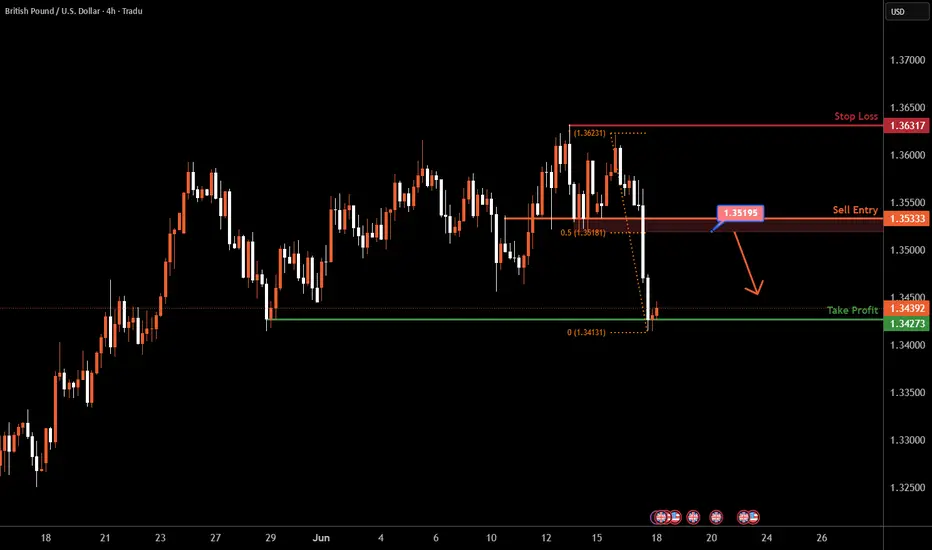
GBPUSD H4 I Bearish Reversal Based on the H4 chart, the price is rising toward our sell entry level at 1.3519 - 1.3533, a pullback resistance that aligns closely with the 50% Fib retracement.
Our take profit is set at 1.3427, a swing low support.
The stop loss is set at 1.3631, a swing high resistance.
High Risk Investment Warning
Trading Forex/CFDs on margin carries a high level of risk and may not be suitable for all investors. Leverage can work against you.
Stratos Markets Limited (tradu.com ):
CFDs are complex instruments and come with a high risk of losing money rapidly due to leverage. 63% of retail investor accounts lose money when trading CFDs with this provider. You should consider whether you understand how CFDs work and whether you can afford to take the high risk of losing your money.
Stratos Europe Ltd (tradu.com ):
CFDs are complex instruments and come with a high risk of losing money rapidly due to leverage. 63% of retail investor accounts lose money when trading CFDs with this provider. You should consider whether you understand how CFDs work and whether you can afford to take the high risk of losing your money.
Stratos Global LLC (tradu.com ):
Losses can exceed deposits.
Please be advised that the information presented on TradingView is provided to Tradu (‘Company’, ‘we’) by a third-party provider (‘TFA Global Pte Ltd’). Please be reminded that you are solely responsible for the trading decisions on your account. There is a very high degree of risk involved in trading. Any information and/or content is intended entirely for research, educational and informational purposes only and does not constitute investment or consultation advice or investment strategy. The information is not tailored to the investment needs of any specific person and therefore does not involve a consideration of any of the investment objectives, financial situation or needs of any viewer that may receive it. Kindly also note that past performance is not a reliable indicator of future results. Actual results may differ materially from those anticipated in forward-looking or past performance statements. We assume no liability as to the accuracy or completeness of any of the information and/or content provided herein and the Company cannot be held responsible for any omission, mistake nor for any loss or damage including without limitation to any loss of profit which may arise from reliance on any information supplied by TFA Global Pte Ltd.
The speaker(s) is neither an employee, agent nor representative of Tradu and is therefore acting independently. The opinions given are their own, constitute general market commentary, and do not constitute the opinion or advice of Tradu or any form of personal or investment advice. Tradu neither endorses nor guarantees offerings of third-party speakers, nor is Tradu responsible for the content, veracity or opinions of third-party speakers, presenters or participants.
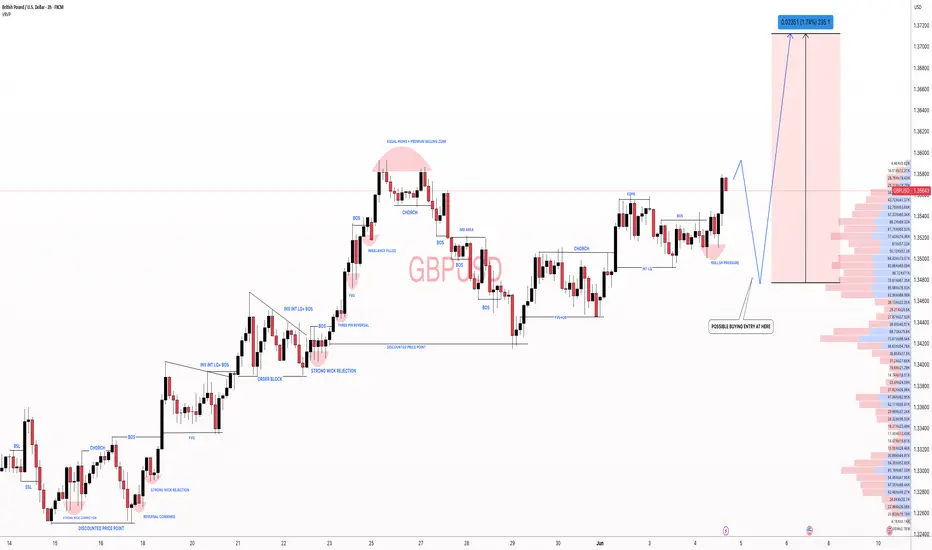
my projection on GBPUSD 17/06/25Major buy trend on the weekly TF but also a major reversal from daily TF so a sell.
looking for a retracement to my POI for a potential 1:7 RR.

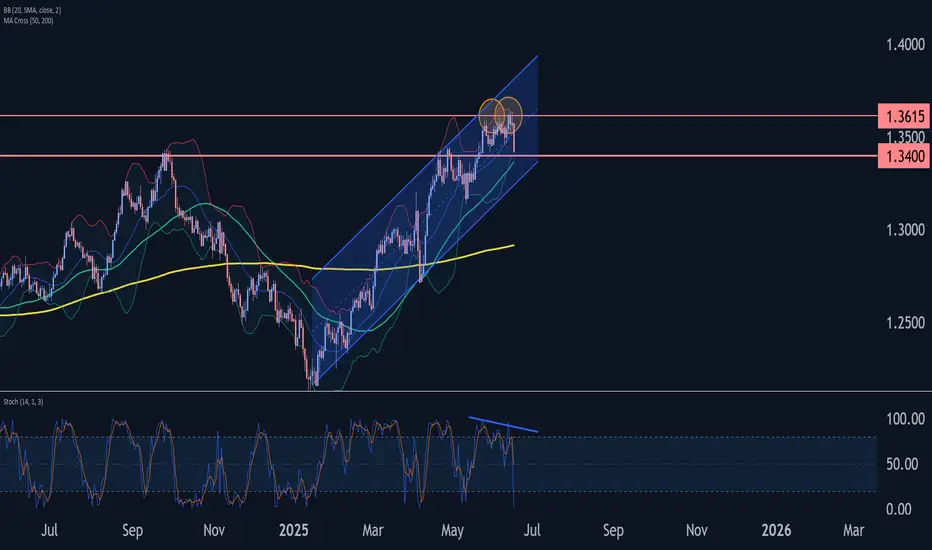
GBPUSD Wave Analysis – 17 June 2025- GBPUSD reversed from the resistance level 1.3615
- Likely to fall to support level at 1.3400
GBPUSD currency pair recently reversed down from the key resistance level 1.3615 (which has been reversing the price from the end of May) and the upper daily Bollinger Band.
The downward reversal from the resistance level 1.3615 formed the daily Japanese candlesticks reversal pattern Dark Cloud Cover – which was followed by the Shooting Star.
Given the bearish divergence on the daily Stochastic indicator, GBPUSD currency pair can be expected to fall to the next support level at 1.3400 (former resistance from April).
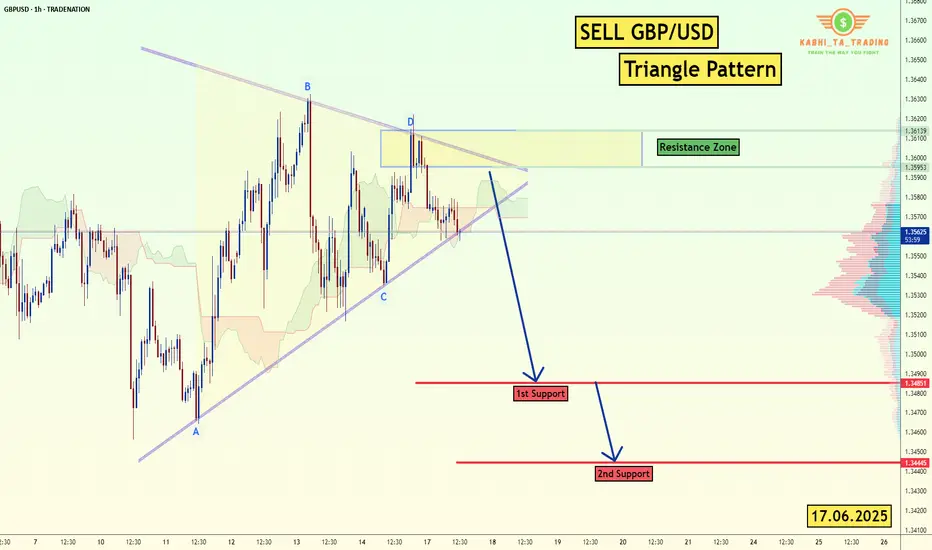
GBP/USD - H1-Triangle Breakout (17.06.2025)The GBP/USD Pair on the H1 timeframe presents a Potential Selling Opportunity due to a recent Formation of a Triangle Breakout Pattern. This suggests a shift in momentum towards the downside in the coming hours.
Possible Short Trade:
Entry: Consider Entering A Short Position around Trendline Of The Pattern.
Target Levels:
1st Support – 1.3485
2nd Support – 1.3444
🎁 Please hit the like button and
🎁 Leave a comment to support for My Post !
Your likes and comments are incredibly motivating and will encourage me to share more analysis with you.
Best Regards, KABHI_TA_TRADING
Thank you.
Disclosure: I am part of Trade Nation's Influencer program and receive a monthly fee for using their TradingView charts in my analysis.
GBP USD LONG RESULT Price has broken out of the major resistance Trendline and has been trading in a symmetrical triangle, so expected price to retest the minor resistance Trendline one more time before this turnel down.
But it's all good, part of the journey, better Setups yo come.💪
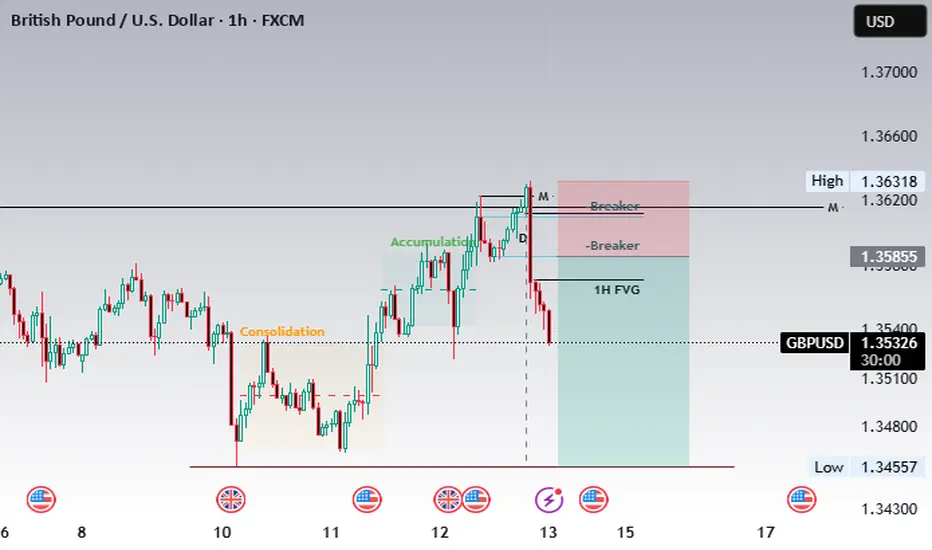
Bearish till 1.35158.Price has created a bearish Type 1 dealing range on the 1 hour chart within a type 2 dealing range. This warrants bearish price action till 1.35158. My entry is at 1.35892 which lines up with both the equilibrium price level of the range as well as the consequent encroachment of the balanced price range. Furthermore, note the market maker sell model formation on the 1H chart. This poses a high probability sell set-up.
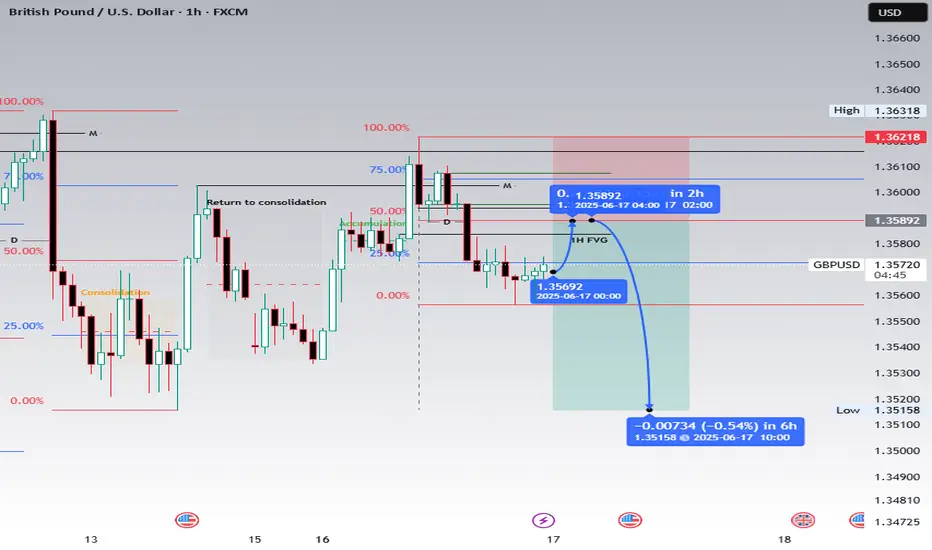
Short till 1.34557Price has entered the sellside curve of the market maker sell model. This has warranted bearish momentum down to 1.34557.
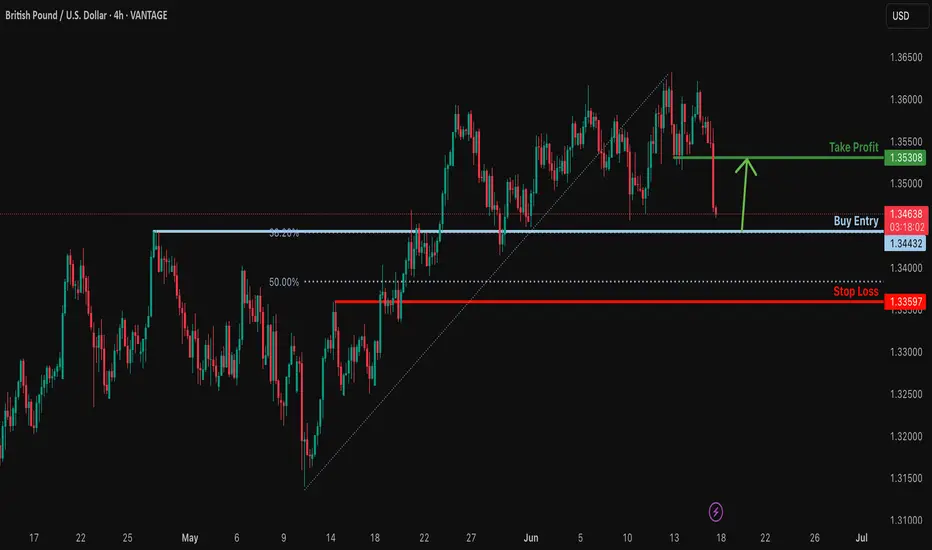
Bullish bounce off overlap support?GBP/USD is falling towards the support level which is an overlap support that aligns with the 38.2% Fibonacci retracement and could bounce from this level to our take profit.
Entry: 1.3443
Why we like it:
There is an overlap support level.
Stop loss: 1.3359
Why we like it:
There is a pullback support that is slightly below the 50% Fibonacci retracement.
Take profit: 1.3530
Why we like it:
There is a pullback resistance level.
njoying your TradingView experience? Review us!
Please be advised that the information presented on TradingView is provided to Vantage (‘Vantage Global Limited’, ‘we’) by a third-party provider (‘Everest Fortune Group’). Please be reminded that you are solely responsible for the trading decisions on your account. There is a very high degree of risk involved in trading. Any information and/or content is intended entirely for research, educational and informational purposes only and does not constitute investment or consultation advice or investment strategy. The information is not tailored to the investment needs of any specific person and therefore does not involve a consideration of any of the investment objectives, financial situation or needs of any viewer that may receive it. Kindly also note that past performance is not a reliable indicator of future results. Actual results may differ materially from those anticipated in forward-looking or past performance statements. We assume no liability as to the accuracy or completeness of any of the information and/or content provided herein and the Company cannot be held responsible for any omission, mistake nor for any loss or damage including without limitation to any loss of profit which may arise from reliance on any information supplied by Everest Fortune Group.
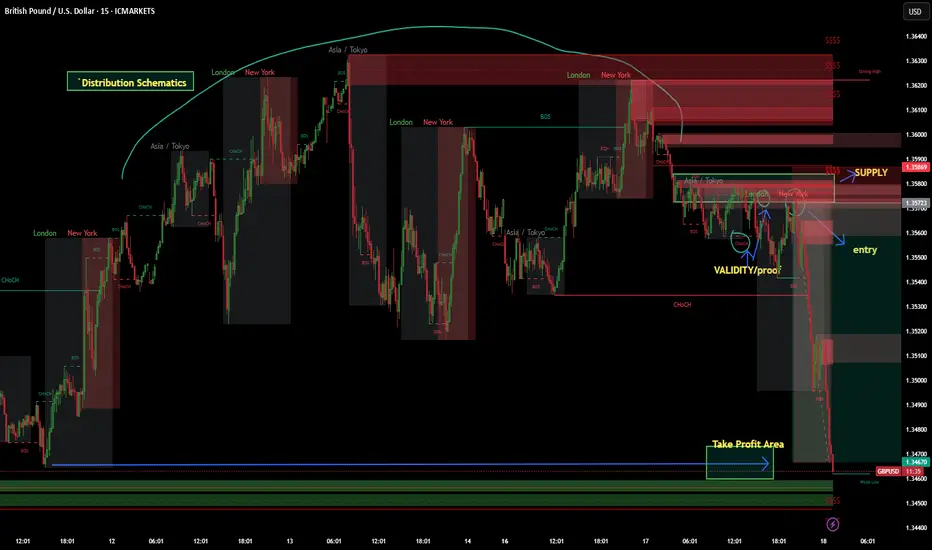
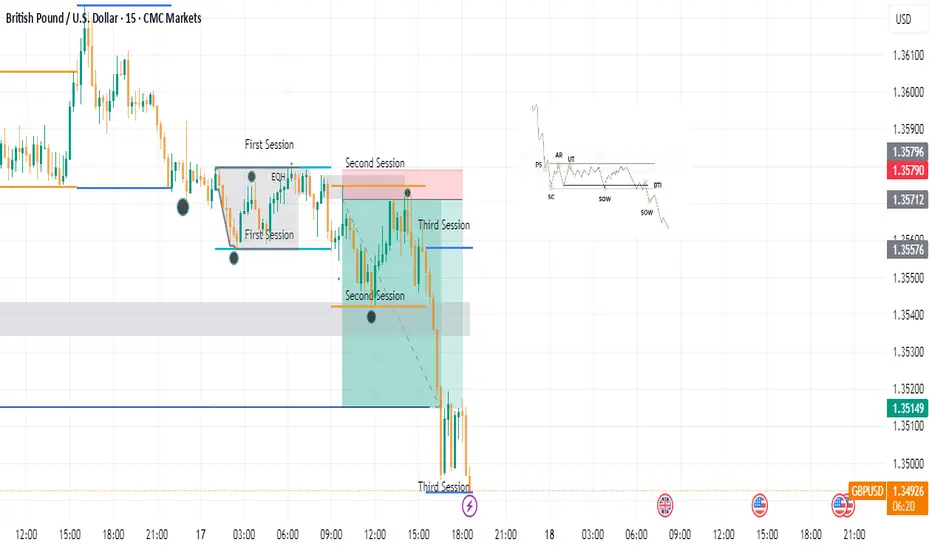
GBPUSD Sell Limit Activated June 17 2025This trade was taken today, (tuesday- june 17, 2025). Based on 1H timeframe Supply. I wait for London Session and check for possible liquidity sweep in 15 min and 5min timeframe. I noticed a CHOCH followed by tap in Supply zone of the schematics. I decide to create a sell limit order during New York Session to maximize the Risk to Reward Ratio. (Check the charts for detailed label and movement). 1:7RR
Wyckoff schematics in 1H timeframe--> confluence of supply in lower timeframes for validity.
RR:7
Another classic distribution. patience is the key :)
#wyckoff
#sell
#supplyanddemand
GBPUSD I Daily CLS I KL - OB I Model 1 I High riskHey, Market Warriors, here is another outlook on this instrument
If you’ve been following me, you already know every setup you see is built around a CLS Footprint, a Key Level, Liquidity and a specific execution model.
If you haven't followed me yet, start now.
My trading system is completely mechanical — designed to remove emotions, opinions, and impulsive decisions. No messy diagonal lines. No random drawings. Just clarity, structure, and execution.
🧩 What is CLS?
CLS is real smart money — the combined power of major investment banks and central banks moving over 6.5 trillion dollars a day. Understanding their operations is key to markets.
✅ Understanding the behavior of CLS allows you to position yourself with the giants during the market manipulations — leading to buying lows and selling highs - cleaner entries, clearer exits, and consistent profits.
📍 Model 1
is right after the manipulation of the CLS candle when CIOD occurs, and we are targeting 50% of the CLS range. H4 CLS ranges supported by HTF go straight to the opposing range.
"Adapt what is useful, reject what is useless, and add what is specifically your own."
— David Perk aka Dave FX Hunter ⚔️
👍 Hit like if you find this analysis helpful, and don't hesitate to comment with your opinions, charts or any questions.

#GBPUSDlooking for trades for this trade, no short entry for now no #financial advice, waiting for signals to enter.
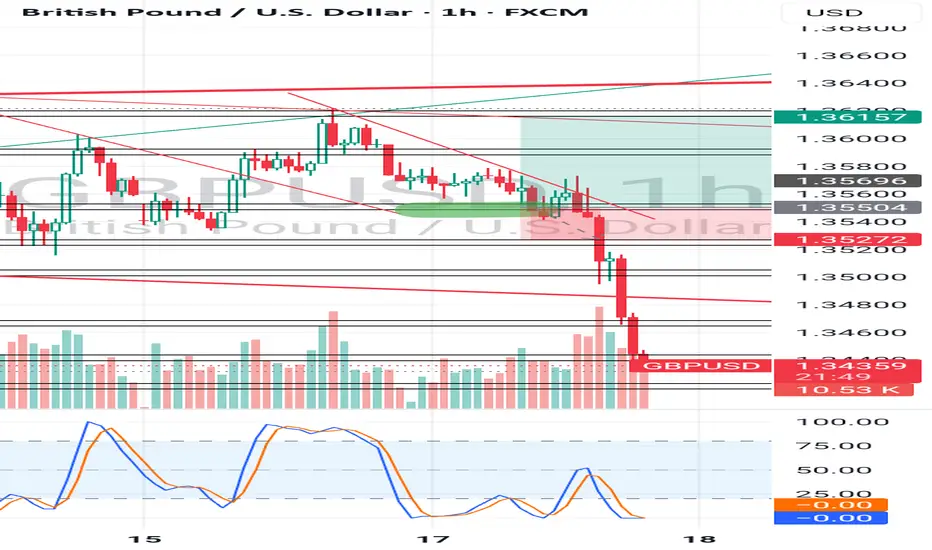
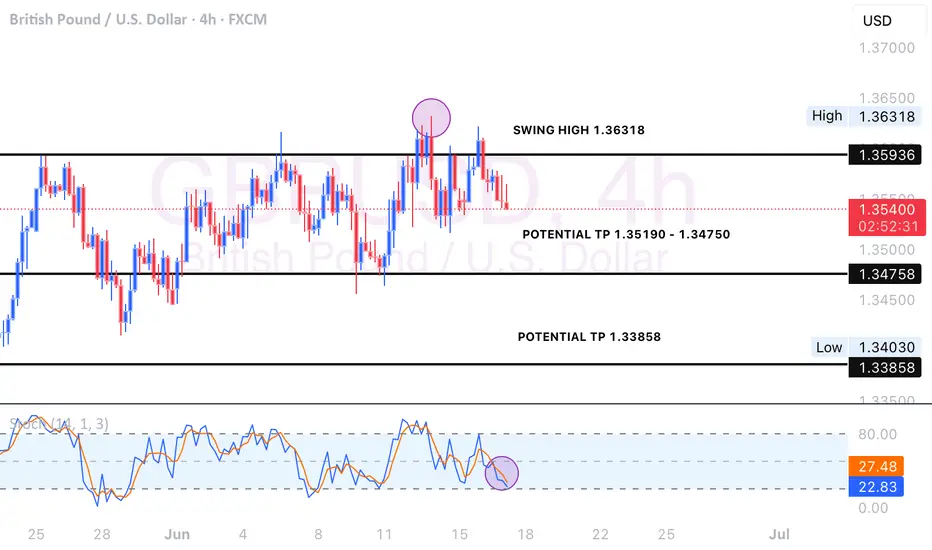
Why I Think GBPUSD Will Sell...Technical AnalysisHey Rich Friends,
I hope you're well today. I wanted to share why I think GBPUSD will sell today and maybe more this week. This is only my technical analysis so make sure you check the news and cross reference the indicators you have on your chart. This is what I am looking at:
- The market hit a swing high on 4H and has been creating lower highs.
- The momentum is picking up for the sellers based on candle bodies.
- The stochastic is facing down, the slow line (orange) is on top of the fast line (blue) and both lines have crossed below 50. These are bearish confirmations for me.
Additional information:
- Wait for the stochastic to cross below 20.
- Wait for a break of structure below 1.35320.
- I will be setting sell stops so that my trades trigger on the way down. I will set previous highs as my SL and previous lows as my TPs.
Good luck if you decide to take this trade!
Peace and Profits,
Cha
GBPUSD ANALYSIS AND TRADE We've been tapped into the trade for GBPUSD
Let's see how the market would react.
Trade just became active, you can still join in
#GBPUSD: Smaller Time-Frame Tells A Different Story! GBPUSD has exhibited strong bullish sentiment in shorter timeframes. However, an analysis of shorter timeframes reveals a different picture. The current price trend is upward, and it is anticipated to continue. Nevertheless, we anticipate a price correction around 1.3470, followed by a continuation of the bullish move. We strongly recommend conducting your own analysis before making any investment decisions.
Best of luck in your trading endeavours, and please remember to prioritise safety.
Kindly consider liking, commenting, and sharing this analysis for further insights.
Team Setupsfx_
GBPUSD Will Collapse! SELL!
My dear friends,
Please, find my technical outlook for GBPUSD below:
The price is coiling around a solid key level - 1.3619
Bias - Bearish
Technical Indicators: Pivot Points Low anticipates a potential price reversal.
Super trend shows a clear sell, giving a perfect indicators' convergence.
Goal - 1.3570
Safe Stop Loss - 1.3649
About Used Indicators:
The pivot point itself is simply the average of the high, low and closing prices from the previous trading day.
Disclosure: I am part of Trade Nation's Influencer program and receive a monthly fee for using their TradingView charts in my analysis.
———————————
WISH YOU ALL LUCK
Target hit Last post I talked about the bearish momentum which gbpusd had and how it will follow up the chart. I'm now done for the day, anticipate more sell till it reaches my buy zone
