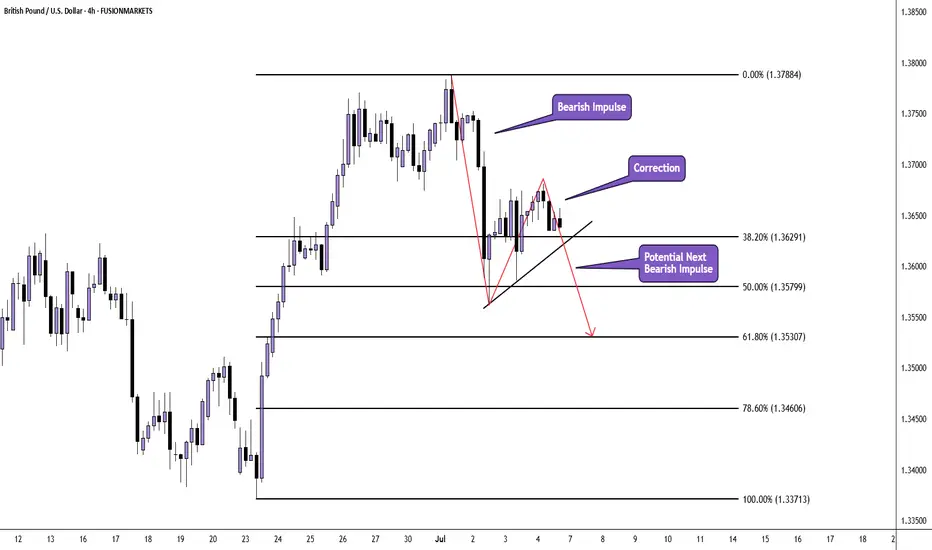
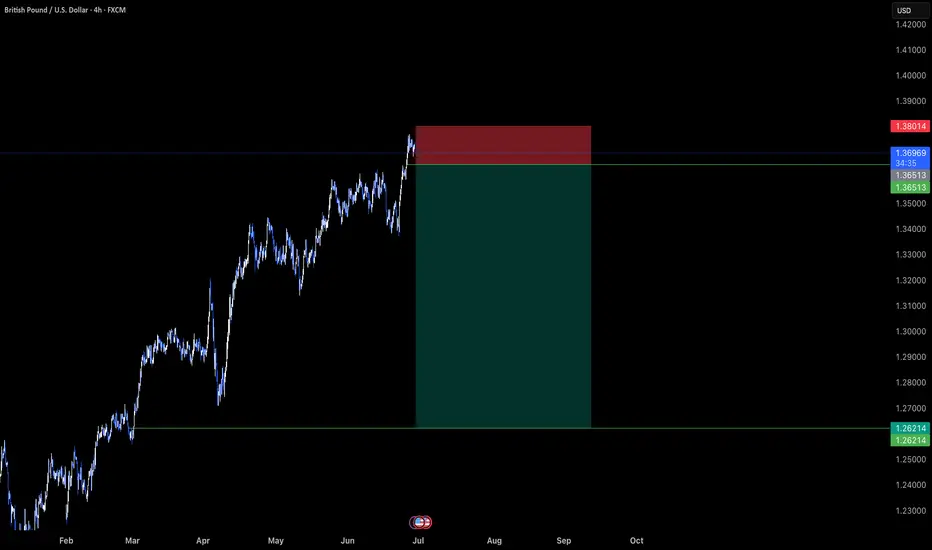
GBP/USD H4 AnlysisPrice appears to be correcting the huge bullish impulse move which originated on 23rd June 2025 and ended on 1st July 2025.
We have already seen an impulse from the sellers after price peaked at 1.37887 at the beginning of the month.
Current price action is taking the form of a correction and there is the potential of another move down.
If you agree with this analysis, look for a trade that meets your strategy rules.
GBPUSD trade ideas
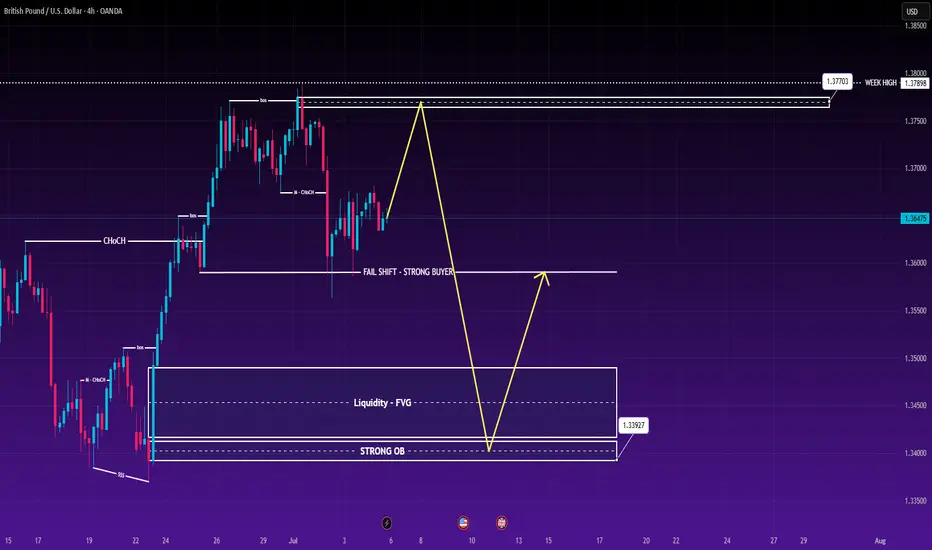
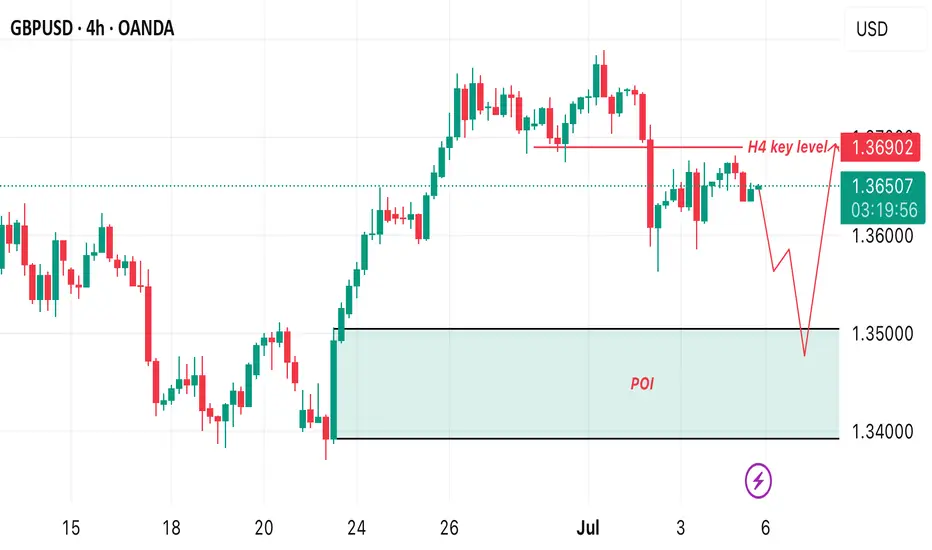
GBP/USD Weekly Plan – 8th to 12th July 2025The British Pound is testing the upper range of its recent rally, just below a high-liquidity supply zone near 1.37898. While short-term bullish momentum remains intact, both the technical structure and upcoming macro events point towards a potential midweek reversal.
📉 Technical Breakdown – H4 Chart
Price has completed a full impulsive leg and is approaching a key supply zone (1.37703–1.37898), aligning with weekly highs.
Previous CHoCH + BOS formations show buyer strength, but recent rejections indicate exhaustion.
Liquidity sits below at 1.35013 and 1.33927, making downside targets attractive for short setups.
🔁 Trade Setups
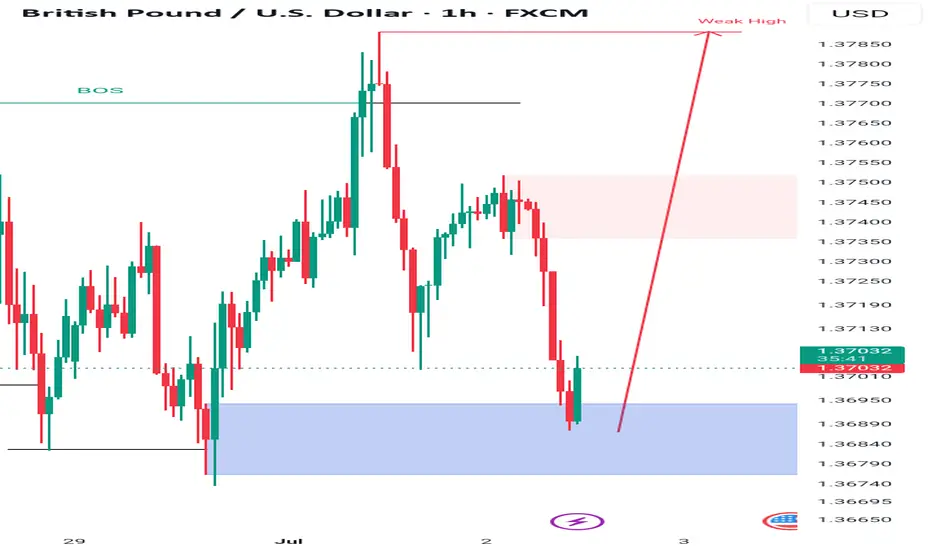
✅ SELL GBP/USD
Entry: 1.37703
Stop Loss: 1.38000
TP1: 1.37100
TP2: 1.36513
TP3: 1.35013
Rationale: Selling into weak high and potential liquidity trap. Expecting rejection from the top of the weekly range.
✅ BUY GBP/USD
Entry: 1.33927
Stop Loss: 1.33600
TP1: 1.34500
TP2: 1.35237
TP3: 1.36900
Rationale: Buying from a strong demand zone and order block with FVG confluence. Clean upside potential if market respects structure.
🧠 Macro Context – What to Watch
🇬🇧 GBP Drivers:
BOE Governor Bailey Speaks (Twice this week) – May offer clarity on future monetary stance.
🇺🇸 USD Drivers:
Fed Chair Powell Speaks – Markets watching for tone on rate path.
NFP Jobs Report (Friday) – Forecast: 147K. A strong figure could support USD.
Unemployment Claims / Rate – A key pair of metrics for short-term dollar moves.
🧩 A hawkish Fed tone + strong NFP = stronger USD → pressure on GBP/USD.
📊 Key Zones
Zone Role Notes
1.37898 Weekly High Strong resistance + sell-side liquidity trap
1.37703 Sell Entry Within supply zone
1.33927 Buy Entry Order block + FVG zone, ideal reversal zone
1.35013 Major Target Previous BOS zone and liquidity below structure
⚠️ Strategy Guidance
Wait for confirmations on H1–H4 (CHoCH / FVG rejection).
Avoid new positions 1 hour before or after red-folder events (e.g., NFP, Bailey speech).
Trailing SL recommended once TP1 is reached.
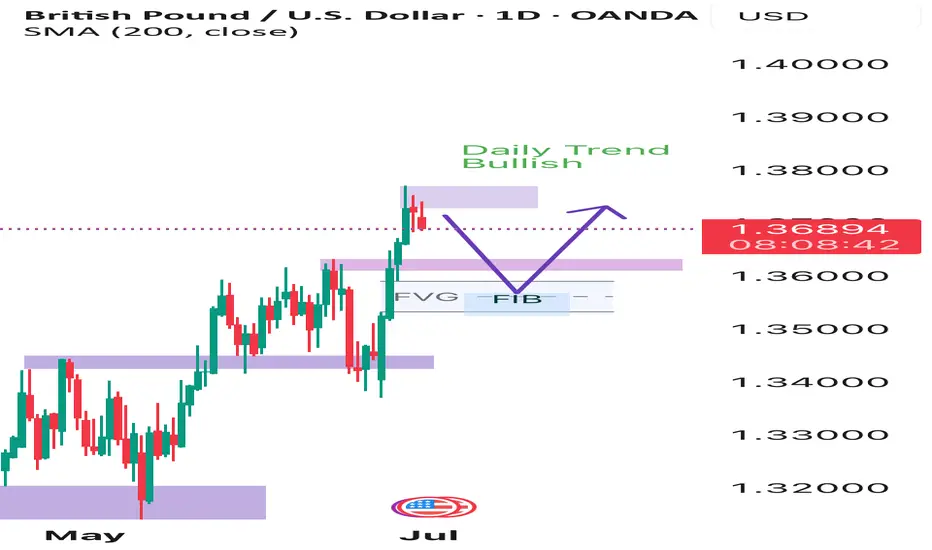
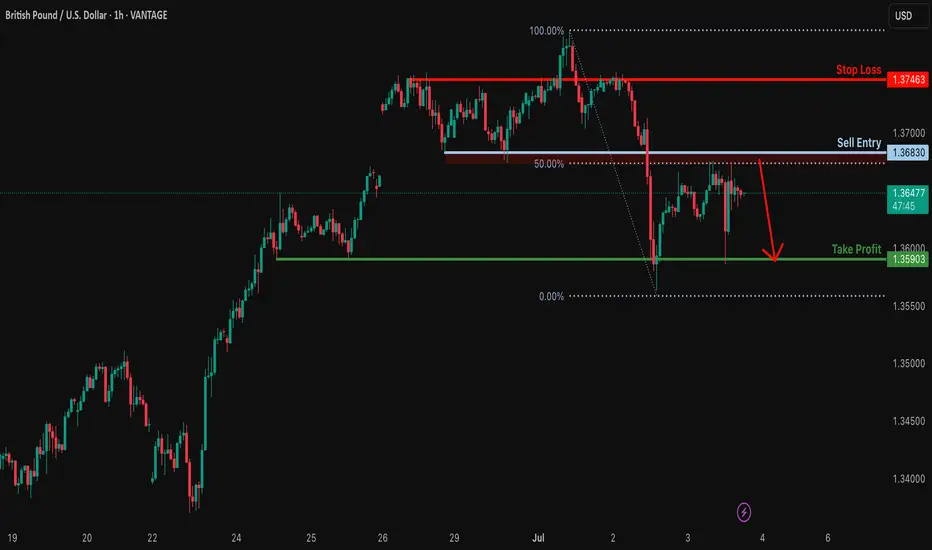
GBPUSD THIS WEEKGBPUSD this week going in level 61.8-70.2-79 or OTE and going for Sell in OB Daily.
RR 1:4 and Stoploss is above OB
Weekly hat 2 candle bearish and Daily it is Market structur shift for Bearish
Price going for retracment Fib and SELL
ALL this analysis its only my opinion not your to trade
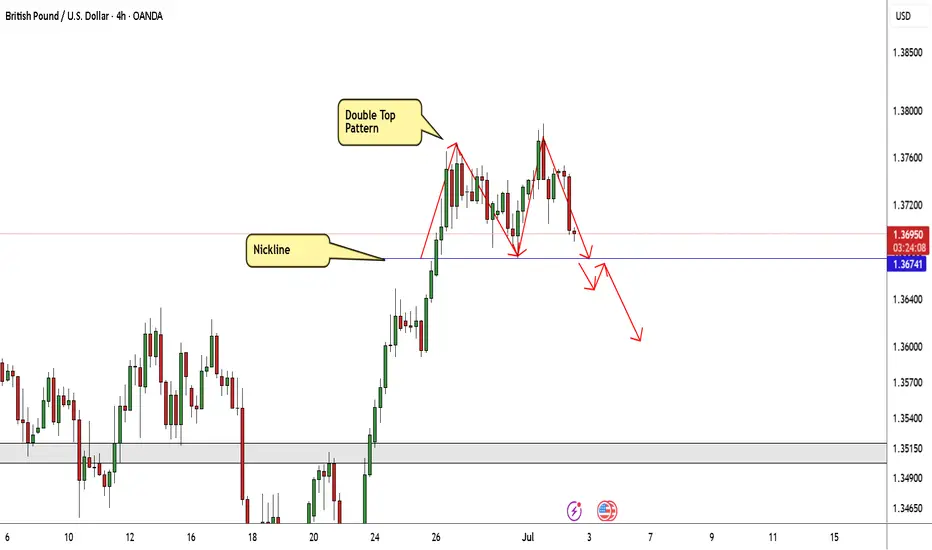
GBP/USD Made A Double Top Pattern , Short After Breakout ? Here is my opinion on GBP/USD 4H Chart , we have a reversal pattern ( Double Top ) but until now we have not a closure below neckline ,so i`m waiting for 4H Closure below it to confirm the pattern and hen we can sell it , if we have not a closure below then this idea will not be valid .
GBPUSD MARKET OUTLOOK!GBPUSD Price just dropped lower following the recent release in US NFP report. Therefore I anticipate a bullish price action to develop away from 1.3500 and 1.3400 level
We’re still looking forward to seeking more bullish price action developments
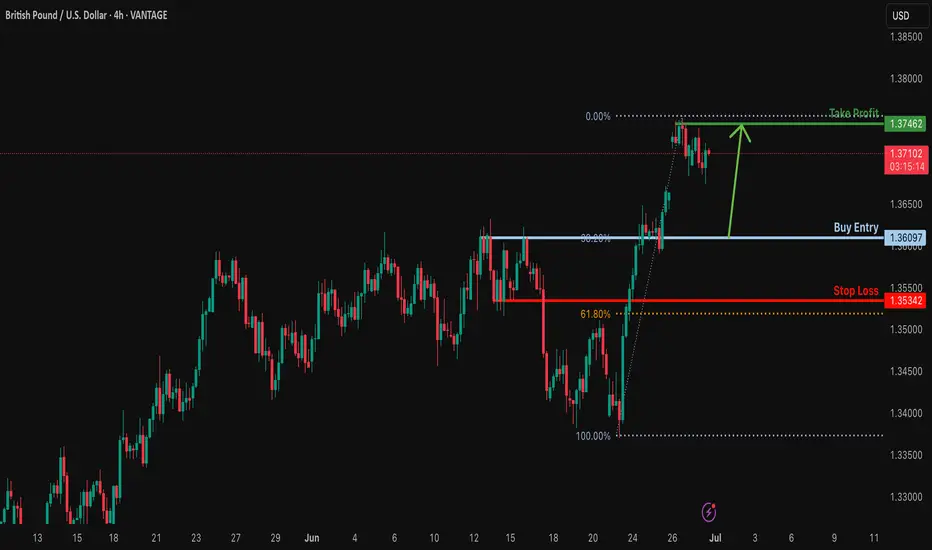
Bullish bouce off major support?GBP/USD has bounced off the support level which is an overlap support that lines up with the 38.2% Fibonacci retracement and could rise from this level to our take profit.
Pivot: 1.3609
Why we like it:
There is an overlap support level which lines up with the 38.2% Fibonacci retracement.
Stop loss: 1.3534
Why we like it:
There is a pullback support that is slightly above the 61.8% Fibonacci retracement.
Take profit: 1.3750
Why we like it:
There is a pullback resistance.
Enjoying your TradingView experience? Review us!
Please be advised that the information presented on TradingView is provided to Vantage (‘Vantage Global Limited’, ‘we’) by a third-party provider (‘Everest Fortune Group’). Please be reminded that you are solely responsible for the trading decisions on your account. There is a very high degree of risk involved in trading. Any information and/or content is intended entirely for research, educational and informational purposes only and does not constitute investment or consultation advice or investment strategy. The information is not tailored to the investment needs of any specific person and therefore does not involve a consideration of any of the investment objectives, financial situation or needs of any viewer that may receive it. Kindly also note that past performance is not a reliable indicator of future results. Actual results may differ materially from those anticipated in forward-looking or past performance statements. We assume no liability as to the accuracy or completeness of any of the information and/or content provided herein and the Company cannot be held responsible for any omission, mistake nor for any loss or damage including without limitation to any loss of profit which may arise from reliance on any information supplied by Everest Fortune Group.

DOLLAR DIPS AHEAD OF JOB REPORT, GBP/USD TECHNICAL OUTLOOK.Global markets rose on Wednesday, with the dollar hovering near a three-year low of 96, as investors considered the increasing likelihood of US interest rate reduction and the push for trade agreements ahead of President Donald Trump's July 9 tariff deadline.
Meanwhile on the radar, the U.S. official Job report would be on the wire later this week and as always, market participants would keenly pay attention to the reading which would give critical gauge of the labor market strength vis a vis the health of the economy. In view of the upcoming report, a strong report could reinforce confidence in the economy while a mixed print may reignite concerns over the slowing growth.
GBP/USD TECHNICAL OUTLOOK
GBP/USD tested 1.3788 on Tuesday, its highest level since 1st of November 2021(approximately 44 months). However, the bears struggled to push prices before the close of the day.
Looking at the daily chart, the broader market structure remains bullish with price bouncing off the trendline multiple times hence acting as a dynamic support.
The pair is currently retracing, with potential target towards 50 level of the Fib. at 1.3588 which would likely act as a minor support, whereas a break below the 50 level would likely usher sellers to the next potential target around 78.6 level of 1.3469. Meanwhile, a break below 1.3380 would mean absolute BOS and then would signal that bearish momentum has prevailed hence sellers would potentially target 1.3176.
On the flip side, if bulls regain control near the trendline or within the Fibonacci zones, the key upside target remains the previous high at 1.3788, followed by a push toward the psychological 1.3800 barrier according to analysts. Breakouts in either direction remain possible in the coming weeks, especially amid heightened volatility and key macroeconomic drivers.

Bearish drop?The Cable (GBP/USD) is reacting off the pivot and could drop to the 1st support.
Pivot: 1.3749
1st Support: 1.3684
1st Resistance: 1.3788
Risk Warning:
Trading Forex and CFDs carries a high level of risk to your capital and you should only trade with money you can afford to lose. Trading Forex and CFDs may not be suitable for all investors, so please ensure that you fully understand the risks involved and seek independent advice if necessary.
Disclaimer:
The above opinions given constitute general market commentary, and do not constitute the opinion or advice of IC Markets or any form of personal or investment advice.
Any opinions, news, research, analyses, prices, other information, or links to third-party sites contained on this website are provided on an "as-is" basis, are intended only to be informative, is not an advice nor a recommendation, nor research, or a record of our trading prices, or an offer of, or solicitation for a transaction in any financial instrument and thus should not be treated as such. The information provided does not involve any specific investment objectives, financial situation and needs of any specific person who may receive it. Please be aware, that past performance is not a reliable indicator of future performance and/or results. Past Performance or Forward-looking scenarios based upon the reasonable beliefs of the third-party provider are not a guarantee of future performance. Actual results may differ materially from those anticipated in forward-looking or past performance statements. IC Markets makes no representation or warranty and assumes no liability as to the accuracy or completeness of the information provided, nor any loss arising from any investment based on a recommendation, forecast or any information supplied by any third-party.

GBPUSD SELL 1.3762On the 4-hour chart, GBPUSD is currently oscillating. Currently, we can focus on the upper 1.3762 area, which is a potential short position of the bearish bat pattern, and this position is in the previous supply area.

Bearish reversal off pullback resistance?GBP/USD is rising towards the resistance level which is a pullback resistance that is slightly above the 50% Fibonacci retracement and could drop from this level to our take profit.
Entry: 1.3683
Why we like it:
There is a pullback resistance level that is slightly above the 50% Fibonacci retracement.
Stop loss: 1.3746
Why we like it:
There is a pullback resistance level.
Take profit: 1.3590
Why we like it:
There is a pullback support level.
Enjoying your TradingView experience? Review us!
Please be advised that the information presented on TradingView is provided to Vantage (‘Vantage Global Limited’, ‘we’) by a third-party provider (‘Everest Fortune Group’). Please be reminded that you are solely responsible for the trading decisions on your account. There is a very high degree of risk involved in trading. Any information and/or content is intended entirely for research, educational and informational purposes only and does not constitute investment or consultation advice or investment strategy. The information is not tailored to the investment needs of any specific person and therefore does not involve a consideration of any of the investment objectives, financial situation or needs of any viewer that may receive it. Kindly also note that past performance is not a reliable indicator of future results. Actual results may differ materially from those anticipated in forward-looking or past performance statements. We assume no liability as to the accuracy or completeness of any of the information and/or content provided herein and the Company cannot be held responsible for any omission, mistake nor for any loss or damage including without limitation to any loss of profit which may arise from reliance on any information supplied by Everest Fortune Group.
GBPUSD Bounced the Block — 1.3780 in Sight.Price is reacting off a strong support zone and the 200 EMA.
This move is also based on my expectation that upcoming U.S. data will come in weaker than forecasted, which should push USD lower and support GBP strength.
Target: 1.3780 📈
Let’s see how it plays out.

GBPUSD - OUTLOOK This is my technical perspective on GBPUSD.
Fundamentally expecting the Dollar to strengthen in the coming weeks
"May fortune attend thee, and thy trade prosper." .......L2Earned
Bearish reversal off 50% Fibonacci resistance?The Cable (GBP/USD) is rising towards the pivot and could drop to the 1st support.
Pivot: 1.3681
1st Support: 1.3595
1st Resistance: 1.3746
Risk Warning:
Trading Forex and CFDs carries a high level of risk to your capital and you should only trade with money you can afford to lose. Trading Forex and CFDs may not be suitable for all investors, so please ensure that you fully understand the risks involved and seek independent advice if necessary.
Disclaimer:
The above opinions given constitute general market commentary, and do not constitute the opinion or advice of IC Markets or any form of personal or investment advice.
Any opinions, news, research, analyses, prices, other information, or links to third-party sites contained on this website are provided on an "as-is" basis, are intended only to be informative, is not an advice nor a recommendation, nor research, or a record of our trading prices, or an offer of, or solicitation for a transaction in any financial instrument and thus should not be treated as such. The information provided does not involve any specific investment objectives, financial situation and needs of any specific person who may receive it. Please be aware, that past performance is not a reliable indicator of future performance and/or results. Past Performance or Forward-looking scenarios based upon the reasonable beliefs of the third-party provider are not a guarantee of future performance. Actual results may differ materially from those anticipated in forward-looking or past performance statements. IC Markets makes no representation or warranty and assumes no liability as to the accuracy or completeness of the information provided, nor any loss arising from any investment based on a recommendation, forecast or any information supplied by any third-party.

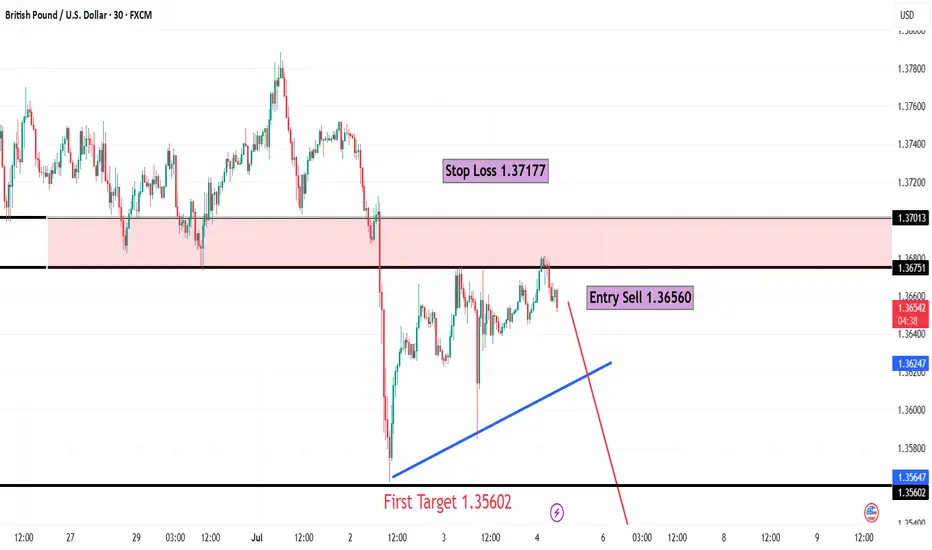
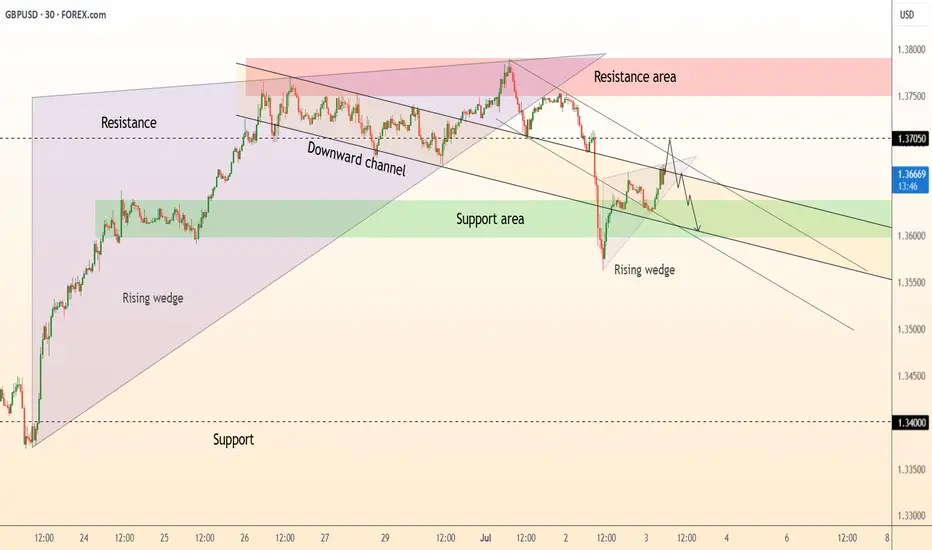
GBP/USD30 Mins Frame
🧠 Technical Overview:
Price is currently testing a strong resistance zone after a gradual upward movement, with signs of a potential bearish reversal.
A rising wedge pattern is forming — typically a bearish reversal pattern, especially if broken to the downside.
🧩 Key Technical Elements:
1. Supply Zone:
Defined between 1.3675 and 1.3717 — a previously strong resistance area.
Price is currently facing rejection within this zone, showing weakening bullish momentum.
2. Entry Point:
Sell at 1.36560, triggered by rejection from the resistance zone and a potential breakdown below the ascending support (blue line).
3. Stop Loss:
1.37177, placed above the supply zone — a logical level that invalidates the bearish setup if reached.
4. Targets:
First Target: 1.35602 – a clear previous support level and logical profit-taking zone.
Second Target: 1.34207 – a stronger, more significant support zone, likely to be tested if bearish momentum continues.
📉 Expected Price Action:
The chart shows a weak rising wedge pattern, indicating potential buyer exhaustion.
A break below the ascending trendline (blue) may trigger strong downside movement.
The expected move is illustrated with the red arrow on the chart, indicating a bearish trajectory.
🔥 Risk-to-Reward Ratio (R:R):
First Target:
Potential Reward: ~95 pips
Risk (SL): ~61 pips
→ R:R ≈ 1.56:1
Second Target:
Potential Reward: ~235 pips
→ R:R ≈ 3.85:1
✅ Very favorable, especially toward the second target.
✅ Conclusion:
The short setup is technically valid and supported by price structure and resistance confirmation.
The supply zone has proven strong, and price is struggling to break above it.
A solid trade opportunity for short- to medium-term traders with clearly defined risk and reward.
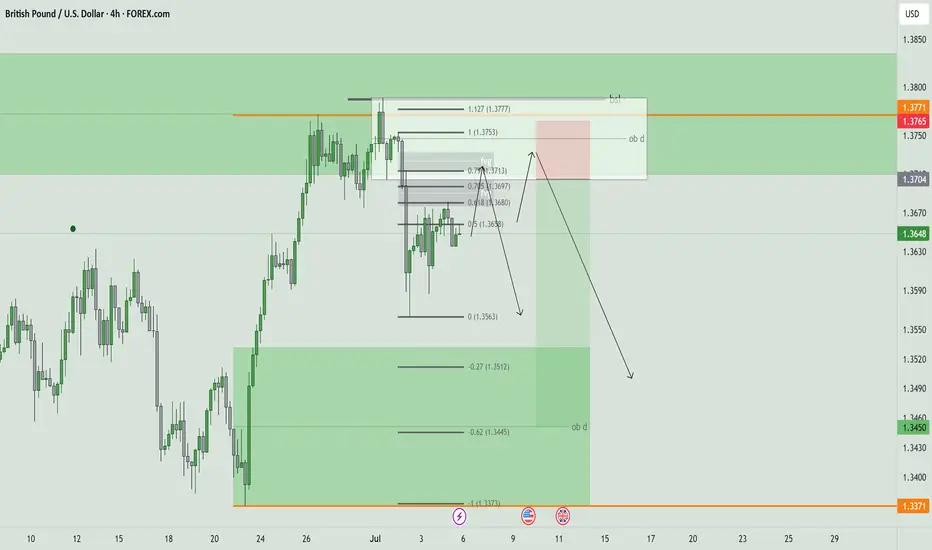
Trading Recommendation and Analysis for GBP/USDThe British pound is rising, but the accompanying Marlin oscillator is quite weak. Before the bulls are not just the desired targets - 1.3834, 1.3935, etc. - but also potential traps from which the bears could launch an unstoppable offensive.
On the daily chart, the trend remains upward, which is also confirmed by the Marlin oscillator breaking upward out of its own descending channel. However, there is also suspicion that this might be a trap - it may be a false breakout from the channel, similar to what occurred on May 12, when it was a breakout to the downside (highlighted by a yellow rectangle) .A trend reversal would occur if the price breaks below the support level at 1.3635, which is additionally reinforced by the MACD line.
On the four-hour chart, the price appears to be finishing a consolidation phase. During this consolidation, the Marlin oscillator has had time to decompress and prepare for further growth. As long as the trend remains intact the no signs of reversal appear, we expect the price to continue moving gradually upward.
Bearish drop?The Cable (GBP/USD) is reacting off the pivot and could drop to the 1st support.
Pivot: 1.3720
1st Support: 1.3648
1st Resistance: 1.3771
Risk Warning:
Trading Forex and CFDs carries a high level of risk to your capital and you should only trade with money you can afford to lose. Trading Forex and CFDs may not be suitable for all investors, so please ensure that you fully understand the risks involved and seek independent advice if necessary.
Disclaimer:
The above opinions given constitute general market commentary, and do not constitute the opinion or advice of IC Markets or any form of personal or investment advice.
Any opinions, news, research, analyses, prices, other information, or links to third-party sites contained on this website are provided on an "as-is" basis, are intended only to be informative, is not an advice nor a recommendation, nor research, or a record of our trading prices, or an offer of, or solicitation for a transaction in any financial instrument and thus should not be treated as such. The information provided does not involve any specific investment objectives, financial situation and needs of any specific person who may receive it. Please be aware, that past performance is not a reliable indicator of future performance and/or results. Past Performance or Forward-looking scenarios based upon the reasonable beliefs of the third-party provider are not a guarantee of future performance. Actual results may differ materially from those anticipated in forward-looking or past performance statements. IC Markets makes no representation or warranty and assumes no liability as to the accuracy or completeness of the information provided, nor any loss arising from any investment based on a recommendation, forecast or any information supplied by any third-party.
Falling towards pullback support?GBP?USD is falling towards the support level which is a pullback support that lines up with the 38.2% Fibonacci retracement and could drop from this level to our take profit.
Entry: 1.3609
Why we like it:
There is a pullback support level that lines up with the 38.2% Fibonacci retracement.
Stop loss: 1.3534
Why we like it:
There is a pullback support.
Take profit: 1.3746
Why we like it:
There is a pullback resistance.
Enjoying your TradingView experience? Review us!
Please be advised that the information presented on TradingView is provided to Vantage (‘Vantage Global Limited’, ‘we’) by a third-party provider (‘Everest Fortune Group’). Please be reminded that you are solely responsible for the trading decisions on your account. There is a very high degree of risk involved in trading. Any information and/or content is intended entirely for research, educational and informational purposes only and does not constitute investment or consultation advice or investment strategy. The information is not tailored to the investment needs of any specific person and therefore does not involve a consideration of any of the investment objectives, financial situation or needs of any viewer that may receive it. Kindly also note that past performance is not a reliable indicator of future results. Actual results may differ materially from those anticipated in forward-looking or past performance statements. We assume no liability as to the accuracy or completeness of any of the information and/or content provided herein and the Company cannot be held responsible for any omission, mistake nor for any loss or damage including without limitation to any loss of profit which may arise from reliance on any information supplied by Everest Fortune Group.
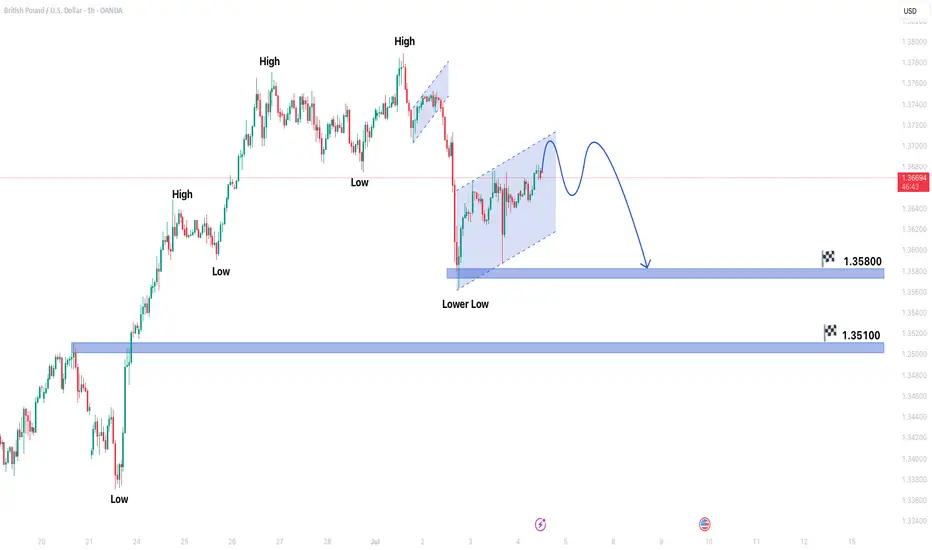
GBPUSD forming bearish trend in 1 hour time frameGBPUSD forming bearish trend in 1 hour time frame.
Market is forming lower low which shows indicates bearish trend.
Price is also forming Bearish flag pattern.
Market is expected to remain bearish in upcoming trading sessions.
On lower side market can hit the target levels of 1.35800 & 1.35100.
On higher side market may test the resistance level of 1.37900.
GBPUSDTake trade at a strong green candle and sell as per technical analysis. Profit should be as per price action
DeGRAM | GBPUSD will continue to correct📊 Technical Analysis
● Price retests the broken wedge-base & channel roof ≈ 1.370 inside a confluence resistance zone (pink). Lower-highs into this cap form a bear flag pointing toward 1.360.
● Intraday rising-wedge has already cracked; projected width and the broader descending channel intersect 1.352-1.355, reinforcing downside targets.
💡 Fundamental Analysis
● Softer UK PMI prices and pre-election caution keep BoE-cut probabilities elevated, while a stronger US JOLTS print plus hawkish FOMC minutes underpin the dollar, favouring renewed GBP/USD pressure.
✨ Summary
Fade rallies 1.368-1.372; slide below 1.360 unlocks 1.355 then 1.343. Bear thesis invalid on a 30 min close above 1.374.
-------------------
Share your opinion in the comments and support the idea with a like. Thanks for your support!
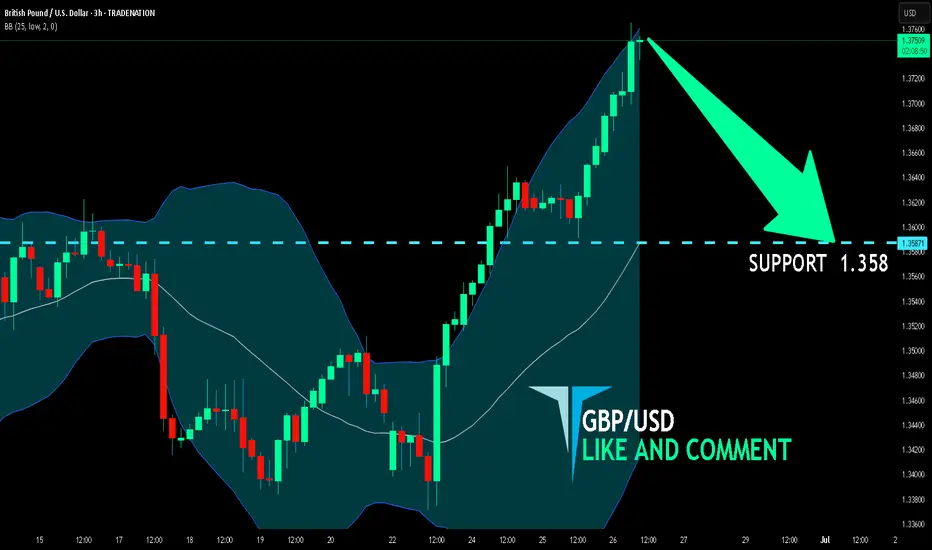
GBP/USD BEARS ARE STRONG HERE|SHORT
Hello, Friends!
GBP/USD pair is in the uptrend because previous week’s candle is green, while the price is clearly rising on the 3H timeframe. And after the retest of the resistance line above I believe we will see a move down towards the target below at 1.358 because the pair overbought due to its proximity to the upper BB band and a bearish correction is likely.
Disclosure: I am part of Trade Nation's Influencer program and receive a monthly fee for using their TradingView charts in my analysis.
✅LIKE AND COMMENT MY IDEAS✅
GBP/USD What do people’s think about my chart 😅 waiting for hourly to match daily trend before placing a trade