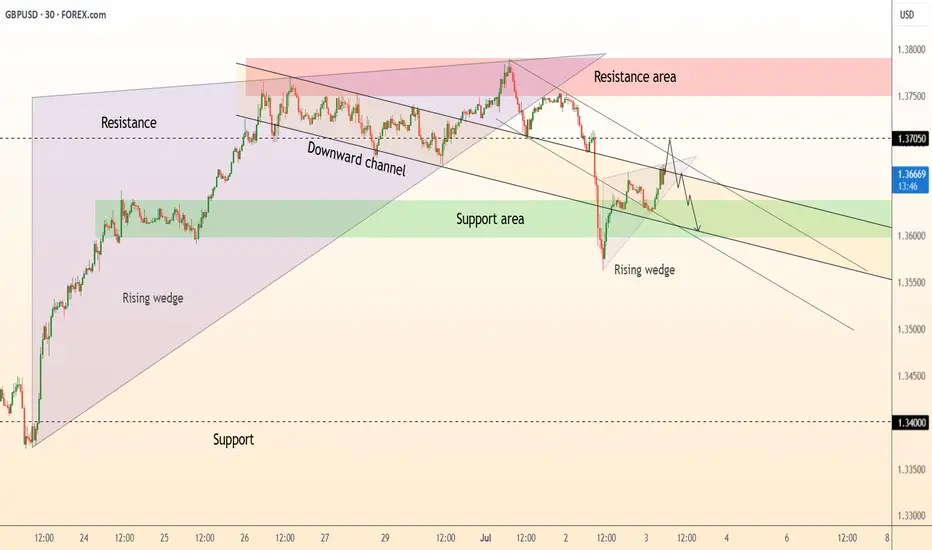
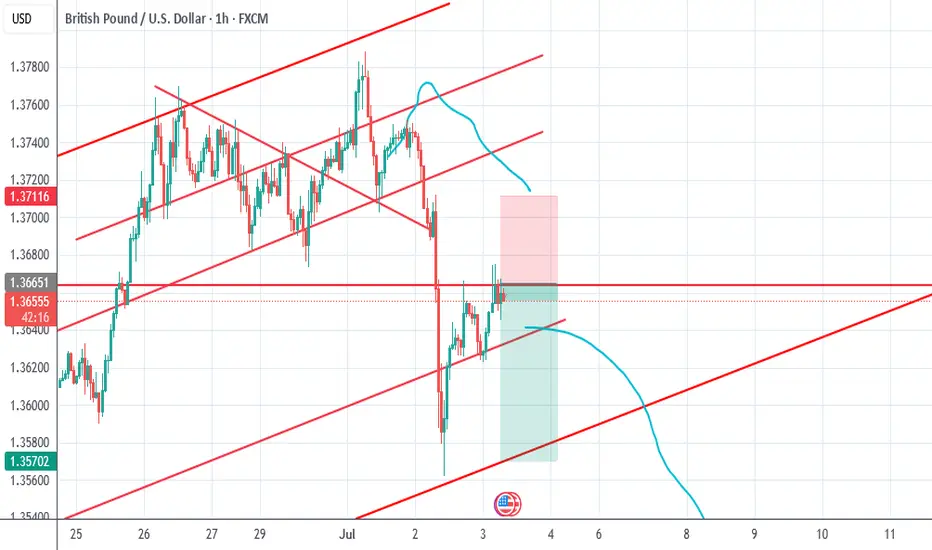
GBP/USD30 Mins Frame
🧠 Technical Overview:
Price is currently testing a strong resistance zone after a gradual upward movement, with signs of a potential bearish reversal.
A rising wedge pattern is forming — typically a bearish reversal pattern, especially if broken to the downside.
🧩 Key Technical Elements:
1. Supply Zone:
Defined between 1.3675 and 1.3717 — a previously strong resistance area.
Price is currently facing rejection within this zone, showing weakening bullish momentum.
2. Entry Point:
Sell at 1.36560, triggered by rejection from the resistance zone and a potential breakdown below the ascending support (blue line).
3. Stop Loss:
1.37177, placed above the supply zone — a logical level that invalidates the bearish setup if reached.
4. Targets:
First Target: 1.35602 – a clear previous support level and logical profit-taking zone.
Second Target: 1.34207 – a stronger, more significant support zone, likely to be tested if bearish momentum continues.
📉 Expected Price Action:
The chart shows a weak rising wedge pattern, indicating potential buyer exhaustion.
A break below the ascending trendline (blue) may trigger strong downside movement.
The expected move is illustrated with the red arrow on the chart, indicating a bearish trajectory.
🔥 Risk-to-Reward Ratio (R:R):
First Target:
Potential Reward: ~95 pips
Risk (SL): ~61 pips
→ R:R ≈ 1.56:1
Second Target:
Potential Reward: ~235 pips
→ R:R ≈ 3.85:1
✅ Very favorable, especially toward the second target.
✅ Conclusion:
The short setup is technically valid and supported by price structure and resistance confirmation.
The supply zone has proven strong, and price is struggling to break above it.
A solid trade opportunity for short- to medium-term traders with clearly defined risk and reward.
GBPUSD trade ideas
GBPUSD -SHort TGT 1.3464GBPUSD is expected to hit long. However the pair will retrace to 1.3464 before futher long move.
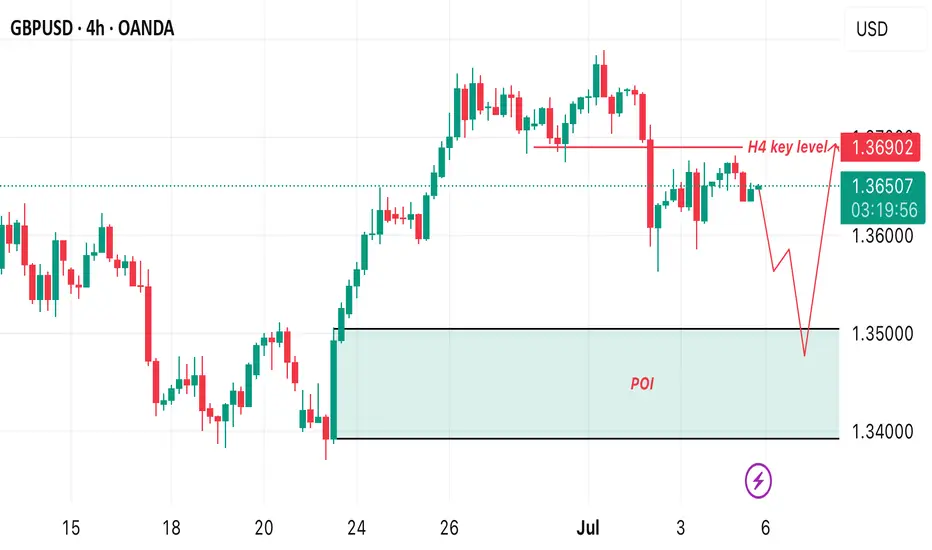
GBPUSD Chart Analysis & Scenarios✅ Bullish Breakout (if breaks 1.3666):
Target: 1.3680–1.3700
Confirmation: Price closes above resistance with strong volume
❌ Bearish Rejection (if rejected at 1.3637–1.3666):
Target: 1.3610, possibly 1.3588
Watch for: Bearish candlestick pattern at resistance + drop in volume
✅ Summary:
GBP/USD is recovering strongly but faces heavy resistance at 1.3637–1.3666.
Breakout above could open room toward 1.3700.
Rejection likely if momentum weakens near resistance, targeting previous lows.
GBPUSD BUY OPPORTUNITY Buy GBPUSD Now. It on key level
Entry: 1.35800
Stoploss: 1.35600
Take profit: 1.3700
Comment your opinion now.
For Fund Management Contact me on X @shajudeakinoba1
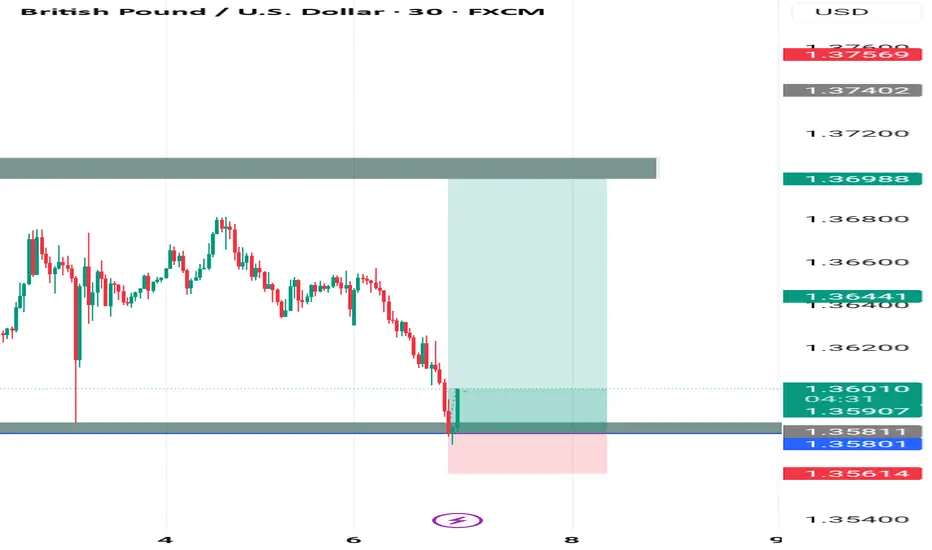
we wait patiently while eating graduallycheck my previous post to see a comprehensive explanation of why i took this trade in the first place

GBPUSD MARKET OUTLOOK!GBPUSD Price just dropped lower following the recent release in US NFP report. Therefore I anticipate a bullish price action to develop away from 1.3500 and 1.3400 level
We’re still looking forward to seeking more bullish price action developments
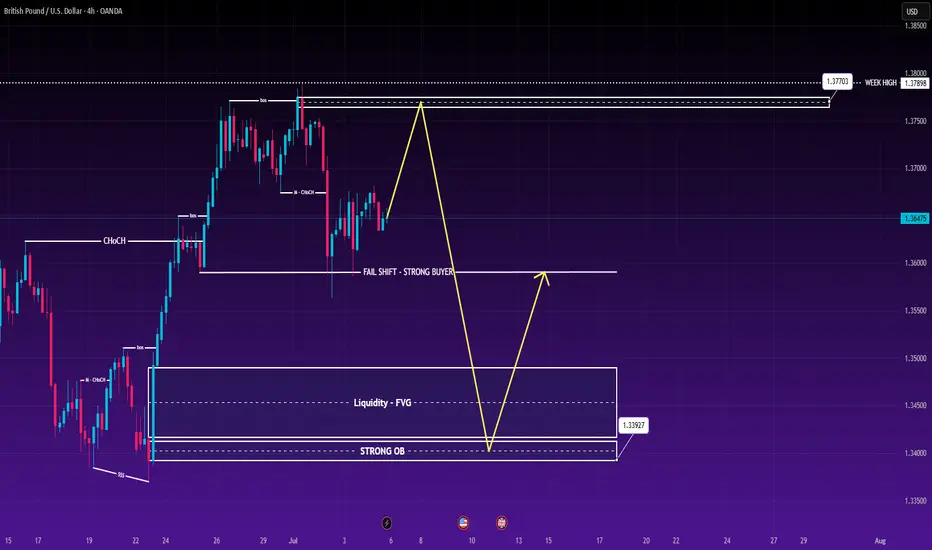
GBP/USD Weekly Plan – 8th to 12th July 2025The British Pound is testing the upper range of its recent rally, just below a high-liquidity supply zone near 1.37898. While short-term bullish momentum remains intact, both the technical structure and upcoming macro events point towards a potential midweek reversal.
📉 Technical Breakdown – H4 Chart
Price has completed a full impulsive leg and is approaching a key supply zone (1.37703–1.37898), aligning with weekly highs.
Previous CHoCH + BOS formations show buyer strength, but recent rejections indicate exhaustion.
Liquidity sits below at 1.35013 and 1.33927, making downside targets attractive for short setups.
🔁 Trade Setups
✅ SELL GBP/USD
Entry: 1.37703
Stop Loss: 1.38000
TP1: 1.37100
TP2: 1.36513
TP3: 1.35013
Rationale: Selling into weak high and potential liquidity trap. Expecting rejection from the top of the weekly range.
✅ BUY GBP/USD
Entry: 1.33927
Stop Loss: 1.33600
TP1: 1.34500
TP2: 1.35237
TP3: 1.36900
Rationale: Buying from a strong demand zone and order block with FVG confluence. Clean upside potential if market respects structure.
🧠 Macro Context – What to Watch
🇬🇧 GBP Drivers:
BOE Governor Bailey Speaks (Twice this week) – May offer clarity on future monetary stance.
🇺🇸 USD Drivers:
Fed Chair Powell Speaks – Markets watching for tone on rate path.
NFP Jobs Report (Friday) – Forecast: 147K. A strong figure could support USD.
Unemployment Claims / Rate – A key pair of metrics for short-term dollar moves.
🧩 A hawkish Fed tone + strong NFP = stronger USD → pressure on GBP/USD.
📊 Key Zones
Zone Role Notes
1.37898 Weekly High Strong resistance + sell-side liquidity trap
1.37703 Sell Entry Within supply zone
1.33927 Buy Entry Order block + FVG zone, ideal reversal zone
1.35013 Major Target Previous BOS zone and liquidity below structure
⚠️ Strategy Guidance
Wait for confirmations on H1–H4 (CHoCH / FVG rejection).
Avoid new positions 1 hour before or after red-folder events (e.g., NFP, Bailey speech).
Trailing SL recommended once TP1 is reached.
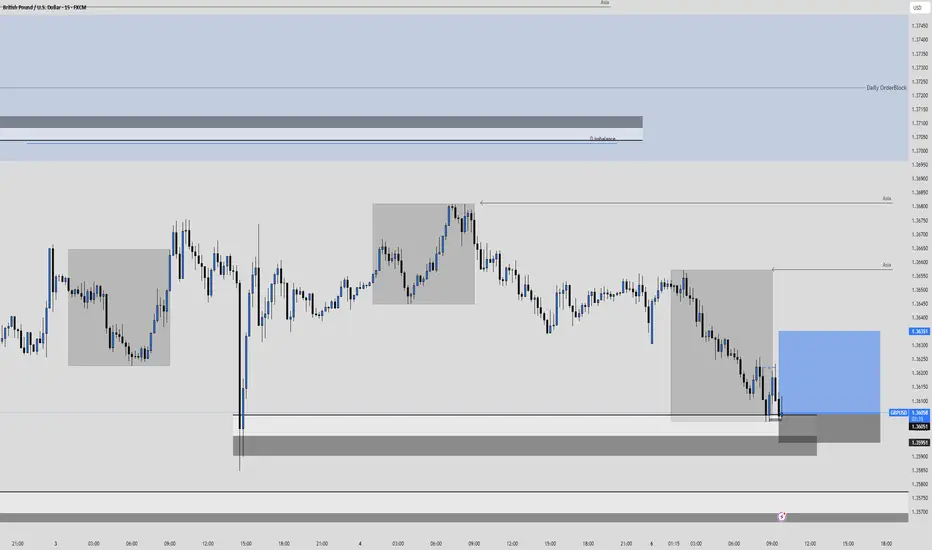
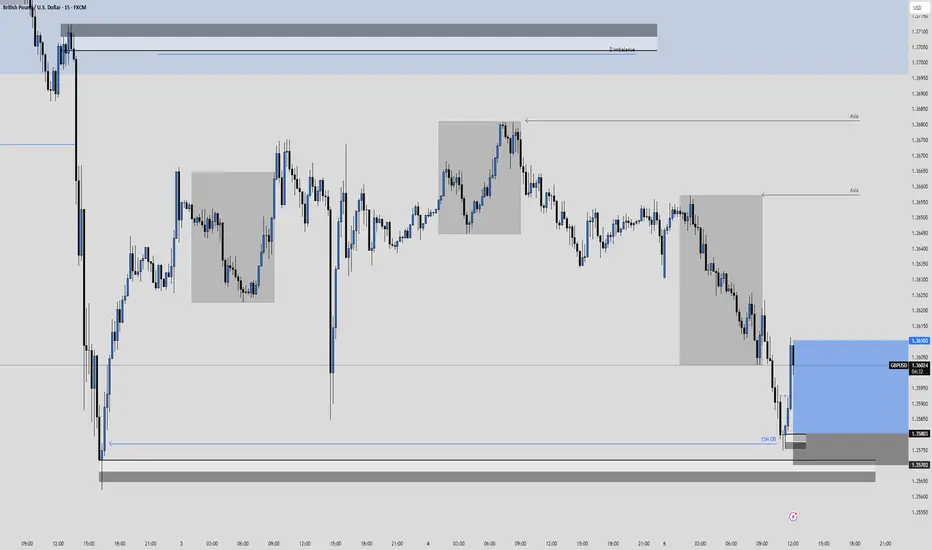
GBPUSD Long, 07 JulyAsia Fill Setup
This is a pure Asia Fill trade, backed by recent bullish LTF structure and a clean reaction from a 15m decisional OB. Although HTF isn’t perfectly aligned for longs, the momentum and intraday structure make this setup valid.
📍 Entry: 1m BOS from 15m OB, refined entry from 1m OB
📈 Confluence: Trend, structure, and Asia high as a clear target
🔁 Risk: SL doesn’t fully cover the OB, but BOS + clean reaction justifies the entry
🎯 Target: Asia High (1:3 RR), with BE secured quickly if price moves favorably
Not a perfect setup HTF-wise, but strong intraday alignment makes it worth the shot.
DeGRAM | GBPUSD will continue to correct📊 Technical Analysis
● Price retests the broken wedge-base & channel roof ≈ 1.370 inside a confluence resistance zone (pink). Lower-highs into this cap form a bear flag pointing toward 1.360.
● Intraday rising-wedge has already cracked; projected width and the broader descending channel intersect 1.352-1.355, reinforcing downside targets.
💡 Fundamental Analysis
● Softer UK PMI prices and pre-election caution keep BoE-cut probabilities elevated, while a stronger US JOLTS print plus hawkish FOMC minutes underpin the dollar, favouring renewed GBP/USD pressure.
✨ Summary
Fade rallies 1.368-1.372; slide below 1.360 unlocks 1.355 then 1.343. Bear thesis invalid on a 30 min close above 1.374.
-------------------
Share your opinion in the comments and support the idea with a like. Thanks for your support!
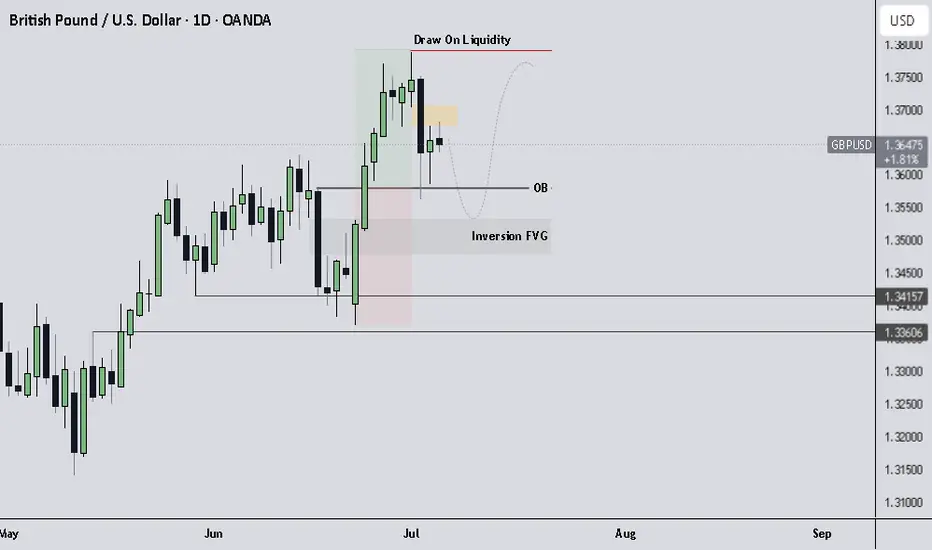
GBPUSD Outlook.Multi-Timeframe Context
Weekly Timeframe
Price is currently sitting on a weekly bullish Order Block (OB).
This higher timeframe demand zone provides the foundation for my bullish bias.
As long as price holds above this OB, I expect continuation to the upside.
🔹 Daily Timeframe
Dropping down to the Daily, we are currently hovering near the 50% level of the Daily dealing range.
Between 01/07/2025 and 03/07/2025, a clear Sell-side Imbalance Buy-side Inefficiency (SIBI) was formed.
This SIBI may act as a short-term bearish pressure, likely to cause a retracement.
📉 Short-Term Expectation
Expecting price to retrace lower, possibly into the midpoint of the Daily bullish OB, which aligns neatly with the Inversion Fair Value Gap (IFVG).
This would create a premium-to-discount transition, ideal for reaccumulation before a continuation move higher.
🔁 Support Array
Weekly OB = long-term bullish demand.
Daily OB midpoint + IFVG confluence = key re-entry or continuation area.
Watching for bullish confirmation once price rebalances through SIBI and taps deeper into discount.
🎯 Target Remains
Draw on Liquidity above 1.37800.
Ultimate target: 1.4000 psychological + structural level.
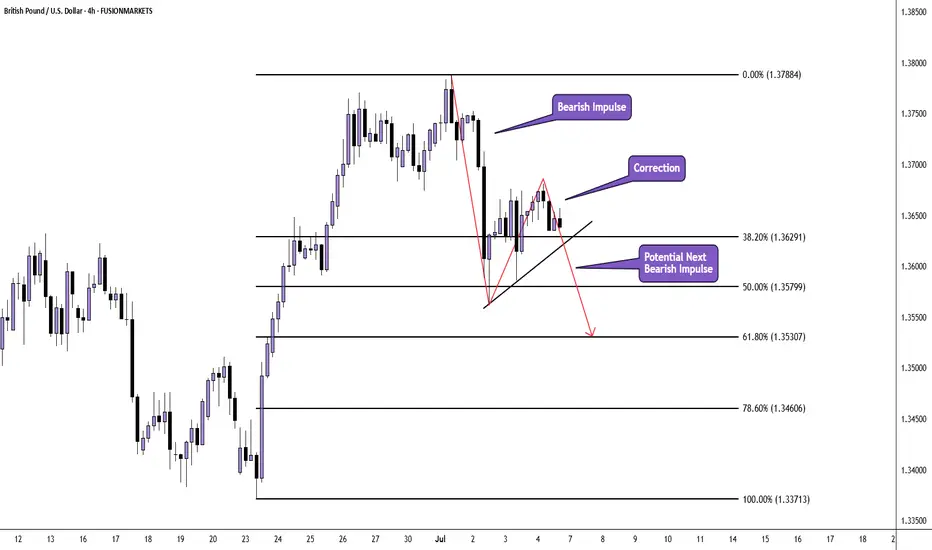
GBP/USD H4 AnlysisPrice appears to be correcting the huge bullish impulse move which originated on 23rd June 2025 and ended on 1st July 2025.
We have already seen an impulse from the sellers after price peaked at 1.37887 at the beginning of the month.
Current price action is taking the form of a correction and there is the potential of another move down.
If you agree with this analysis, look for a trade that meets your strategy rules.
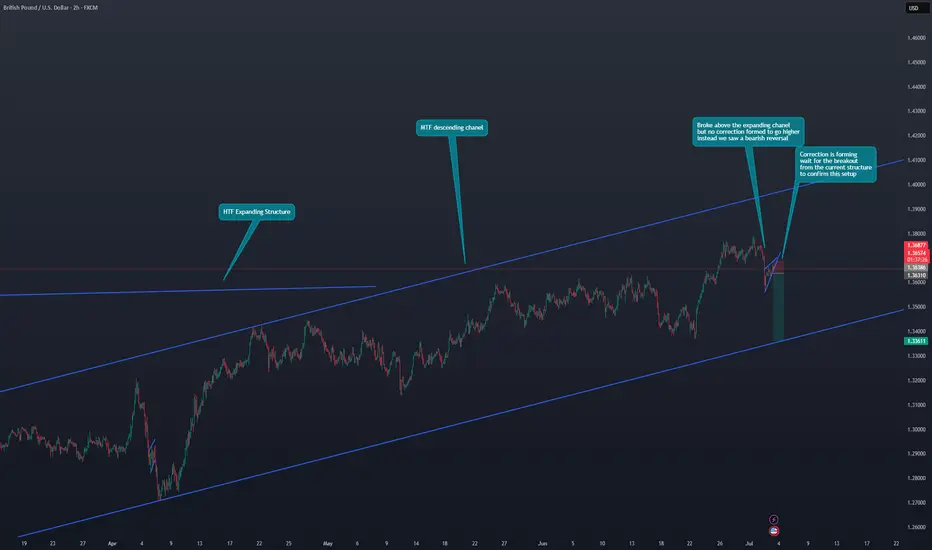
GBP/USD Sells incomingHi Traders!
1.HTF Expanding structure
2.MTF Asceding Chanel
3.False Breakout and LTF Reversal
4.LTF Continuation correction is forming
5.Wait for the breakout from the current structure to confirm this setup
GBPUSDTake trade at a strong green candle and sell as per technical analysis. Profit should be as per price action
GBPUSD Long Re-entry, 07 JulyAsia Fill & Volume-Based Setup
This is a momentum-driven long based on Asia Fill and a strong bullish shift on LTF, with clear DXY correlation. HTF doesn't offer major confluence, but intraday price action supports the idea.
📍 Entry: Waiting for a retest of the 5m OB left behind after a strong bullish move
📈 Confluence: 1m BOS + 15m Extreme OB + high buyer volume
🔁 Risk: Price may not return to 5m OB – if missed, it's a no-trade
🎯 Target: Asia high (but first 1:3 RR), quick BE if we catch the move
Clean setup with structure and volume in our favor – execution depends on retest.
Fundamental Market Analysis for July 7, 2025 GBPUSDEvents to pay atttenyion to today:
09:00 EET. GBP - Change in retail sales
GBPUSD:
The GBP/USD pair is starting the new week on a subdued note, fluctuating within a narrow range around the 1.3600 mark during the Asian session amid mixed fundamental signals.
The British pound (GBP) received some support last week after Prime Minister Keir Starmer said that Chancellor Rachel Reeves would remain in her post for the foreseeable future. However, the growing likelihood of a rate cut by the Bank of England (BoE) as early as August is having a negative impact on the GBP/USD pair. In fact, BoE Governor Andrew Bailey said that interest rates are moving downwards, while Monetary Policy Committee (MPC) member Alan Taylor called for faster rate cuts amid the risk of a hard landing for the British economy.
However, the decline in the GBP/USD pair is still being held back by the underlying bearish sentiment towards the US dollar (USD). Investors remain concerned that US President Donald Trump's sweeping bill to cut taxes and increase spending will lead to an explosion in the federal deficit and exacerbate the US's long-term debt problems. This, along with growing expectations that the Federal Reserve (Fed) will resume its cycle of rate cuts in the near future, is keeping the US dollar close to its February 2021 low.
Investors will therefore be closely studying the FOMC meeting minutes, which will be published on Wednesday, for clues about the Fed's rate cut path, which will stimulate demand for the US dollar and give a significant boost to the GBP/USD pair.
Trading recommendation: SELL 1.3620, SL 1.3640, TP 1.3520
GBPUSD overbought pullback support at 1.3544The GBPUSD remains in a bullish trend, with recent price action showing signs of a corrective pullback within the broader uptrend.
Support Zone: 1.3544 – a key level from previous consolidation. Price is currently testing or approaching this level.
A bullish rebound from 1.3544 would confirm ongoing upside momentum, with potential targets at:
1.3770 – initial resistance
1.3830 – psychological and structural level
1.3890 – extended resistance on the longer-term chart
Bearish Scenario:
A confirmed break and daily close below 1.3544 would weaken the bullish outlook and suggest deeper downside risk toward:
1.3500 – minor support
1.3440 – stronger support and potential demand zone
Outlook:
Bullish bias remains intact while the FTSE holds above 1.3544. A sustained break below this level could shift momentum to the downside in the short term.
This communication is for informational purposes only and should not be viewed as any form of recommendation as to a particular course of action or as investment advice. It is not intended as an offer or solicitation for the purchase or sale of any financial instrument or as an official confirmation of any transaction. Opinions, estimates and assumptions expressed herein are made as of the date of this communication and are subject to change without notice. This communication has been prepared based upon information, including market prices, data and other information, believed to be reliable; however, Trade Nation does not warrant its completeness or accuracy. All market prices and market data contained in or attached to this communication are indicative and subject to change without notice.
GBP/USD Pair Analysis📈 GBP/USD Pair Analysis – Monday, July 7, 2025
1️⃣ The pair is moving within an ascending price channel, indicating a continued positive trend in the medium term.
2️⃣ Strong demand areas have been identified on the larger time frames, which are expected to support the price in the event of a decline to these areas.
3️⃣ The MACD indicator is oversold, increasing the possibility of a rebound and upward movement from the current or nearby areas.
📌 Summary and Recommendations:
🔹 General Trend: Upward
🔸 The price is currently making a temporary downward correction.
✅ We expect the pair to rise again towards the upper limit of the price channel, provided it holds above the specified demand areas.
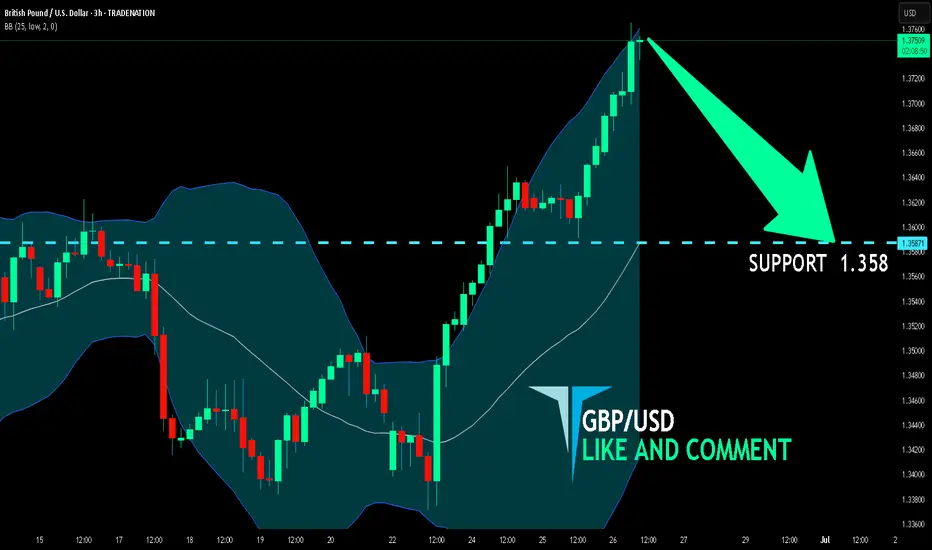
GBP/USD BEARS ARE STRONG HERE|SHORT
Hello, Friends!
GBP/USD pair is in the uptrend because previous week’s candle is green, while the price is clearly rising on the 3H timeframe. And after the retest of the resistance line above I believe we will see a move down towards the target below at 1.358 because the pair overbought due to its proximity to the upper BB band and a bearish correction is likely.
Disclosure: I am part of Trade Nation's Influencer program and receive a monthly fee for using their TradingView charts in my analysis.
✅LIKE AND COMMENT MY IDEAS✅
GBPUSD SetupWould take a sell once price gets to my POI, make sure you make your own Research's before entering.
GBPUSD - OUTLOOK This is my technical perspective on GBPUSD.
Fundamentally expecting the Dollar to strengthen in the coming weeks
"May fortune attend thee, and thy trade prosper." .......L2Earned
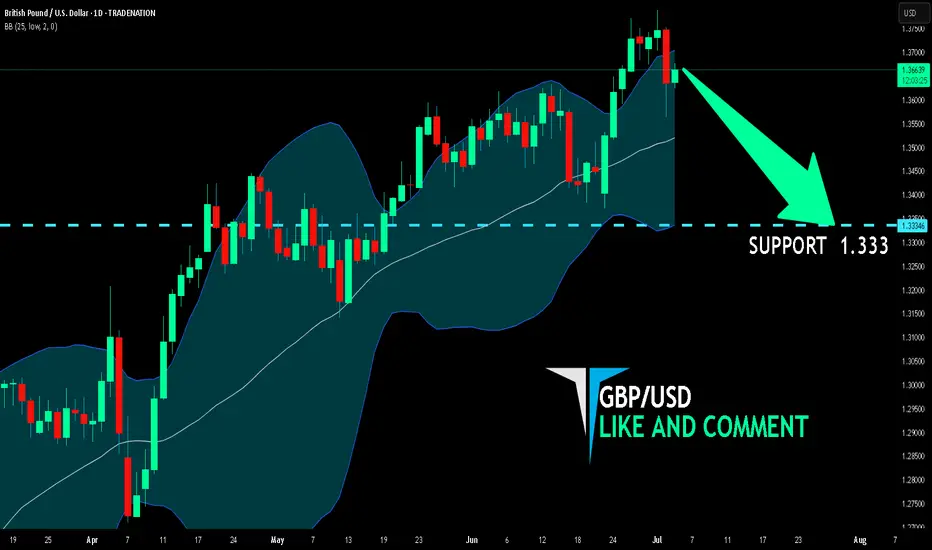
GBP/USD BEARISH BIAS RIGHT NOW| SHORT
Hello, Friends!
GBP/USD pair is in the downtrend because previous week’s candle is red, while the price is obviously rising on the 1D timeframe. And after the retest of the resistance line above I believe we will see a move down towards the target below at 1.333 because the pair is overbought due to its proximity to the upper BB band and a bearish correction is likely.
Disclosure: I am part of Trade Nation's Influencer program and receive a monthly fee for using their TradingView charts in my analysis.
✅LIKE AND COMMENT MY IDEAS✅
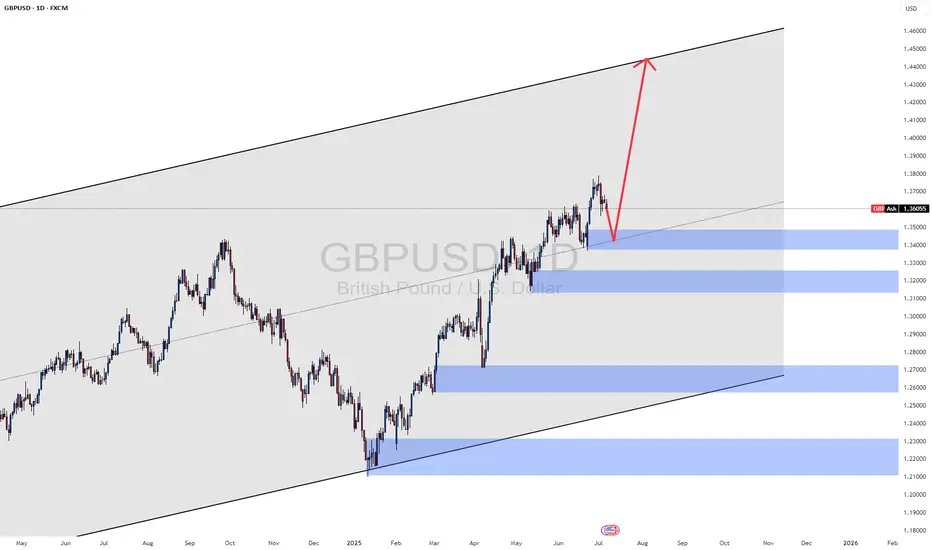
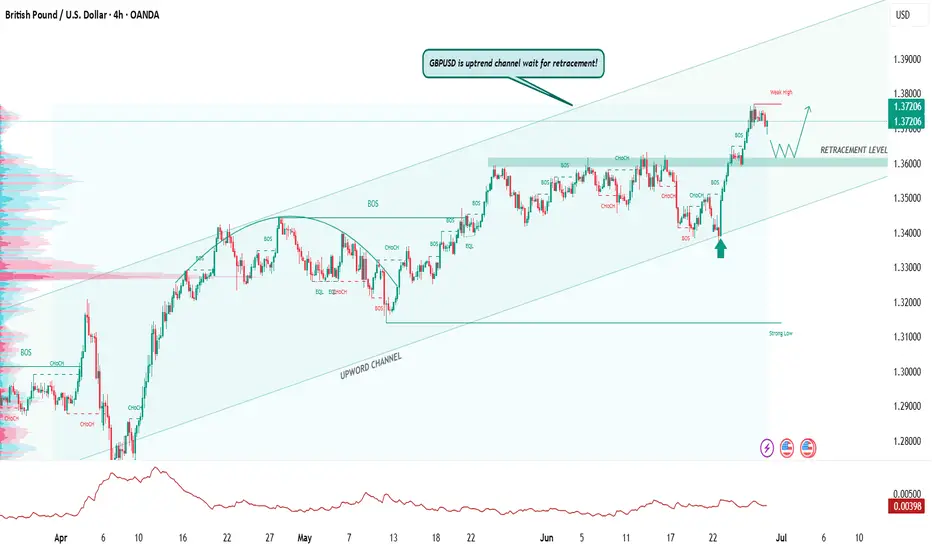
GBP/USD – Uptrend Channel Analysis!GBP/USD is trading inside a strong uptrend channel on the 4-hour chart.
Recent price action confirmed a Break of Structure (BOS), signaling solid bullish control.
Buyers have pushed price firmly above previous resistance zones.
Price is now near the upper boundary of the channel.
Signs of short-term exhaustion suggest a likely retracement ahead.
A pullback into the retracement level or channel midline would offer better risk-reward.
Key Levels to Watch:
Channel support for potential bounce.
Retracement zone as a buy opportunity.
Trade Plan:
Wait for a clean retracement toward support.
Look for bullish confirmation before entering long.
Avoid chasing highs – focus on discounted entries.
Bias: Bullish while price holds the uptrend channel structure.
Expect continuation after healthy correction.
Patience is critical – let the market set up a quality entry.
Traders should align with the dominant trend and manage risk carefully.
Like, comment, share, and follow for more trading ideas.
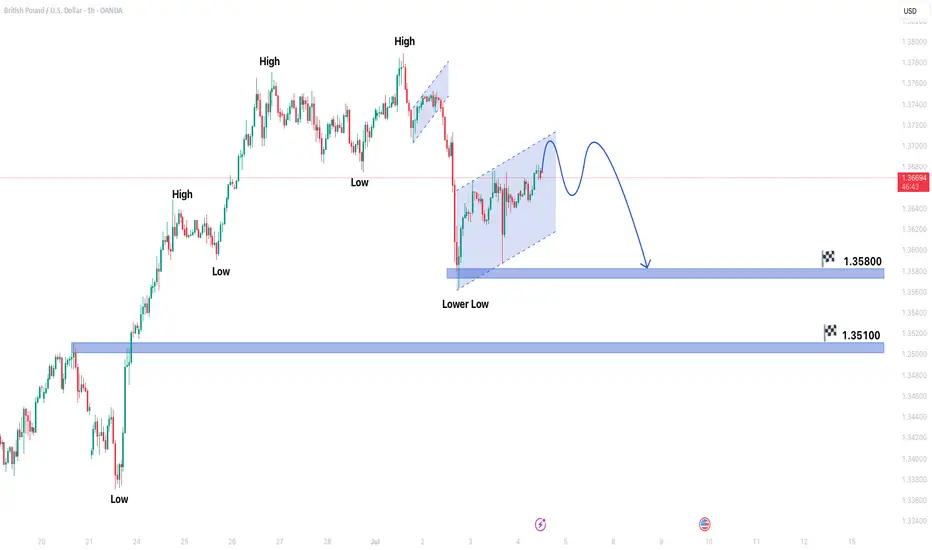
GBPUSD forming bearish trend in 1 hour time frameGBPUSD forming bearish trend in 1 hour time frame.
Market is forming lower low which shows indicates bearish trend.
Price is also forming Bearish flag pattern.
Market is expected to remain bearish in upcoming trading sessions.
On lower side market can hit the target levels of 1.35800 & 1.35100.
On higher side market may test the resistance level of 1.37900.