As we look ahead, several key economic events could impact the GBPUSD market. Notably, the upcoming Non-Farm Payrolls (NFP) report is scheduled for release next week. This report provides critical insights into the U.S. labor market, and any significant deviation from expectations could lead to increased volatility in the USD and subsequently affect the GBPUSD pair.
Additionally, keep an eye on the Consumer Price Index (CPI) data, which is set to be released later this month. Inflation data is crucial for the Federal Reserve's monetary policy decisions, and any indication of rising inflation could strengthen the USD against the GBP.
Traders should remain vigilant and prepare for potential market movements as these economic indicators are released. Monitoring both technical and fundamental factors will provide a comprehensive approach to navigating the GBPUSD market effectively.
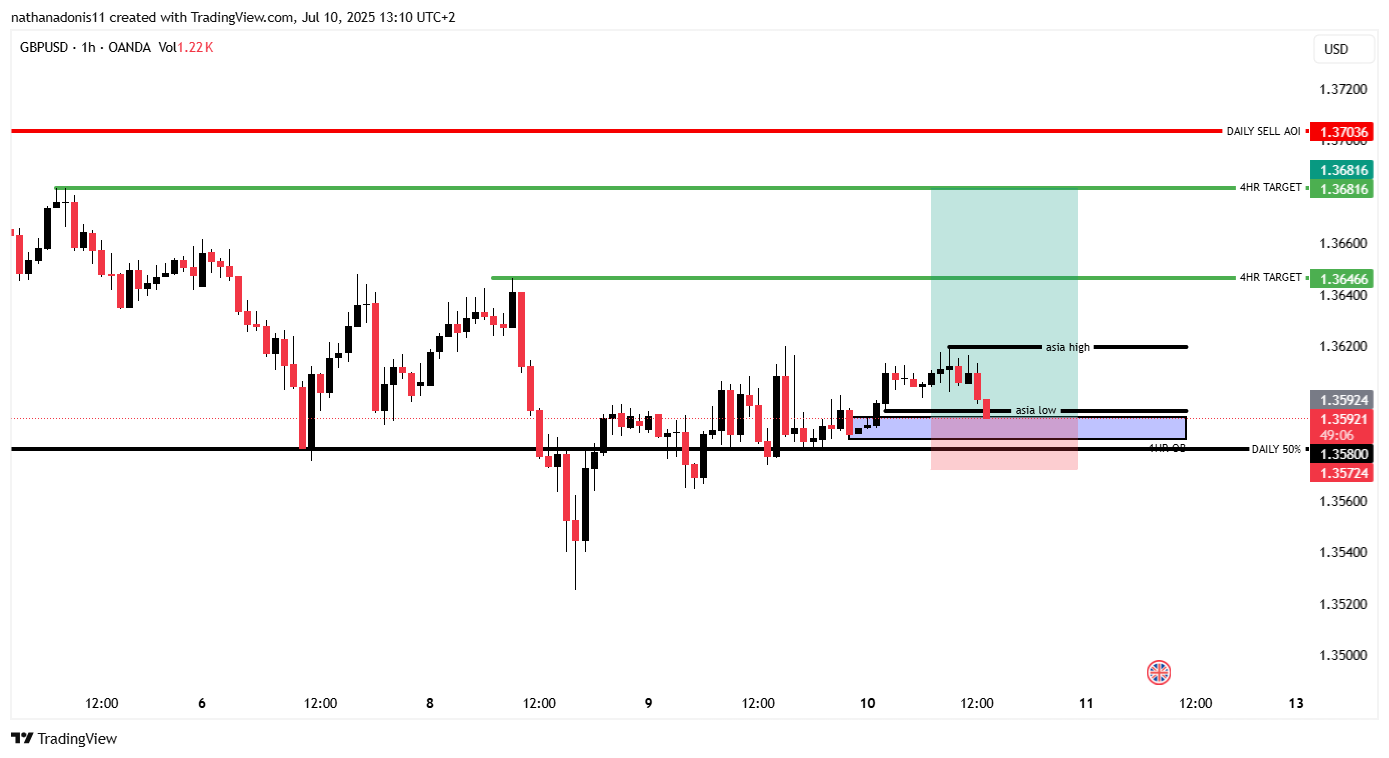
As of the latest update, the GBPUSD pair is trading at 1.36054 USD. This analysis delves into the current market dynamics, utilizing a variety of technical indicators across daily and 4-hour time frames. We will explore key support and resistance levels, Fibonacci retracement levels, Exponential Moving Averages (EMAs), RSI divergence, order blocks, and MACD indicators. Understanding these elements will provide traders with insights into potential market movements and strategies.
Technical Analysis
Support & Resistance Levels
Daily Time Frame
Support Levels:
1.35254: This level represents the recent swing low and acts as a significant support zone. 1.35800: A psychological level where buyers may step in. 1.35500: Another potential support level that aligns with previous price action.
Resistance Levels:
1.37888: The recent swing high, a crucial resistance level for the pair. 1.37000: A psychological resistance level that traders often monitor. 1.36500: A minor resistance level that could act as a barrier for upward movement.
4-Hour Time Frame
Support Levels:
1.35850: A recent support level observed in the 4-hour chart. 1.35600: A level where price action has shown signs of bouncing back. 1.35400: A lower support level that may come into play if the market declines.
Resistance Levels:
1.36200: A resistance level that has previously halted upward momentum. 1.36650: Another notable resistance level where sellers may emerge. 1.37100: A key resistance level that aligns with higher time frame analysis.
Fibonacci Retracement Levels
Using the swing high of 1.37888 and swing low of 1.35254, we can derive the Fibonacci retracement levels:
These levels are crucial as they indicate potential reversal points, particularly when combined with other indicators.
Exponential Moving Averages (EMA)
Daily Time Frame
EMA 50: 1.36240 EMA 100: 1.36000 EMA 200: 1.35800 EMA 400: 1.35500
The EMAs on the daily time frame indicate a bullish trend as the price is currently above these averages, suggesting a potential continuation of upward momentum.
4-Hour Time Frame
EMA 50: 1.35900 EMA 100: 1.35750 EMA 200: 1.35580 EMA 400: 1.35400
On the 4-hour chart, the EMAs are closely aligned, indicating consolidation. The proximity of these averages suggests that the market may be preparing for a breakout.
RSI Divergence
The Relative Strength Index (RSI) is currently at 55, indicating that the market is neither overbought nor oversold. However, observing a divergence between price and RSI may provide insights into potential reversals. If the price makes a higher high while the RSI fails to do so, it could signal a weakening bullish momentum.
Order Blocks
Identifying order blocks helps traders understand where institutional buying or selling has occurred. On the daily chart, a significant order block is located around 1.35800. This area could serve as a support zone, while the order block around 1.37500 could act as a resistance zone.
MACD Analysis
The MACD (Moving Average Convergence Divergence) indicator is currently showing a bullish crossover, which suggests that upward momentum may continue in the short term. Traders should monitor this indicator closely, as a shift back to bearish territory could indicate a potential reversal.