Coinbase ATHHello
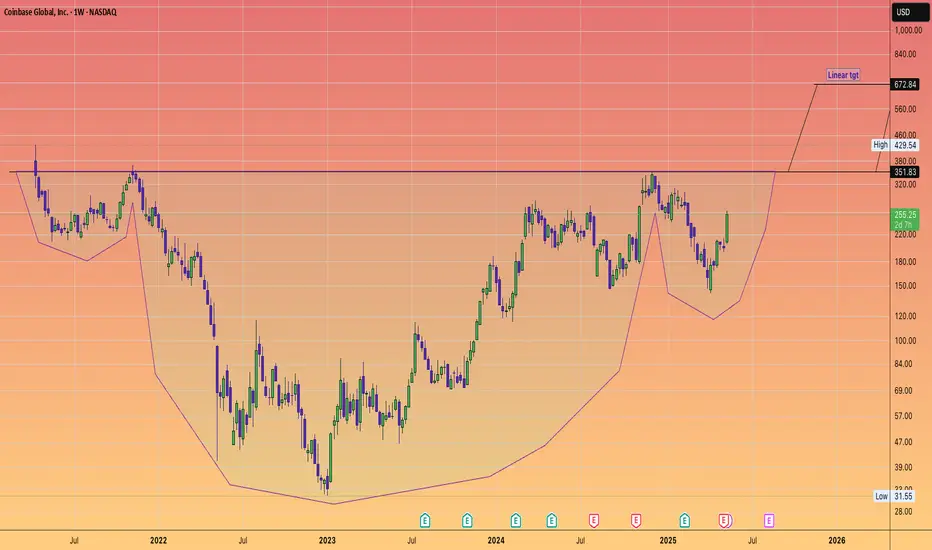
Regarding the real opportunity for COIN to reach all-time highs — look at the megaphone, it’s happening.
On the technical side: monthly bullish breaker, heavily manipulated. Price flipped the equilibrium and is now expanding toward the first level of algorithmic targets
NFA
1QZ trade ideas
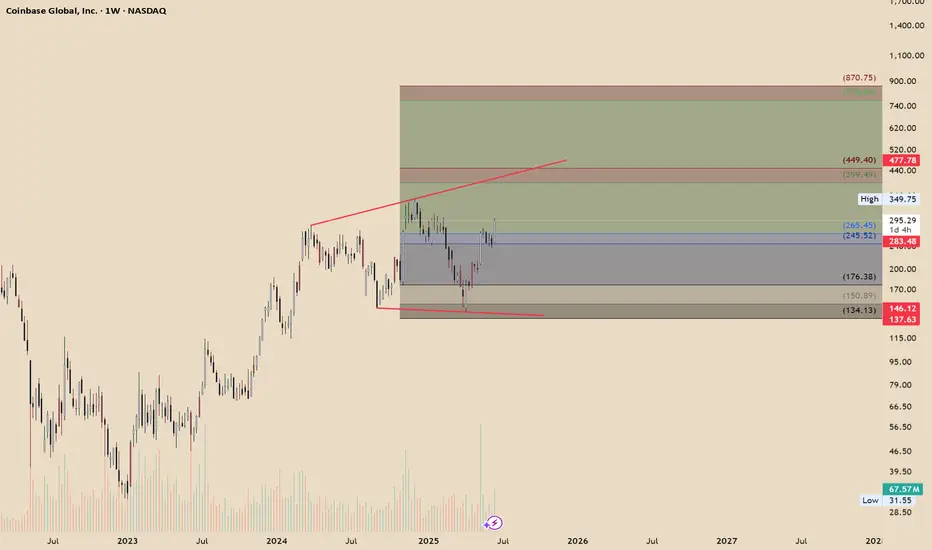
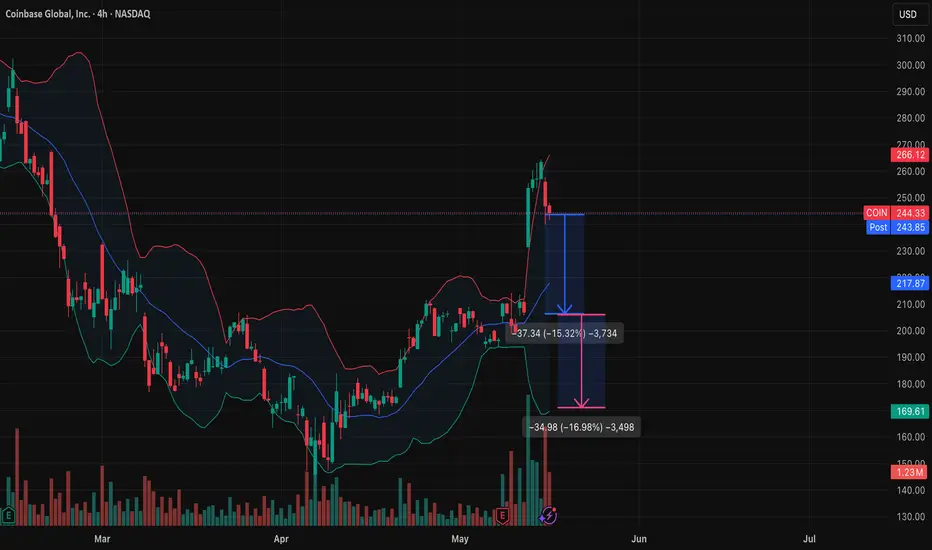
$COIN 30% Pullback Confirms if we Fakeout Recent 15%+ Rally 🧨 COIN SHORT TRADE IDEA — FAKEOUT TRAP IN PLAY
Ticker: NASDAQ:COIN
Date: June 20, 2025
Thesis: Breakout trap setup — expecting a rug pull / red reversal tomorrow to confirm.
🔍 Context
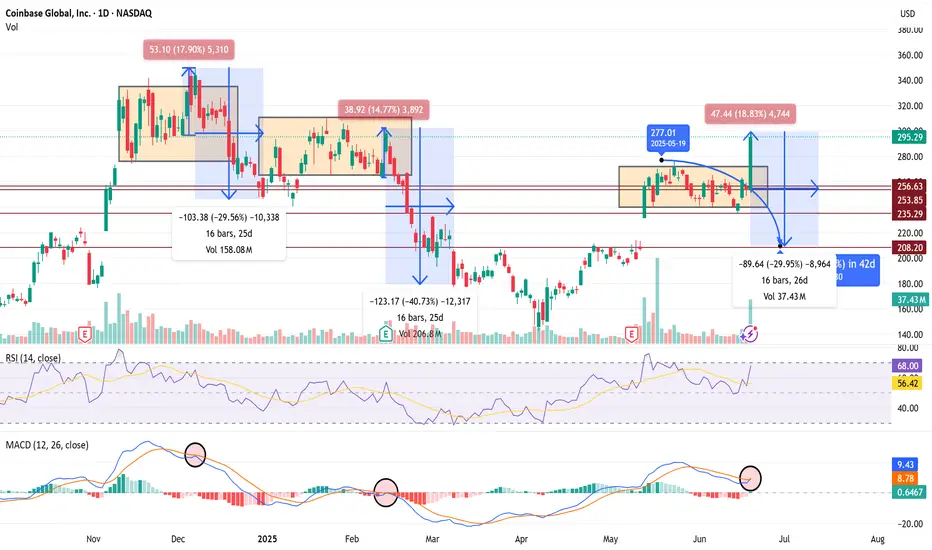
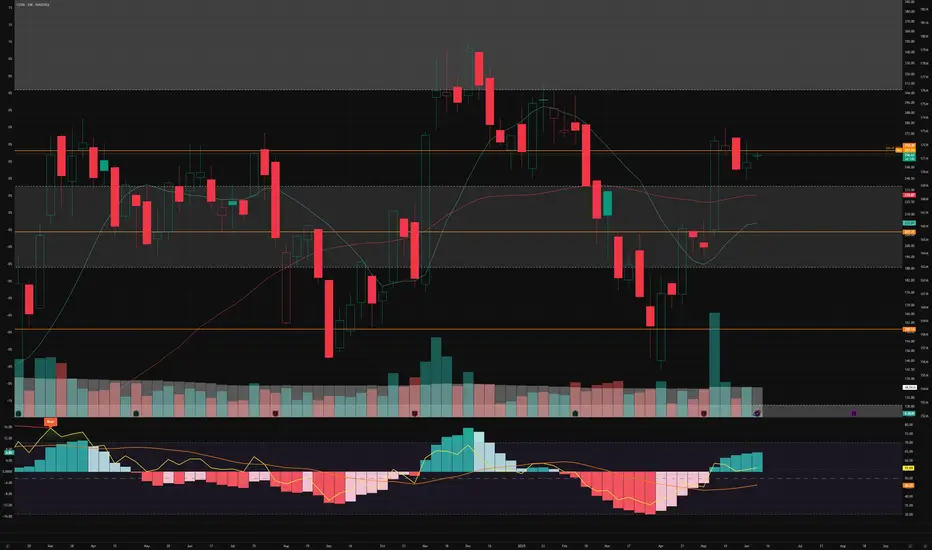
Price broke above range today with a big +18.8% candle to $295 — but...
Volume spike may signal exhaustion, not strength.
RSI = 68 → near overbought
MACD curling into a bearish cross — same signal preceded the last -30% and -40% drawdowns.
History: Same range-break setups in Dec and Feb collapsed hard (-30 to -40%) over 16–25 days.
💣 Trade Plan (Short Setup)
Entry Trigger:
🔻 Enter short if price closes below $277 tomorrow — confirms breakout trap.
Targets:
🎯 Target 1: $253 (top of old range)
🎯 Target 2: $235 (mid-range support)
🎯 Target 3: $208 (full breakdown move, matches last 2 cycles)
Stop Loss:
🛑 Above $297 (breakout highs)
Timeframe:
1–3 weeks (16–26 bars historically)
🧠 Bias
Bearish unless bulls hold $280+. If we get a big red daily candle tomorrow, fakeout confirmed — high-probability follow-through expected.
Coinbase Global, Inc. (COIN) Powers Crypto TradingCoinbase Global, Inc. (COIN) is one of the largest cryptocurrency platforms in the U.S., providing a trusted marketplace for buying, selling, and storing digital assets like Bitcoin and Ethereum. Known for its user-friendly interface and strong security, Coinbase supports both retail and institutional traders. The company’s growth is fueled by increasing crypto adoption, rising trading volumes, and its expanding lineup of blockchain-related services.
On the chart, a confirmation bar with rising volume confirms momentum. The price has moved into the momentum zone after breaking above the .236 Fibonacci level. Using the Fibonacci snap tool, traders can place a trailing stop just below the .236 level to manage risk while capturing more upside.

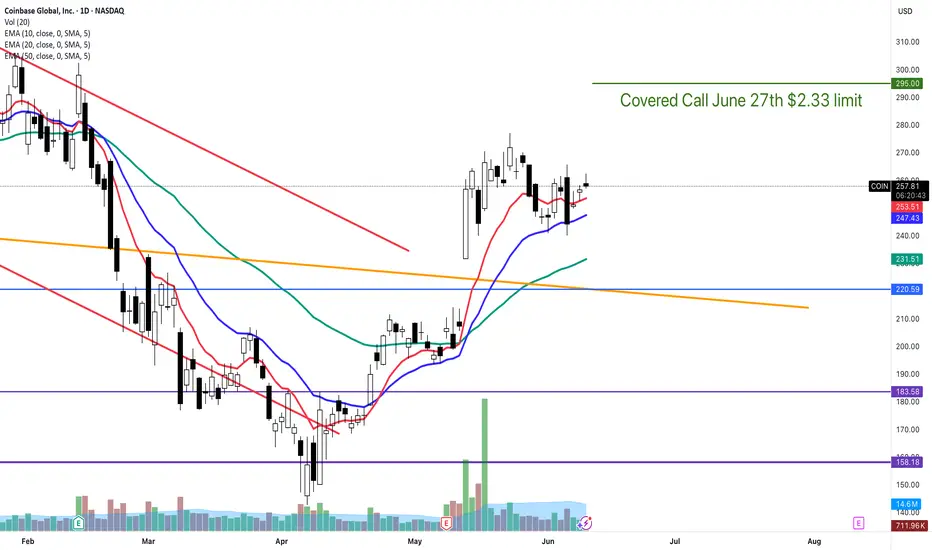
covered call on COINCryptos are pumping.. Trend is bullish. Moving averages, gaps, volume, everything looks like this should eventually resolve higher.
COIN Pullback or will lose steam ? Watch the levels for bouncesLet's dive into a technical analysis of Coinbase (COIN) stock with your requested indicators and patterns on a daily chart, as of Friday, June 27, 2025, at 9:27:54 PM PDT.
**Current Price & Performance:**
* **Last Price:** $353.297 (as of 4:00 PM ET on June 27, 2025)
* **Today's Change:** Down $15.779999 (-4.27399%)
* **Previous Close:** $369.21
* **Today's Range:** $346.66 - $372.50
* **52-Week Range:** $142.58 - $382.00
COIN has seen a significant run-up recently, up 44% in June, and was added to the S&P 500 in May, which has likely contributed to buying pressure from index funds. Today's session saw a notable pullback.
---
### **Bull Flag Analysis: Played Out & Potentially Forming**
A "bull flag" is a bullish continuation pattern that forms during an uptrend. It consists of:
1. **Flagpole:** A strong, sharp price increase (the "pole").
2. **Flag:** A period of consolidation, often a rectangular or parallelogram shape, with a slight downward or sideways slope, characterized by decreasing volume.
**The Bull Flag that Played Out:**
COIN has been in a strong uptrend in recent weeks and months, particularly in June. This sustained upward movement would have created multiple "flagpoles." As the stock consolidates after these sharp moves before continuing higher, those consolidation phases would represent the "flags."
Given COIN's significant increase of 44% in June and reaching near its 52-week high, it's highly probable that **a series of bull flags have played out** during its ascent. Each time COIN had a strong upward leg, followed by a brief period of sideways or slightly downward consolidation (the flag), it then broke out to the upside, continuing the overall bullish trend. This pattern aligns with its recent performance.
**Another One Potentially Forming:**
Today's 4.27% drop, coming after COIN hit multi-month highs, could be the *start* of a new "flag" formation.
* **New Flagpole:** The sharp run-up through June to the recent high of $382 can be considered the latest "flagpole."
* **Potential Flag:** The current pullback to $353.297 (and intraday low of $346.66) could be the initial phase of consolidation that forms the "flag." For this to be a classic bull flag, we would expect:
* **Consolidation:** The price to trade within a relatively tight, slightly downward-sloping or sideways channel for a few days or weeks.
* **Decreasing Volume:** Volume to typically decrease during this consolidation phase.
* **Breakout:** A subsequent breakout above the upper trendline of this consolidating channel, ideally on increasing volume, to signal the continuation of the previous uptrend.
**Right now, the pattern is very nascent.** It's too early to confirm a new bull flag, but the recent strong rise followed by a pullback fits the initial characteristics. Traders would be watching for the consolidation and then a clear breakout.
---
### **Williams Alligator Strength (Daily Chart)**
The Williams Alligator indicator uses three smoothed moving averages:
* **Lips (Green Line):** 5-period SMMA, shifted 3 bars forward.
* **Teeth (Red Line):** 8-period SMMA, shifted 5 bars forward.
* **Jaw (Blue Line):** 13-period SMMA, shifted 8 bars forward.
**Interpretation:**
* **Strong Trend ("Eating"):** When the lines are fanning out and ordered (Green > Red > Blue for an uptrend, or Blue > Red > Green for a downtrend), the Alligator is "eating" and the trend is strong.
* **Consolidation ("Sleeping"):** When the lines are intertwined or very close together, the Alligator is "sleeping," indicating a non-trending market.
**COIN's Alligator State:**
Given COIN's powerful rally through June, the Williams Alligator was undoubtedly in an **"eating" phase, with its mouth wide open upwards (Green line above Red, Red above Blue)**. This signifies strong bullish momentum.
Today's significant pullback (-4.27%) likely caused the **Lips (green line) to cross below the Teeth (red line)** or at least move very close to it. This indicates the Alligator is beginning to "sate" itself or move towards a "sleeping" phase.
* **Strength:** While the *overall* trend, as indicated by the wider separation of the Teeth and Jaw, might still be considered bullish on a slightly longer timeframe, the *immediate strength* as signaled by the Lips is weakening. The Alligator is likely no longer as aggressively "eating" upwards as it was.
* **Weakening Momentum:** The crossover of the Lips below the Teeth is a short-term bearish signal, suggesting a loss of immediate upward thrust. If the Red line also crosses below the Blue, it would confirm a more significant shift to a neutral or bearish trend.
---
### **Confluence of Two Fibonacci Retracements from Different Top/Bottoms**
Fibonacci retracement levels are typically drawn between a significant price high and a significant price low (or vice versa) to identify potential support and resistance levels. For confluence, we look for areas where different Fibonacci levels from *different* swings align, creating stronger price zones.
Let's consider two potential significant swings for COIN based on its recent price action and 52-week range:
**1. Recent Major Swing:** From 52-Week Low to Recent High
* **Low:** Approximately $142.58 (52-week low)
* **High:** Approximately $382.00 (recent high)
Applying Fibonacci retracement to this major upward swing:
* **23.6% Retracement:** $(382.00 - 142.58) * 0.236 + 142.58 = \$199.14$
* **38.2% Retracement:** $(382.00 - 142.58) * 0.382 + 142.58 = \$233.15$
* **50.0% Retracement:** $(382.00 - 142.58) * 0.500 + 142.58 = \$259.98$
* **61.8% Retracement:** $(382.00 - 142.58) * 0.618 + 142.58 = \$286.82$
**2. More Recent, Shorter-Term Swing:** From a recent consolidation low to the recent high
Let's consider a recent short-term low before the final push to the recent high. One source points to a swing low of **$294.56$ (June 23) to a high of $382$ (June 26).**
Applying Fibonacci retracement to this shorter-term swing:
* **23.6% Retracement:** $(382.00 - 294.56) * 0.236 + 294.56 = \$315.21$
* **38.2% Retracement:** $(382.00 - 294.56) * 0.382 + 294.56 = \mathbf{\$327.97}$
* **50.0% Retracement:** $(382.00 - 294.56) * 0.500 + 294.56 = \mathbf{\$338.28}$
* **61.8% Retracement:** $(382.00 - 294.56) * 0.618 + 294.56 = \mathbf{\$348.60}$
**Confluence:**
The current price of COIN is $353.297.
Looking at the second, shorter-term Fibonacci retracement, the **61.8% level at $348.60$ is very close to today's intraday low of $346.66$.** This indicates that this specific Fibonacci level acted as a significant support level today.
While there isn't a direct "confluence" where a 38.2% from one swing aligns perfectly with a 50% from another right at the current price, the fact that the **61.8% retracement from the most recent significant upward impulse ($294.56 to $382.00) provided strong support today** is a key observation.
**Significance:**
* **Recent Support:** The price tested and rebounded from the 61.8% retracement level of its most recent significant rally, which is often considered a strong reversal point for a healthy pullback within an uptrend.
* **Confirmation for Potential Flag:** If this level holds, it reinforces the idea that the current pullback is a "flag" in formation rather than a full trend reversal.
---
### **Overall Summary for COIN:**
* **Bull Flag:** COIN has experienced and completed several bull flags during its ascent. The current pullback from the $382 high could be the formation of **another bull flag**. For confirmation, watch for consolidation within a defined range and a subsequent breakout.
* **Williams Alligator:** The Alligator, which was "eating" aggressively during the recent rally, is now likely showing signs of **sating or sleeping** as the Lips (green line) cross below the Teeth (red line) due to today's pullback. This indicates a weakening of immediate bullish momentum and a potential period of consolidation or correction.
* **Fibonacci Confluence:** The price found strong support at the **61.8% Fibonacci retracement level ($348.60) of its most recent significant swing ($294.56 to $382.00).** This is a critical level for bulls to defend if the overall uptrend is to continue.
**Outlook:**
COIN is currently undergoing a healthy pullback after a strong run. The bullish underlying trend remains, supported by its S&P 500 inclusion and analyst optimism. However, the technical indicators suggest a period of consolidation or further retracement is likely. The $348.60 Fibonacci level will be crucial. If it holds, it increases the likelihood of the current pattern being a bull flag for another leg up. A break below it could lead to deeper retracements.
As always, remember that technical analysis provides probabilities, not certainties. Combining this with fundamental analysis and managing risk is crucial for any investment decision.
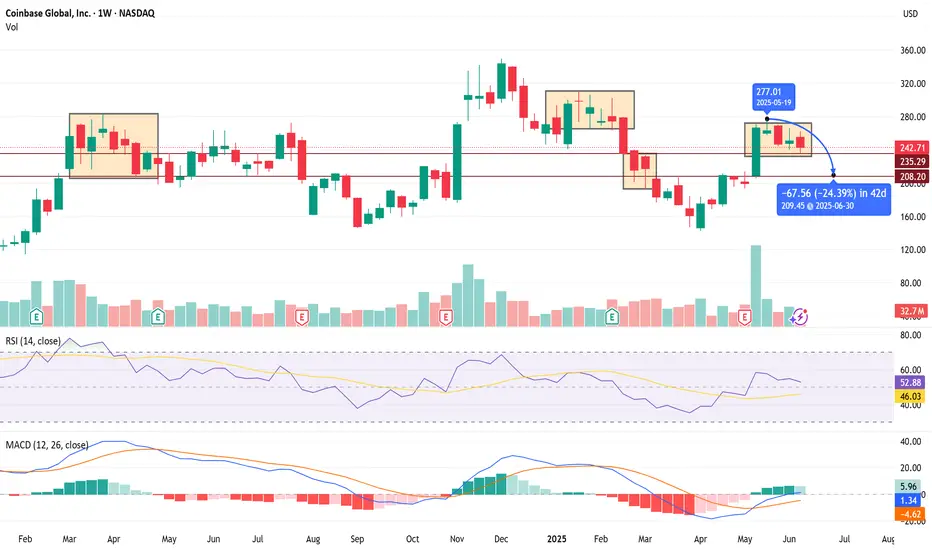
$COIN Daily/Weekly — Setting up for Knife Action Below 235 📉 COIN Daily/Weekly — Setting up for Knife Action Below 235 🔪
Thesis:
Price action continues to mirror prior failed consolidations followed by sharp flushes. After weak consolidation near 277, we are seeing early signs of exhaustion. Current price sitting at 242.71, directly above a key pivot zone at 235. Historical behavior suggests we could see another aggressive leg lower if 235 breaks.
Key Levels:
🔑 235 — critical trigger level for downside.
🔻 208 — primary target (prior support + measured move target).
❌ 250-255 — invalidation zone on strong upside reclaim.
Historical Context:
Previous breakdowns off similar consolidations have produced sharp -24% to -37% drops within 35-42 days.
Current measured move targets a similar ~24% decline in 42 days to 209 area.
Weak consolidation above 235 usually precedes these knife moves.
Trigger Plan:
Watch for early week failed push into 242-245.
Breakdown through 235 triggers short entries.
Momentum into 208 target ideally within 1-2 weeks, though conservatively allowing for 42 days based on historical pattern.
Indicators (Supporting Bearish Bias):
📊 RSI stuck near neutral but rolling over.
📉 MACD losing bullish momentum.
🔻 Volume has historically spiked into breakdowns.
Summary:
Expecting a flush below 235 to 208 if weakness confirms. Quick failed rallies into 242-245 could offer ideal short entries. Any weekly close under 235 will confirm bearish momentum shift.
⚠️ As always, this is not financial advice — strictly my personal trade plan.
- Taz
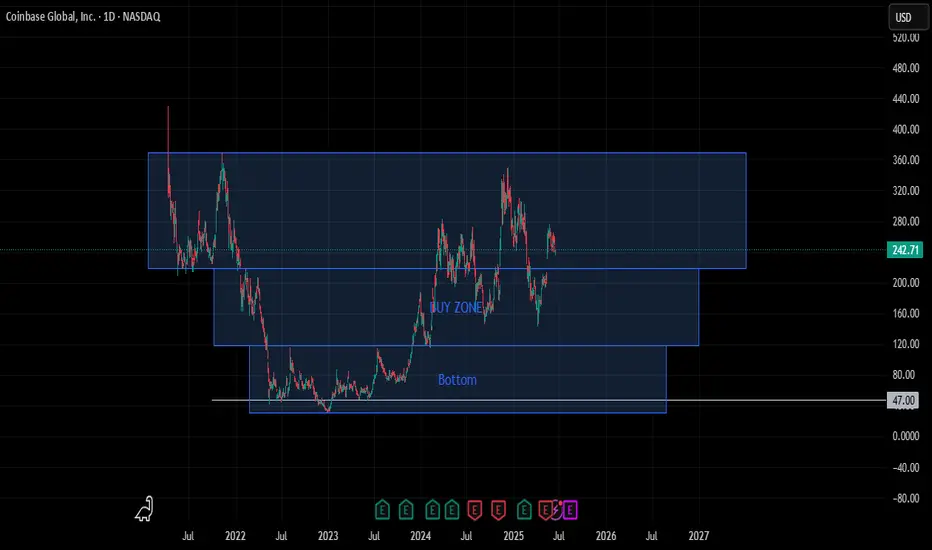
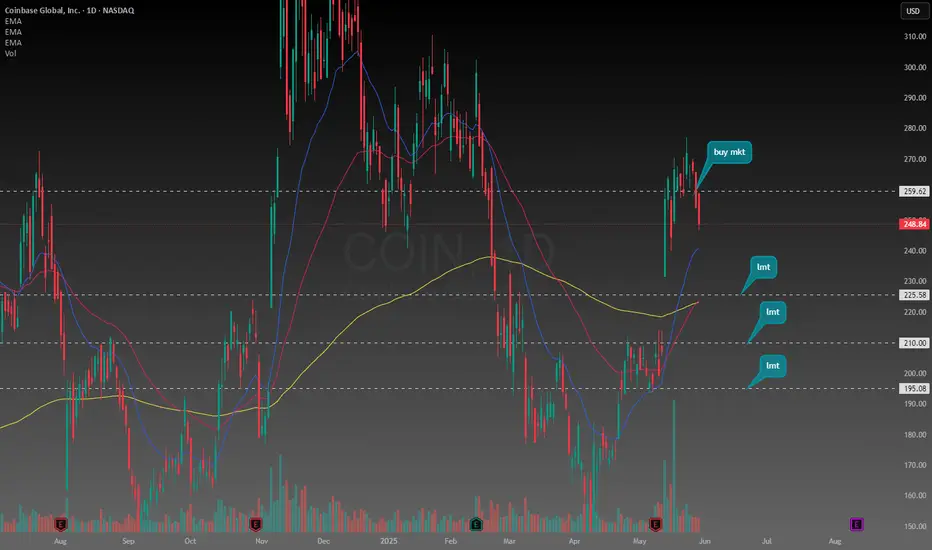
Identifying Buy Zone on $COINBased on the trend analysis, buy zone is around 220-120 range.
There's a good chance NASDAQ:COIN will retest this range, consider it's the most important zone here to decide wether this stock will sideways for a long-time or bounce back to the top.
Although it's unlikely to be reached in the near time, the Bottom Zone is identified and will be a very good value to buy.
Terimakasih.
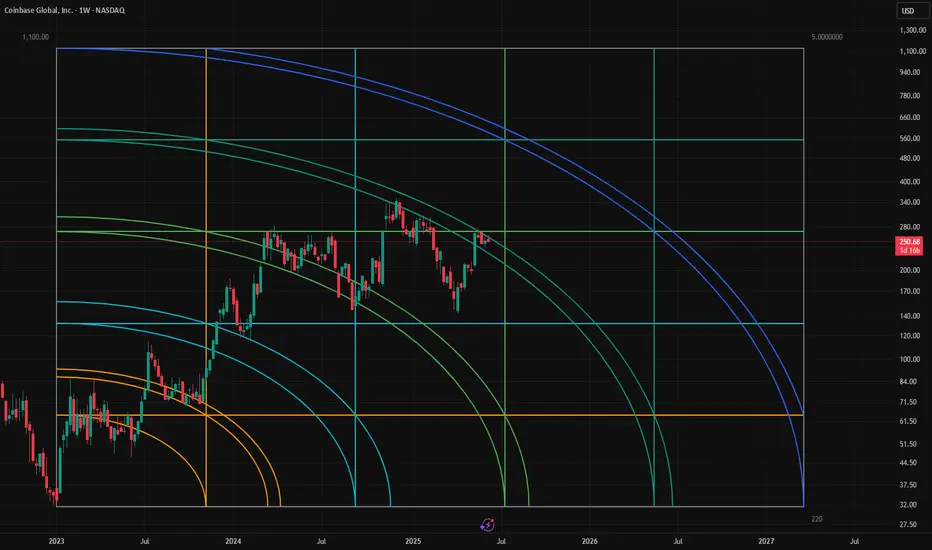
$COIN i following this gann arc quiet nicely!once price breaks the arc it will gravitate to the next one
Buying opportunity for COINSince the news on May 13, COIN has slumped with the rest of the crypto market. It appears to be consolidating and has shown promise since the large drop last Thursday. With Bitcoin appearing to approach the highs once again after retracing to the 0.3 level, there is a good chance COIN may reach the 350 level or beyond in the near future.
Cup and handle on COIN 500+ targetAs most companies after IPO, we got the drop and now the bouce, forming a cup and handle, if it keeps to break it we should see COIN above the $500+ in coming months. This aligns with Bitcoin expected rally.
Not financial advice, just a hobby.
Coinbase $450 price target for next 12 monthsSimple Coinbase trend analysis on the weekly chart looking like a second leg up. The range of the intrinsic value of the stock is between $195 and $450.
COIN Scalp Short into LongCoinbase has benefited from the recent strong uptrend for the bitcoin price , and despite news regarding hacks and security compromises, Coinbase still manages to remain in a strong uptrend.
At present, we have some missing data on the chart where there is an existing gap at approx $230 in confluence with the VWAP (Volume Weighted Average Price) which is a moving average I like to use as confirmations for continuations of a trend.
In this scenario, a potential scalp short, into a long trade would be an interesting setup presenting itself here , given we see strength return to Bitcoin, Coinbase can be a primary beneficiary for a potential rotation back to the ATH zone.
Coinbase is an excellent instrument for exposure to cryptoTrading at roughly 2x the price of Bitcoin, Coinbase presents a unique opportunity for exposure to the crypto sector. Fundamentally it is better to invest money for the long term on a business that generates revenue. I am very bullish on crypto, but with limited funds I want to make sure I deploy my capital as intelligently as possible.
There is several interesting strategies Coinbase uses to generate revenue based on crypto and blockchain processes and capabilities. From being able to exchange currencies like traditional currency systems for payments or money transfers. Mining proof of work assets like Bitcoin have used far too much resources to not be considered "valuable, and scarce". Proof of stake where staking rewards payout better than most dividends. Recent institutional adoption by some of the most significant entities. Coinbase has a portfolio of most of the crypto currencies so it guarantees a diverse exposure to the sector.
Its very obvious the people are loving crypto currencies, I want to be exposed to crypto but also want to invest in the fundamentals of generating revenues. Coinbase is the perfect vehicle in my opinion for exposure to crypto they generate revenues based on commissions and spreads, I'm sure they have some other strategies they use to consistently generate income even if crypto is going down, so that makes me even more convicted in my decision to put my money on Coinbase stock. Only being listed on the Nasdaq for four years I believe we are in for a wild ride to the upside so long as Bitcoin and the crypto market as a whole continue with this volatile momentum.
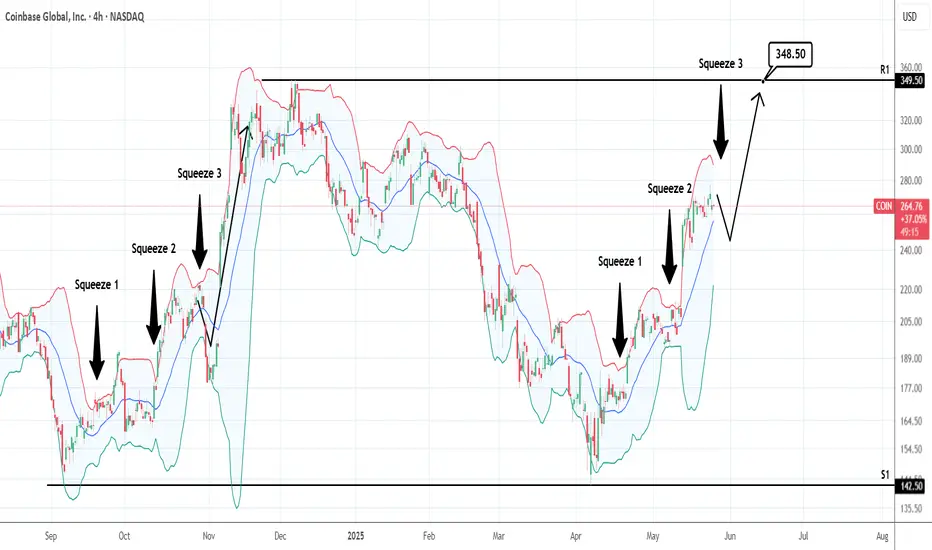
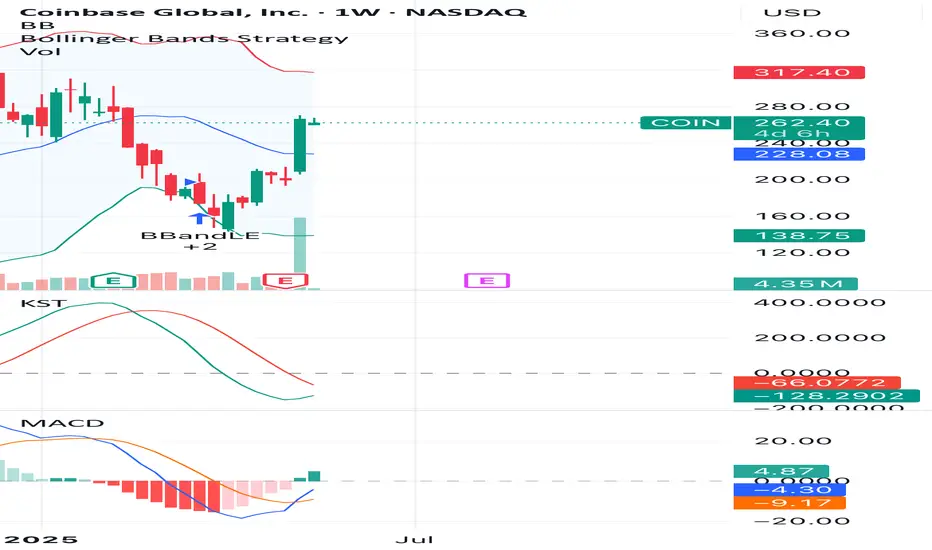
COINBASE: 3rd Bollinger Squeeze is a pullback buy signalCoinbase is bullish on its 1D technical outlook (RSI = 65.834, MACD = 21.140, ADX = 19.909) as it is extending the bullish wave following the S1 rebound. The Bollindger Bands are now expriencing a squeeze, which is the 3rd since the bottom. The 2024 bullish wave also had three Bollinger Squeezes with the 3rd being the last that made the 349.50 High but not before a pullback to the Bollinger bottom. If that takes place, it will be a signal to go even stronger on the bullish side and target the R1 level (TP = 348.50).
## If you like our free content follow our profile to get more daily ideas. ##
## Comments and likes are greatly appreciated. ##
CoinCoinbase under pressure after surging to $271.
A reported hack and data breach is fueling the sell-off.
Correction targets: $218 and $180.
Watching for further downside — panic could escalate.
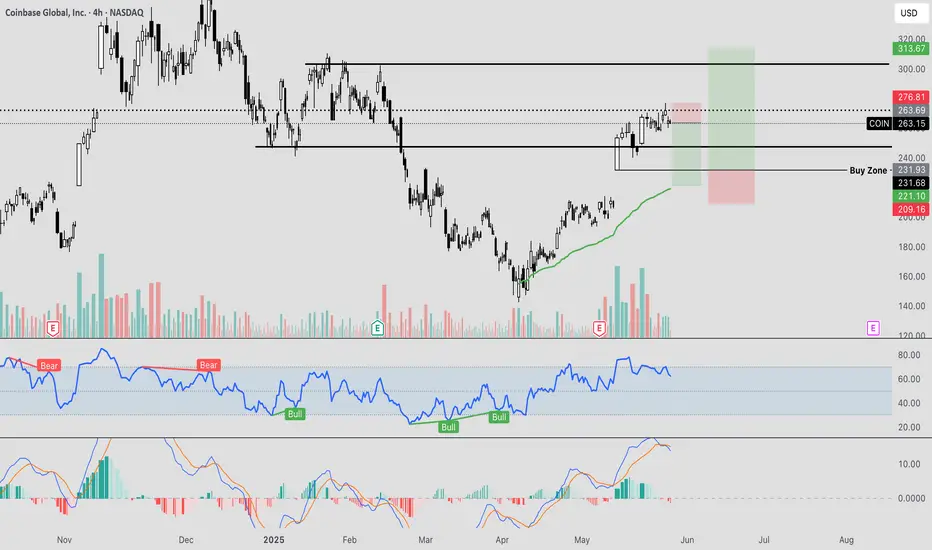
COIN Bullish Continuation Above $260, Targeting $317COIN (Coinbase) is showing strong bullish momentum after breaking above the $250 zone. The price is holding above the middle Bollinger Band with increasing volume. MACD is crossing to the upside, supporting further continuation toward the $317 resistance level.
Trade Setup:
• Entry Zone: $260 - $263 (Current Price)
• First Target: $280
• Second Target: $317
• Stop Loss: Below $240
Technical Analysis Highlights:
• Strong price action above the middle Bollinger Band.
• Bullish MACD crossover.
• Volume expansion confirms the breakout.
Recommendation:
Consider entering long positions above $260 with targets at $280 and $317, while managing risk below $240.
Coinbase : CoinUSD $Coin - BullishAccording to the chart, Coinbase is predicted to "go to the moon." With its expected addition to the S&P 500 on May 19th, this stock is likely to pump much higher than you might anticipate. My target is $800+.

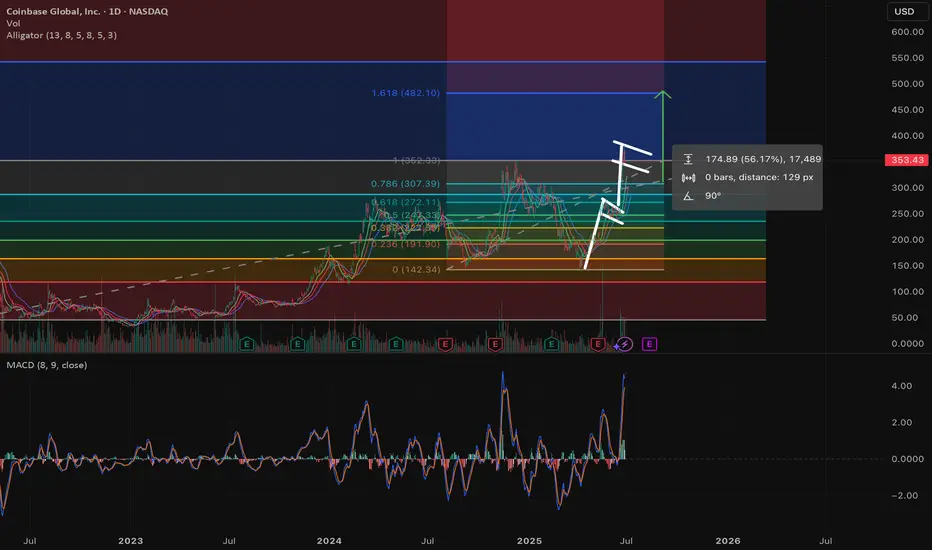
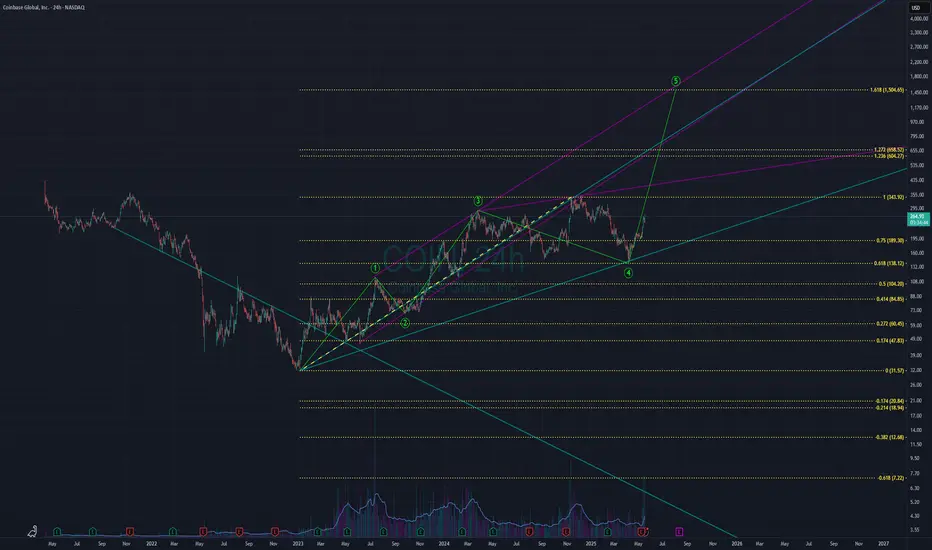
COIN $1500Let’s analyze how the coin, trading at $264.99, can reach the 1.618 Fibonacci target of $1,504.65, using first principles and focusing on the chart’s technical setup without referencing the trend line labels.
**1. Starting Point**: The coin is at $264.99 on a 4-hour chart, near a lower trend line around $260-$300 where the price has previously found support. This suggests potential for an upward move if buyers step in.
**2. Elliott Wave Framework**: The chart shows a completed five-wave structure followed by a three-wave correction. At $264.99, the coin is likely beginning a new impulsive wave (e.g., wave 1 or C of a larger pattern), which often targets Fibonacci extensions like 1.618.
**3. Fibonacci Target**: The 1.618 Fibonacci extension is at $1,504.65, a typical target for impulsive waves. This level is calculated by projecting the length of a prior wave from the current base around $260-$300.
**4. Key Levels**:
- **Resistance**: A descending trend line around $600-$700 acts as the first major barrier. Breaking above this with strong momentum signals a bullish continuation.
- **Support**: The $260-$300 area must hold to maintain the uptrend. A break below could indicate a reversal.
**5. Path to $1,504.65**:
- From $264.99, the coin needs to rally, breaking the $600-$700 resistance to confirm the uptrend.
- An intermediate Fibonacci level around $975 may pose minor resistance, but a strong trend should push through.
- The $1,239.66 move ($1,504.65 - $264.99), a 468% increase, requires sustained buying pressure.
**6. Market Dynamics**: Impulsive waves rely on strong buyer momentum. If volume and market sentiment align, the coin can climb steadily. Failure to break $600-$700 or a drop below $260 would challenge the bullish scenario.
**Conclusion**: The coin at $264.99 can reach $1,504.65 if it holds above $260, breaks the $600-$700 resistance, and maintains bullish momentum. The Elliott Wave and Fibonacci structure supports this target, but the price levels suggest this isn’t Bitcoin. Watch the $260 support and $600-$700 resistance for confirmation.
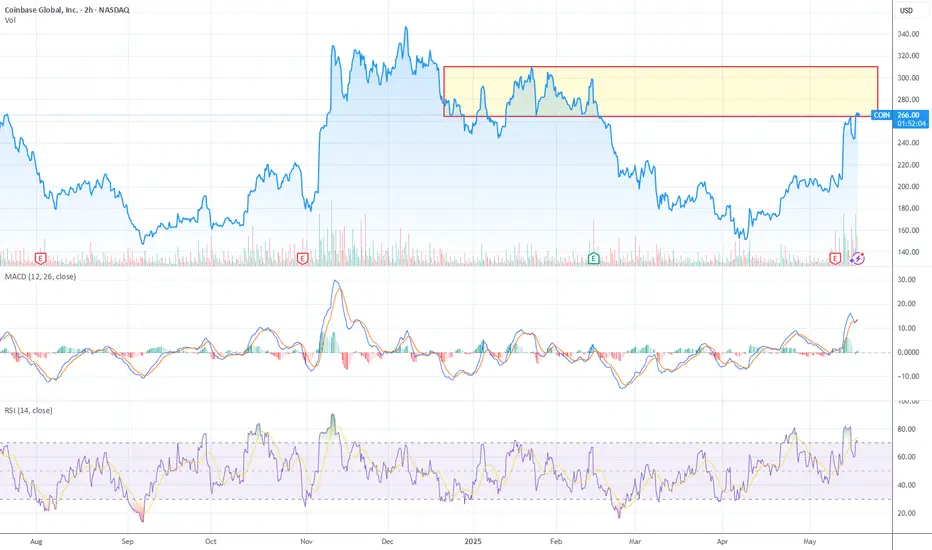
COIN at War Zone: $270 Break = Blast Off or Bull Trap?1. Price Action – Strong Breakout Potential
Price has ripped straight up from ~$210 to $267+, a 25%+ move in just a few sessions. This vertical acceleration suggests strong institutional demand. It’s now testing the bottom of the prior supply zone ($280–$300) — if it breaks and holds above $280, the prior distribution becomes accumulation. That would open up $310+ targets quickly.
2. Volume – Signs of Accumulation
Recent volume surge = signs of smart money re-entering. Notably, volume has increased on green candles, suggesting aggressive buying, not just short covering. If this move sustains volume on the next leg, bulls are in control short-term.
3. RSI – Overbought Can Stay Overbought
RSI is above 70, yes — but in strong uptrends, RSI can remain overbought for extended periods. Think of RSI 70+ as a "momentum zone", not an automatic sell. No bearish divergence yet, so momentum is still in favor of bulls.
4. MACD – Bullish Momentum Still Intact
MACD histogram is flattening, but lines are still wide and bullish. No confirmed bearish crossover yet. If price consolidates sideways and MACD resets slightly without crossing, it could be coiling for another leg up.
5. Sentiment + Macro
Crypto sentiment is improving, with Bitcoin and Ethereum reclaiming strength. COIN is a beta play on crypto adoption — and institutional participation in crypto markets helps COIN directly. If broader crypto rallies, COIN could ride a sector tailwind.
6. Fib + Structural Level
COIN is retracing about 78.6% of the prior down move — while this is a reversal zone typically, if price breaks above this, it implies a full retrace and bullish reversal. That would target Dec highs around $340.
Bullish Trigger Levels
Break and hold above $280 = confirmation bulls absorbed prior supply. Volume needs to stay elevated — otherwise this could be a “last gasp” rally.
If $280 breaks, next stop: $300–$320.
Bullish Setup
Entry: Above $260 on volume
Stop: Below $240
Targets:
• Short-term: $295–$320
• Medium-term: $330–$340
Final Thought:
This is a high-stakes decision zone. If bulls can punch through the supply wall, we could see explosive continuation. But if price stalls and momentum fades here, it may set up the perfect bull trap.
Godspeed!
Coinbase (COIN) Shares to Be Added to the S&P 500Coinbase (COIN) Shares to Be Added to the S&P 500
According to media reports, shares of the cryptocurrency exchange Coinbase Global (COIN) are scheduled to be added to the S&P 500 index (US SPX 500 mini on FXOpen) on 19 May, replacing Discover Financial Services (DFS), which is in the final stages of being acquired by Capital One Financial (COF). The deal, having received all necessary approvals from regulators and shareholders of both companies, is expected to be completed on 18 May 2025.
As a result, Coinbase Global will become the first cryptocurrency-related company to be included in the S&P 500 index — a development that sent COIN shares surging to their highest level since late February. Inclusion in the S&P 500 is considered a bullish catalyst, as it suggests increased demand for the stock from index funds and signals improved prospects. Analysts have taken note; Rosenblatt Securities raised their price target for Coinbase Global Inc. (COIN) from $260 to $300.
Technical Analysis of COIN Stock Chart
In previous analyses of the COIN stock chart, we:
→ drew a descending channel;
→ identified a resistance zone in the $225–240 range (highlighted in purple).
However, the surge in demand triggered by the news of COIN’s inclusion in the S&P 500 has led to:
→ the descending channel appearing to lose relevance entirely;
→ the price gapping above the purple resistance zone;
→ increasing grounds to draw a potential upward trend trajectory (shown with blue lines).
Given the current momentum, it is possible that the COIN share price could rise towards the psychological $300 level, which acted as resistance earlier in 2025.
This article represents the opinion of the Companies operating under the FXOpen brand only. It is not to be construed as an offer, solicitation, or recommendation with respect to products and services provided by the Companies operating under the FXOpen brand, nor is it to be considered financial advice.
COINBASE and ALTS going hand in hand! Massive break-out expectedCoinbase (COIN) and the Crypto Total Market Cap (excluding top 10) are going hand in hand in this Cycle as their patterns since the November 08 2021 High have been virtually identical.
Right now we are on a strong rebound which was initiated on both after breaching below the 1W MA200 (orange trend-line). That is basically a Double Bottom, aiming at a break-out above their respective Resistance levels, which is expected to be massive.
Notice how even their 1W RSI patterns are similar, both Falling Wedges. Also their Bull Cycles both started on an Inverse Head and Shoulders pattern, so there is every reason to expect that the two will continue hand in had until their very peaks of the Cycles.
-------------------------------------------------------------------------------
** Please LIKE 👍, FOLLOW ✅, SHARE 🙌 and COMMENT ✍ if you enjoy this idea! Also share your ideas and charts in the comments section below! This is best way to keep it relevant, support us, keep the content here free and allow the idea to reach as many people as possible. **
-------------------------------------------------------------------------------
💸💸💸💸💸💸
👇 👇 👇 👇 👇 👇

COINBASE and it's massive inverse head and shoulders...observed in Coinbase chart formation indicates it has potential to become a trillion-dollar enterprise!
With a Logarithmic projection heading towards $4000 per shares.
#COIN has a market cap off $66 Billion right now
It has as just entered the SP 500
Is in the process of receiving a Banking Licence
And is the main custodian for all the major #crypto ETF's
Those are the drivers why this is likely to be a four figure stock in the coming years.