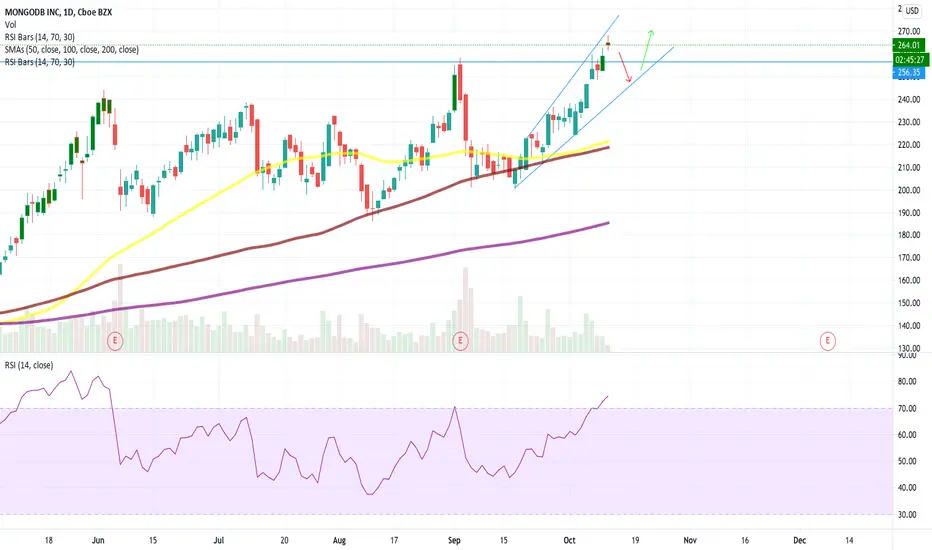
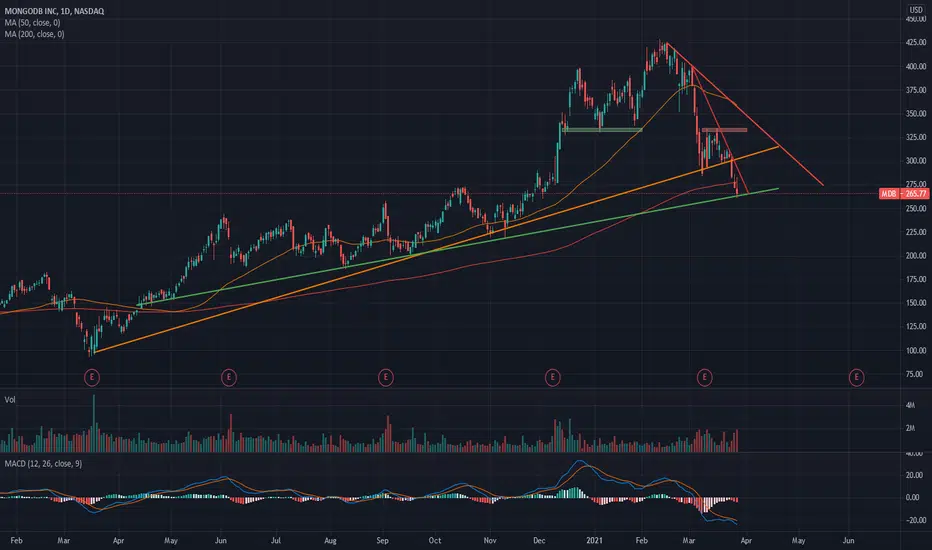
Bull FlagThere is also an inverse head and shoulders at the bottom but has broken neckline which can now serve as support.
Golden cross noted as well. A golden cross occurs when a faster-moving average crosses a slower moving average. Typically the 50 and the 200 DMA (daily moving average) are used. The death cross is opposite and would be when the 50 crosses down and through the 200.
A bull flag is a continuation pattern that occurs as a brief pause in the trend following a strong price move higher. The bull flag chart pattern looks like a downward sloping channel/rectangle denoted by two parallel trendlines against the preceding trend. During this period of consolidation, volume should decrease or flatten out through its formation and resolve to push higher on the breakout. The actual price formation of the bull flag resembles that of a flag on a pole hence its namesake. I do not see a large volume bar at point where the flag resistance line (top trendline) was broken, however there is a large volume bar at the right shoulder of the Inverse H&S pattern.
The pole has to be long enough to support the weight of the flag or it will fall over )o: In other words a flag can not stay in the down channel for eons as it will become too heavy for the pole. If the retracement becomes deeper than 50%, it may not be a flag pattern so take another look. Ideally, the retracement (pull back) ends at or less than 38% of the original trend up.
Both the bear (appears after a steep move down) and bull flag (appears after a steep move up) chart patterns measure the target price as a projection using the length of the flagpole. I take the pole using the magnet and move it to the bottom trendline of the flag. I have seen folks project targets differently though.
Negative volume is very high. Short percent is over 9% with a bit over 7 days to cover. This is not a value stock! Revenue is growing a lot quarterly but EPS is still negative. Market cap is 28.2 billion. I am looking at the patterns and patterns do fail.
No recommendation.
The market is rarely rational. Price can move in ways that cause the maximum amount of pain the maximum amount of people )o:
526 trade ideas

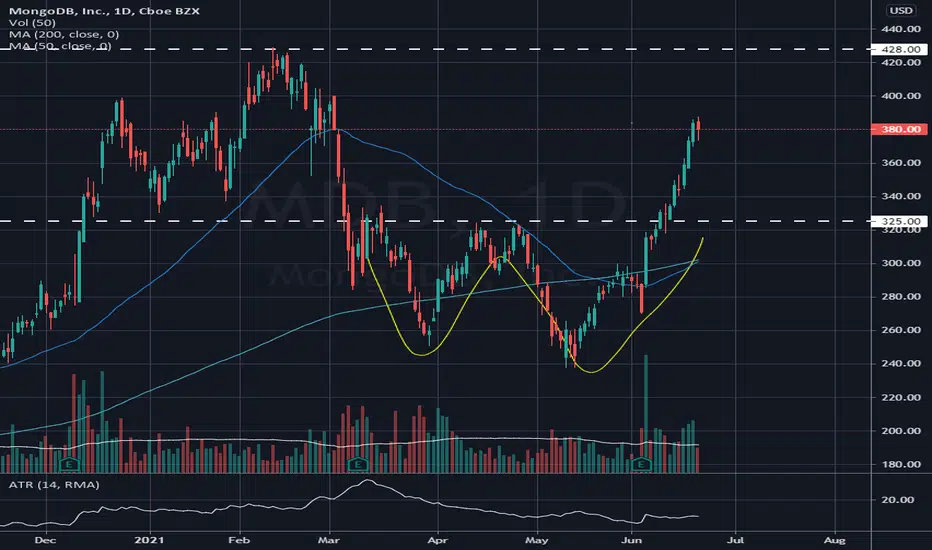
US Stock In Play: $MDB (MongoDB Inc)$MDB broken out of a double bottom chart pattern from $325, general trend resumption price action behavior, rallying +17.36% within a week. $MDB is currently close at $380, its 3 months high.
With $MDB current implied volatility remaining 40% away from its peak of $26/day that was set in March 2021, $MDB remains in traction to recapture its all time high of $428 at its current price action momentum that is defying general market weaknesses.
$MDB provides general purpose database platform worldwide. The company offers MongoDB Enterprise Advanced, a commercial database server for enterprise customers to run in the cloud, on-premise, or in a hybrid environment; MongoDB Atlas, a hosted multi-cloud database-as-a-service solution; and Community Server, a free-to-download version of its database, which includes the functionality that developers need to get started with MongoDB. It also provides professional services, such as consulting and training.
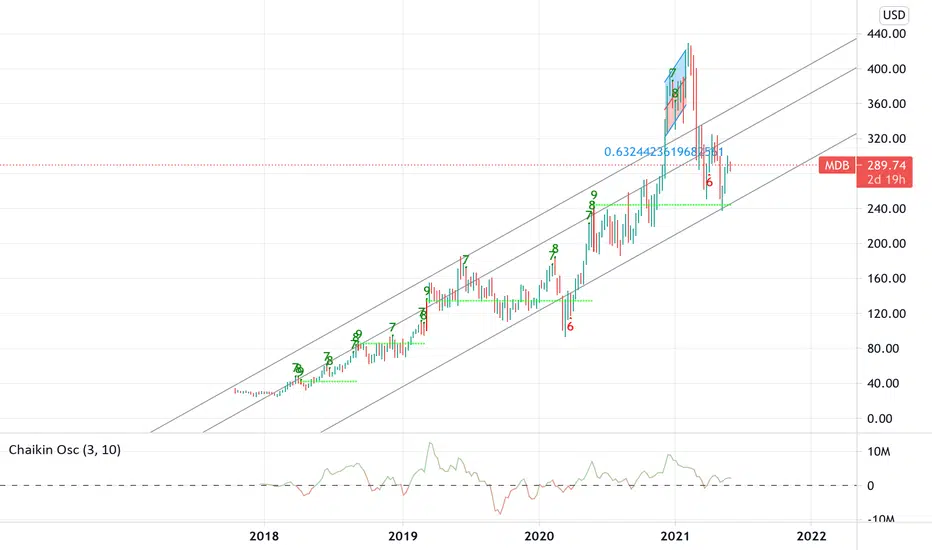
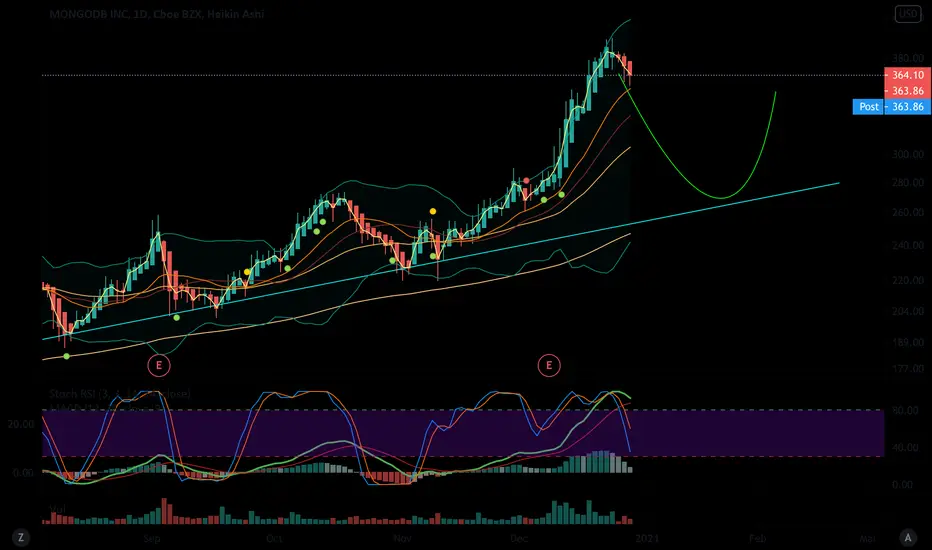
$MDB bullish descending wedge breakout$MDB set to test much higher levels, $571 target.
Look to enter on dip above upper trend line breakout
Price action trading in a bullish descending wedge with resolution to the upside on breakout.
Now above 200 dma and MACD beginning to curl back up.
Trade could last several months and stop set with break below UTL of breakout.

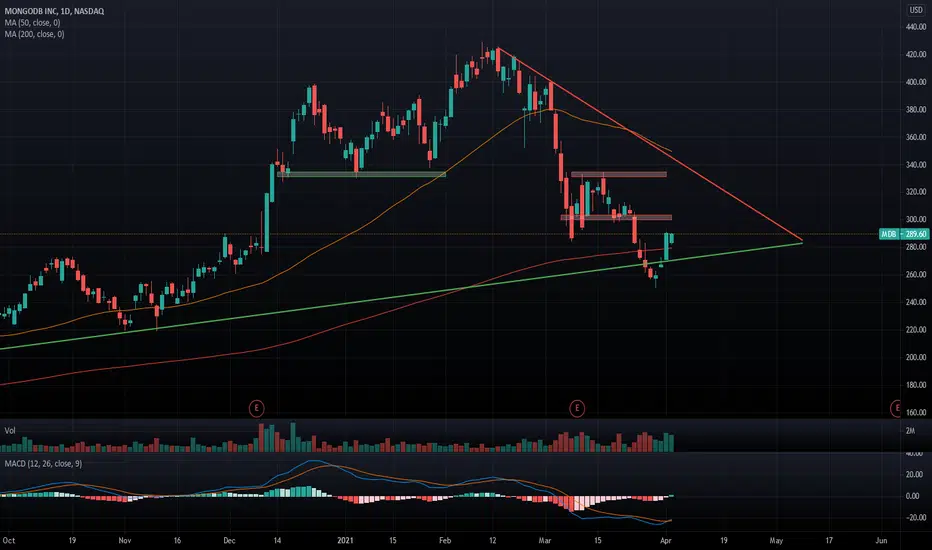
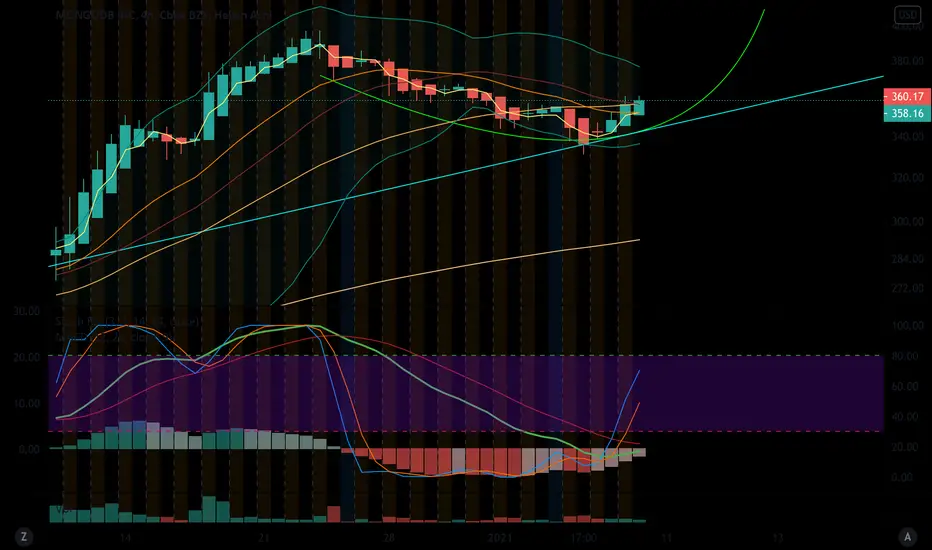
MDB has work to doConsidered MDB to be in a spot of bother a little bit ago... it slipped but regained it's 200 day SMA - which is very good - however it's still got a fair bit of work to do. It's regained it's uptrend line from last spring but faces resistance zones and the downtrend line that's started all this to beat. This stock is still in quite a precarious position so proceeding with caution.
MDB - Long CallsSorry for the mess.
Green dashed - Entries
Green solid line - Buy the dip
Red dashed - Price targets

MDB in troubleVery bearish situation. Resting on a single trendline of support which doesn't instill much hope. Even if it holds in the near-term this has many resistances and problems to face. Yikes.
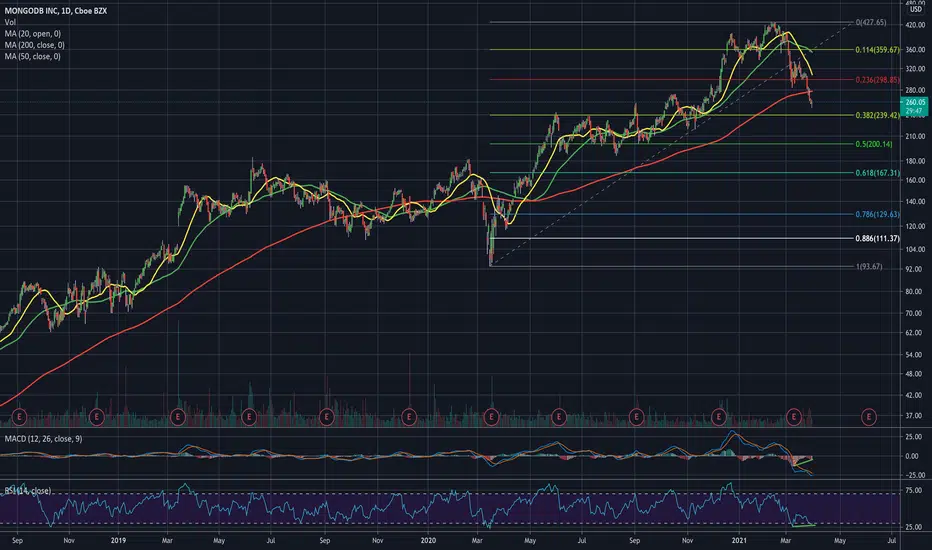
What many people have waited for on MDBGreat company, partnerships will only grow and central to the crypto space etc. Early apple.
200 MA on this one usually means bargains and whilst the revenues were down, whose wasnt?
Sure its had a good run and perhaps 618 deeper retraces.
But long term, 1-2 yrs this ones on sale.
Here is catching knife territory, but like the candle and maybe a 38.2 golden retrace trampoline.
Oscillators is where im bullish in particular. Divergance evident on both and therefore not a bad area even for a short term trader.
Fundamentals are excellent. I think this is just covid fallout. If anything shouldnt tank with a crash, its this one.
A nice DCA here to start and watch is a good strategy.
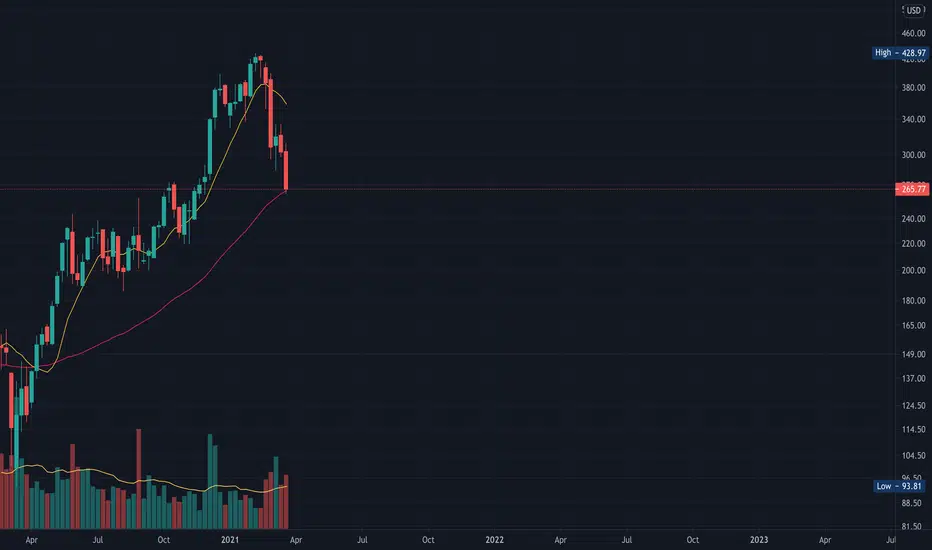
MDB at some big supportMDB has been selling off pretty big the last couple weeks. It's retraced all the way to the 50 week MA. Watching it closely now to see if it'll bounce. Lower timeframes look strong so gonna keep an eye on this one. Not convinced yet to go long so keeping this neutral for now.
MDB - Not looking so good.I see a bounce near term to 316 then 343 which would coincide with the top of the ichimoku cloud on the daily, but long term daily trend is pointing downwards. I expect a retracement down to 282 first, then 265. Daily candle also closed under the cloud with decent volume for the first time since covid crash which are very bearish signs.

MongoDb feels support of MA200 (4h)MongoDb tested the MA again and may bounce again back to new highs now.
Drawdown last weeks was not the heavy, which shows a strong stock/company possible to buy


$MDB 1 month cup & handleMongodb setting up nicely just below its ATH. Looking pretty strong here and possibly ready to start running higher again.
Mongodb Inc Cl A (MDB)- DEVELOPS AND SELLS SUBSCRIPTIONS TO A MODERN, GENERAL PURPOSE DATABASE PLATFORM

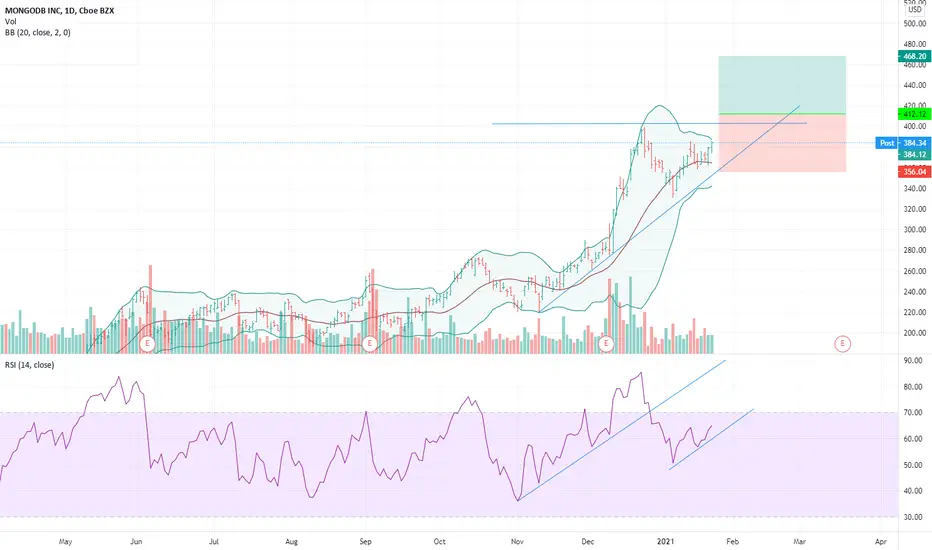
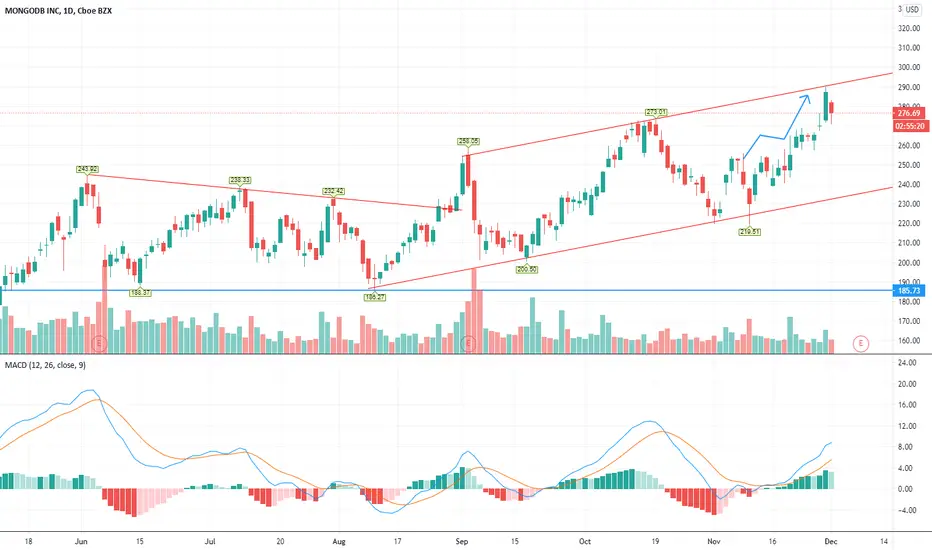
MDB breaking out long to $400!MDB breakout long with MACD crossing up after correction, should have strong support for stop at 330
Short? MACD & RSI crossing downNot positive yet, but this could be a short opportunity, support is all the way down at $270 - $260 range, that would be a nasty drop. MACD & RSI are heading down, we'll see if it follows my green line.
MDB Higher HighsMDB making upward channel higher-highs and higher-lows. The potential uptrend resistance target could be 289-290. Stoploss 242. PL 11:4

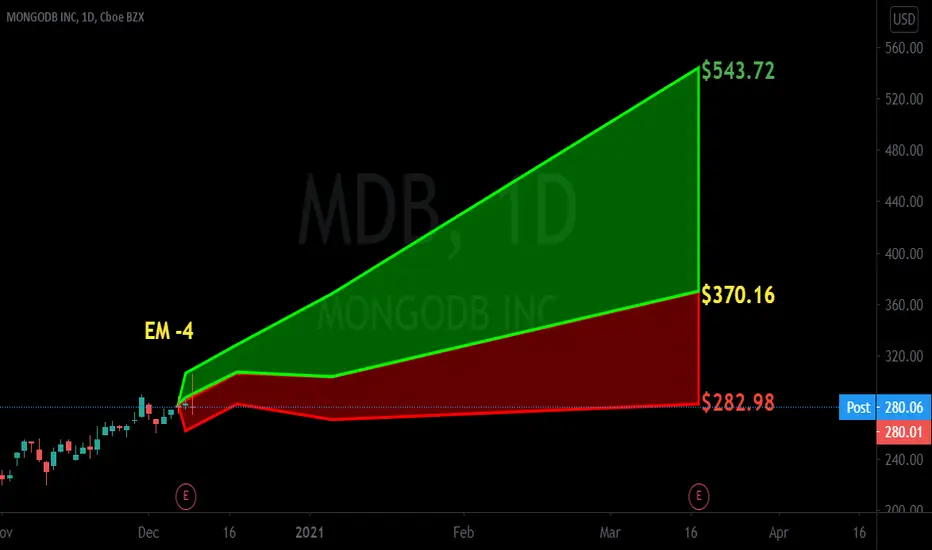
$MDB with a projected bullish outlook The PEAD projected a bullish outlook following $MDB earning release with a negative over reaction after earning release with the PEAD placing the stock in Drift C
If you would like to see the Drift for another stock please message us. Also click on the Like Button if this was useful and follow us or join us.
Dec 6-11 watchlist - AMD CHWY LULU MDB AMD on break out watch for all time highs. CHWY - ER tuesday after hours, the retail space has been killing ER's. LULU - Retail sector again, All the girls stuck at home buying more legings, lol. MDB - SaaS sector , dont hold thru earnings, play the run up. Also, Door dash ipo is wednesday. Good Luck!


MDB Respecting the ChannelMDB is respecting the channel and hitting exactly on the top of the channel now price is going down.
MDB daily inside candle 11/6/2020set alerts on monday for the break on today's high/low to the target in that direction
#MDB $MDB

nice uptrendbut we all know the saying, what goes up must come down. look for a dip entry ;) goodluck <3