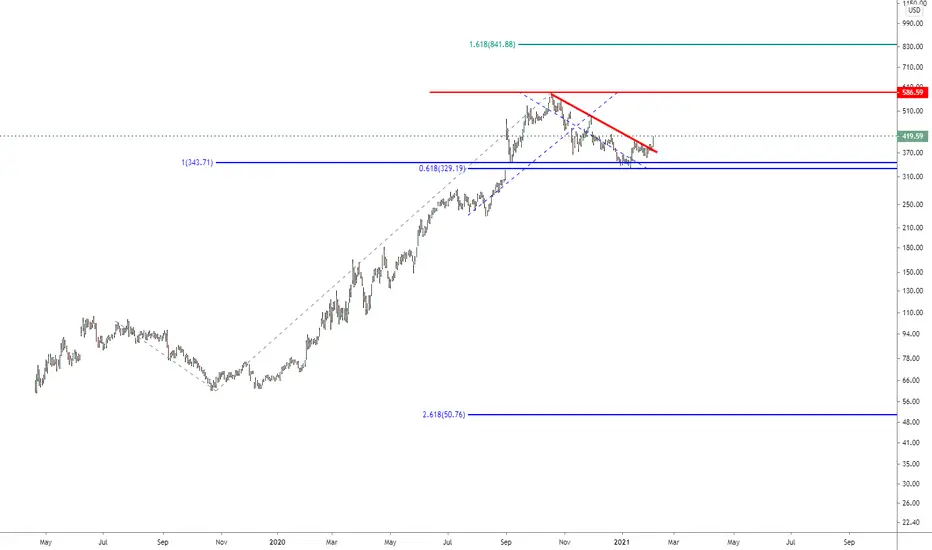
For ZM Bull: We need to hold the line at $486 to take overZM needs to pass $433 first and stay strong above $475 then we will see ZM going to pass ATH
5ZM trade ideas
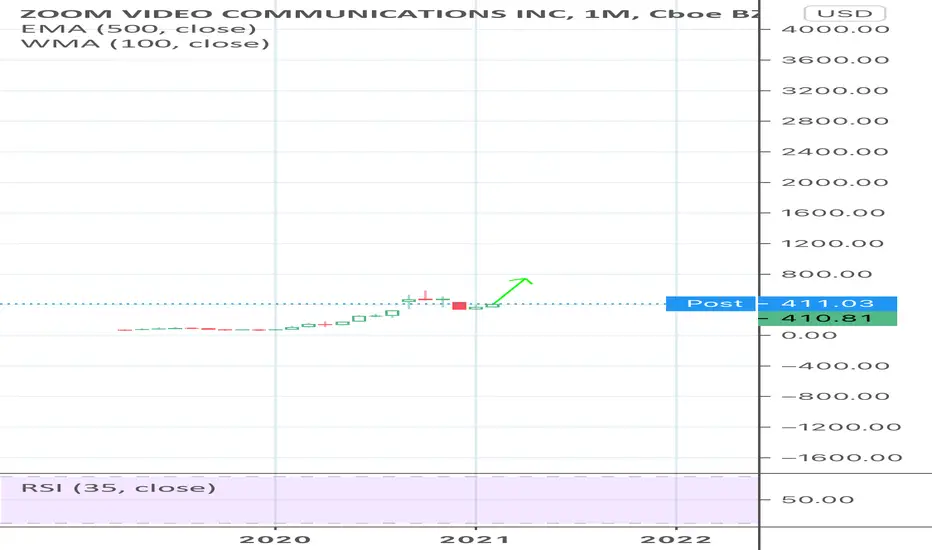
Just a quick ideaRight now would be a good entry point, since this is the new way companies and businesses are communicating with their employees this might be a good long term investment
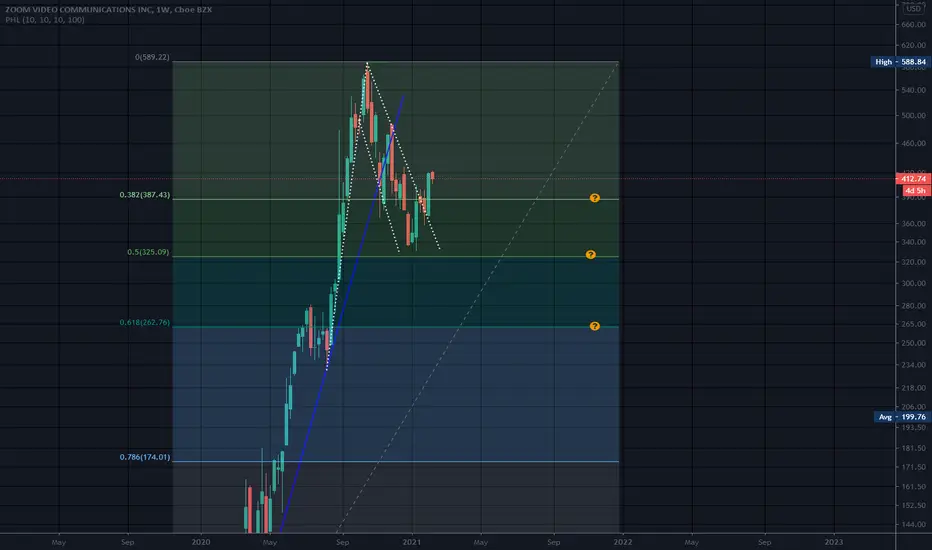
Dunno May be Close to Landing PadWeekly chart. Weekly charts often show you the true angle of the run up (or monthly)
If this is a parabolic arc pattern, most pull back 50% to 62% during correction mode, or somewhere in between as well. It is possible to fall back deeper. Arc patterns do not usually "Blast off" when they hit their level either as other stocks hit a sweet spot and Boom, off they go. Patience would be required perhaps as zoom had a steep rise up..
If this is an arc pattern, there can be volatility for an extended amount of time..
Just an observation and not a recommendation
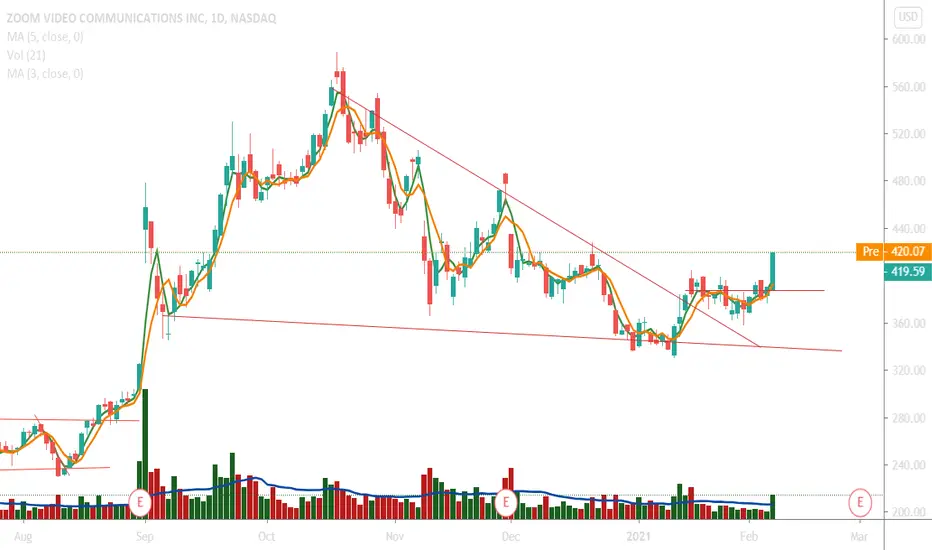

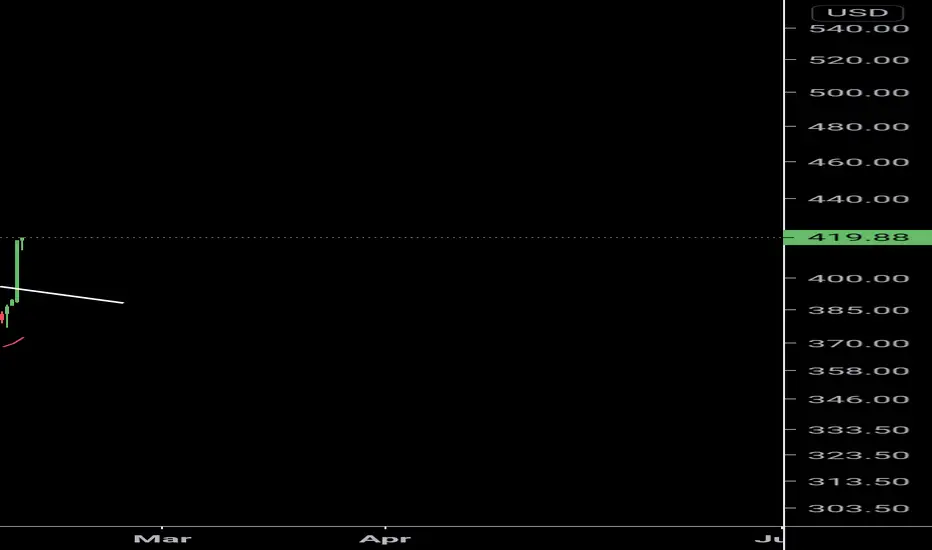
Watching for continuationWe caught some great lottos on Friday, tomorrow watch where this opens, if it gaps up to trendline watch for pullback to yesterdays HOD or 409. From there I think it will try and test that trendline.
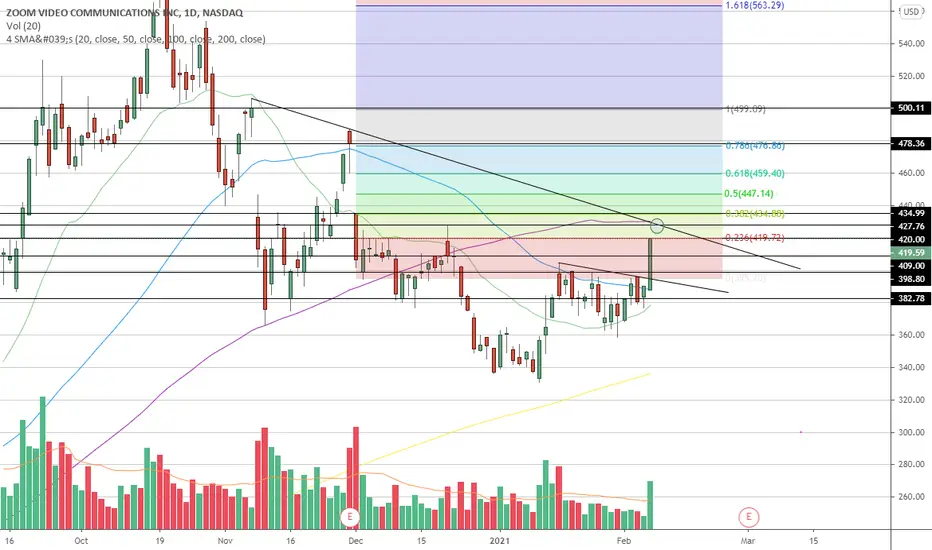
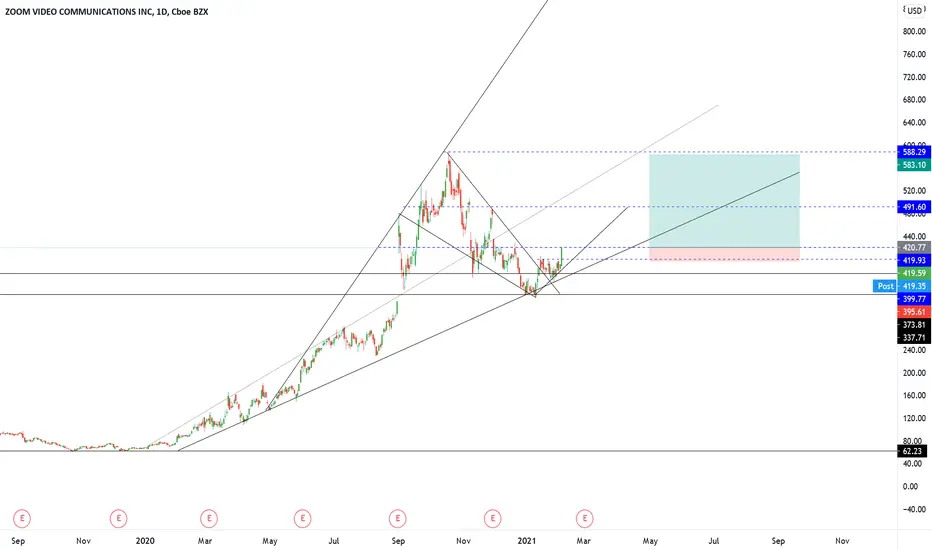
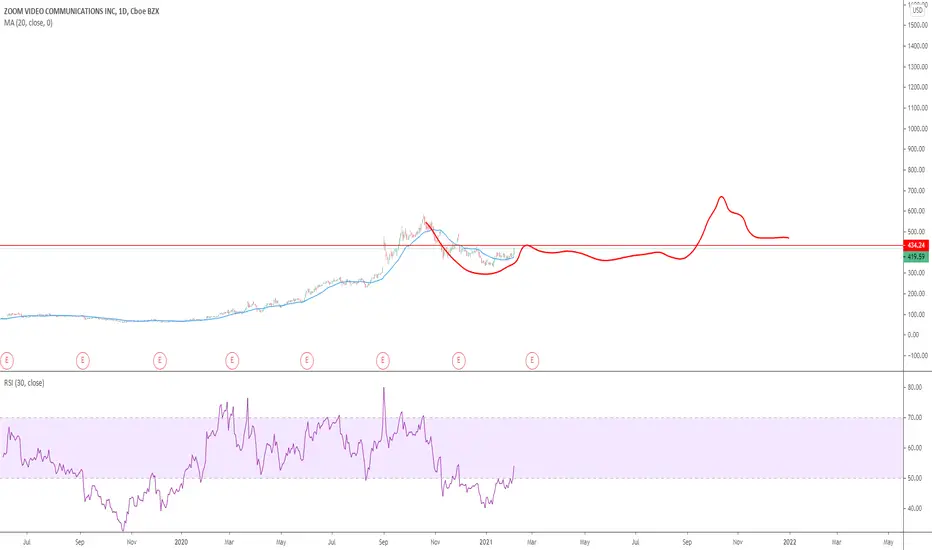
Bullish on ZM target 600-700 by March-AprilMid-term target 600-700 on ZM
Short term target for February 460-480
Key pivot: 420
Targets above 420 are 434, 450, 460, 480
This monster is about to wake up.
Broke out of a flag Friday, we either see continuation Monday or a pullback to retest the breakout.

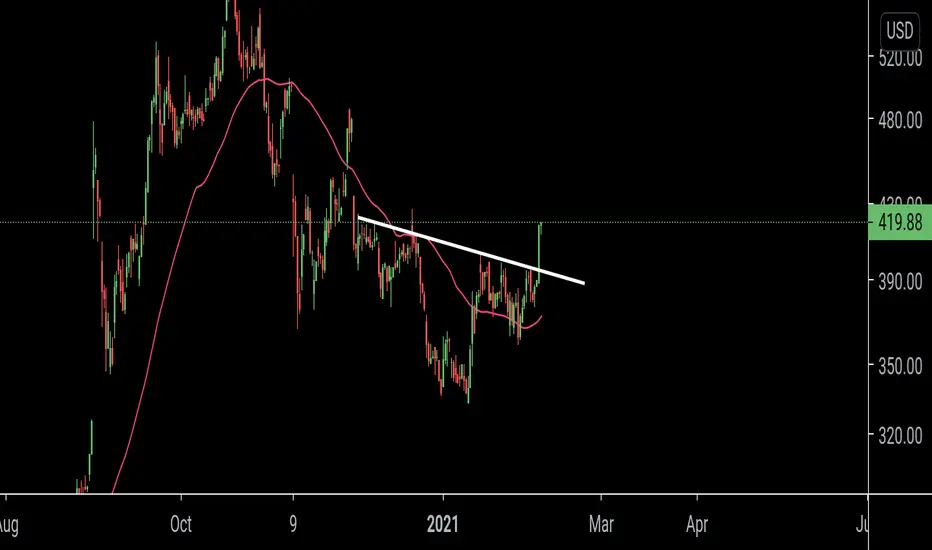
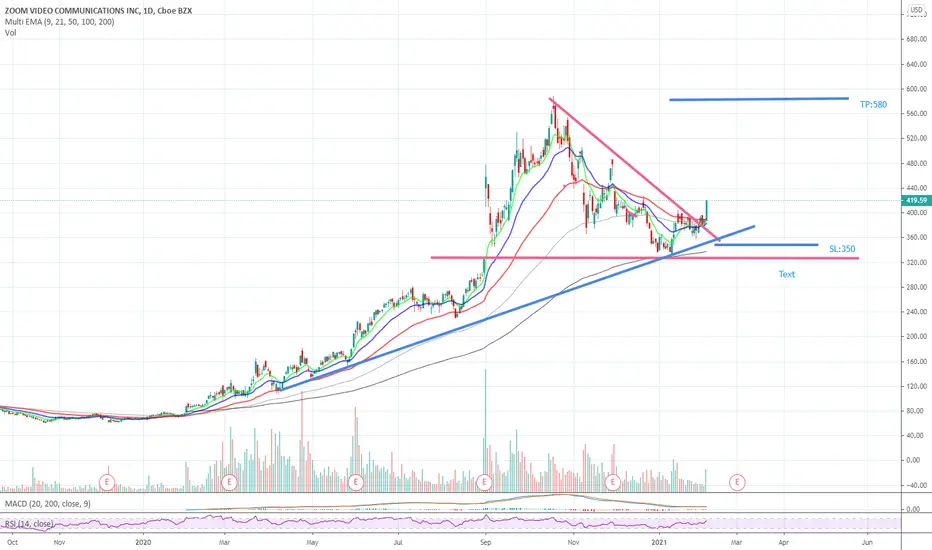
Zoom Breaking out of downward channelI'm a noob and would like some feed back on this daily chart set-up and analysis. To me looks it like zm has broken out its downward channel since october highs, broken a little resistance at $400 and has momentum going into earnings on 3/1/21, possible entry on the next pullback? Feed back and criticism would be greatly appreciated. Thank you.
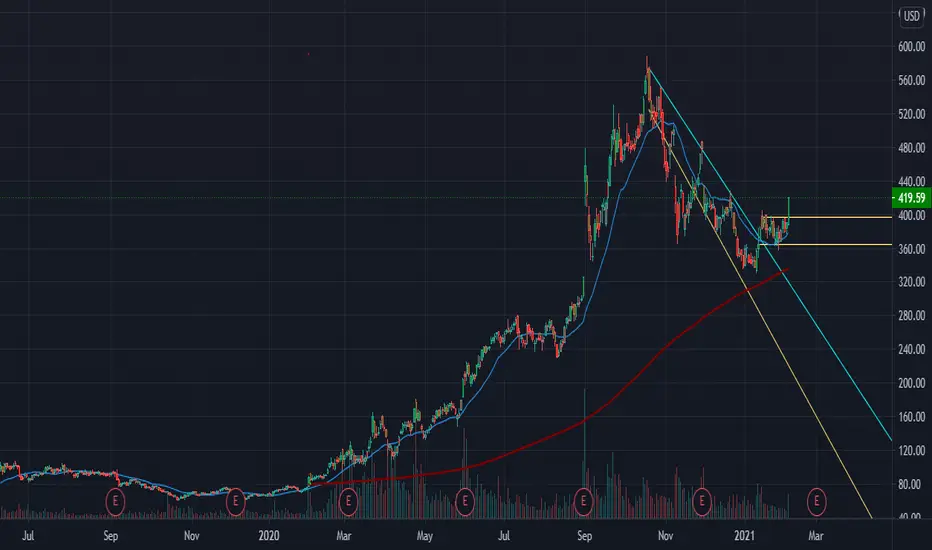

ZM - February 6, 2021ZM has finally broken the long downtrend put in from October with volume. After a touch of the 200 day EMA, ZM can continue higher on a strong trend to test ATH in the coming months. Earnings are expected to be in early March which can act as a catalyst for pushing the stock higher.

ZM Weekly cross 3&8 EMA but this time the Fisher is Positive Looking at side way consolidation to be over
here are my minimum prerequisite on a weekly chart
Fisher transform Positive
3&8 ema + on Weekly
3&8 ema + on 3 Days
8&34 ema + on 178 MIN
Some basic E.W. to match
Weekly pivot respected
Wrong analysis if break 395 again in my books
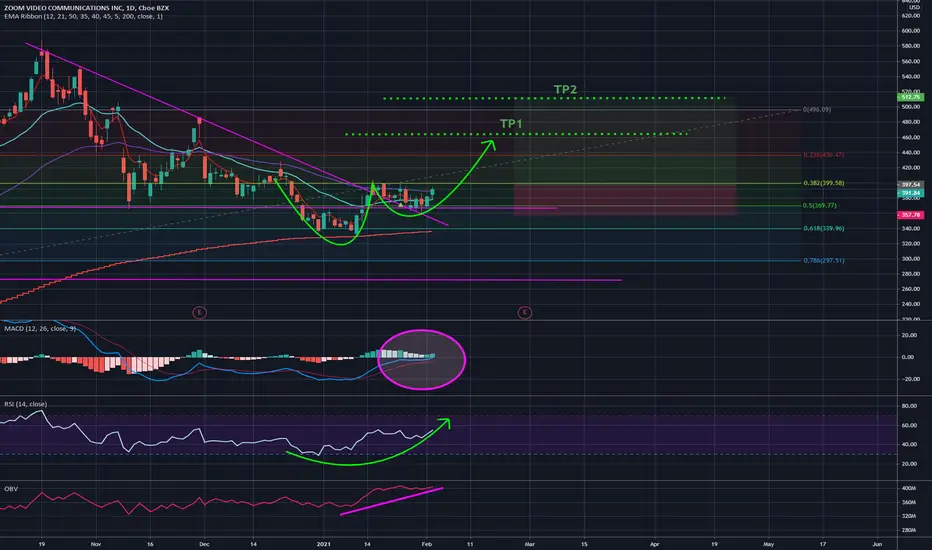
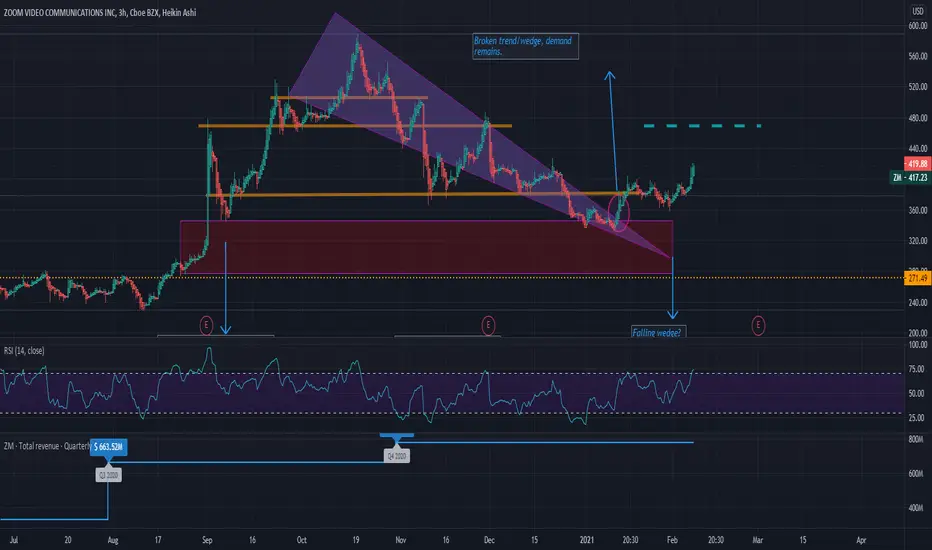
$ZM/Zoom Wedge brokenWe see a demand base at $345-$280 blocking the price to drop as a result of the falling wedge caused by the Q3-4 transition.
After the stock jumps above the wedge (breaking the trend, see red circle), we see it respecting & hovering around the 382 support established and respected at the following dates (10th December '20, 16th November '20, 10th November '20, 10th September '20, and the 11th September '20) - the price adjusts above and below the support, before starting to push upwards - showing that it *is* being used as a support and not a resistance level.
I can see the stock reaching (at least) the dotted blue line as it was used as a resistance in September and December '20 but was also used as a support back in late September and early October '20.
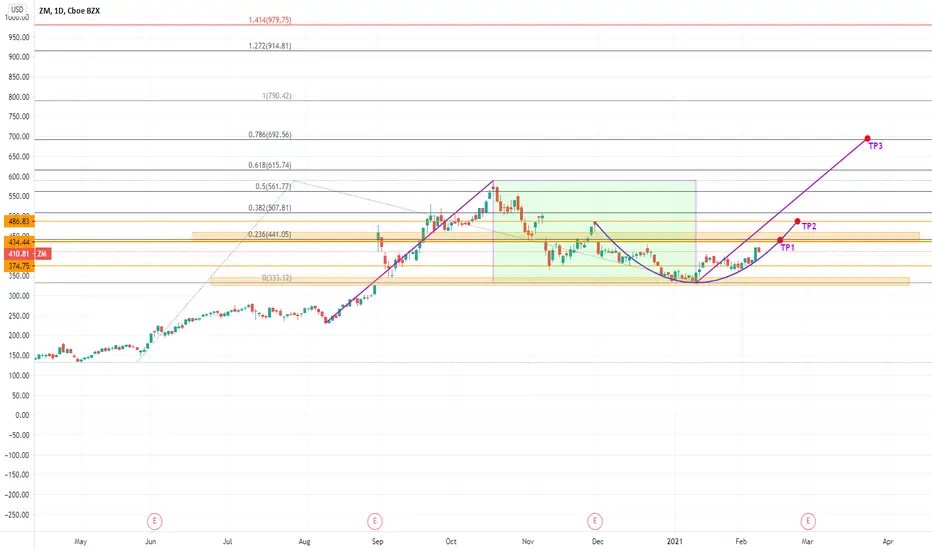
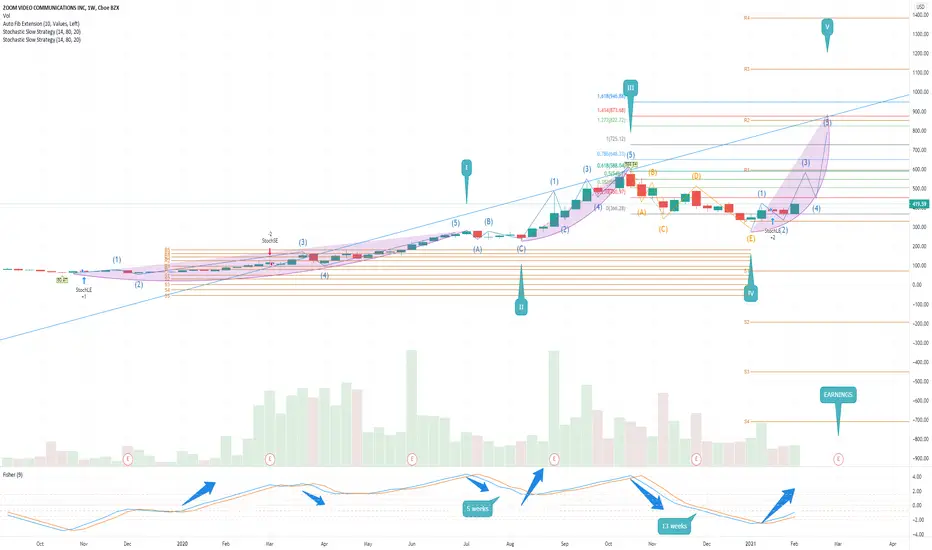
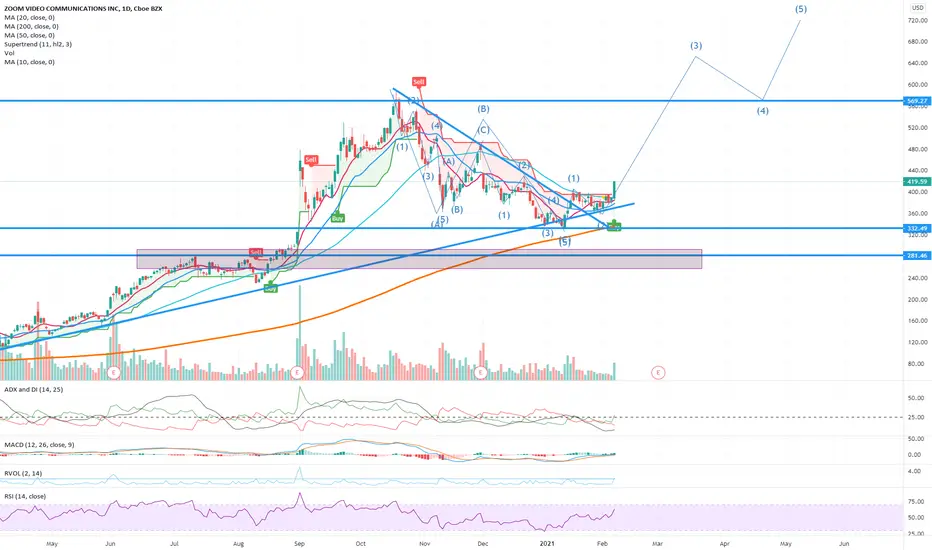
My take on ZM- On going wave 3
- Forming a inverse head and shoulders on correction waves ABC
- Price above MA50 and RSI 50

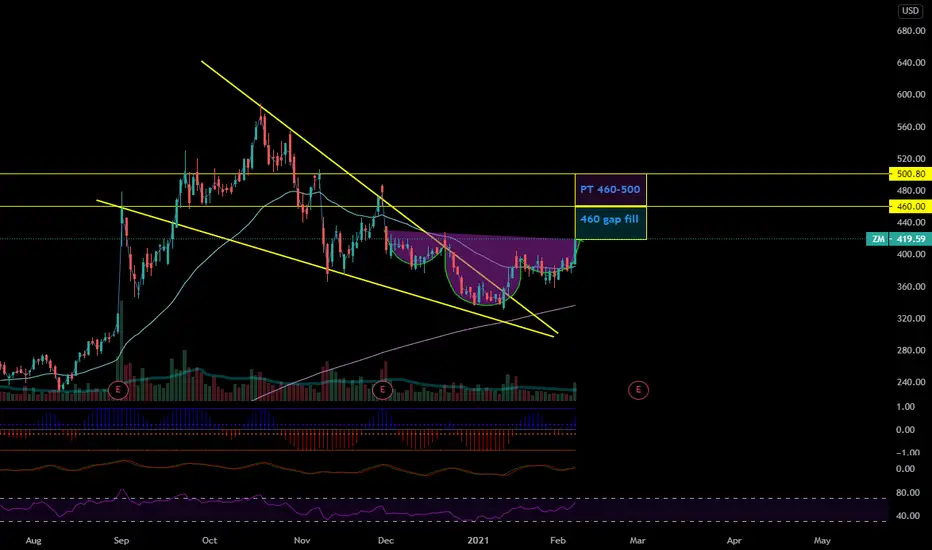
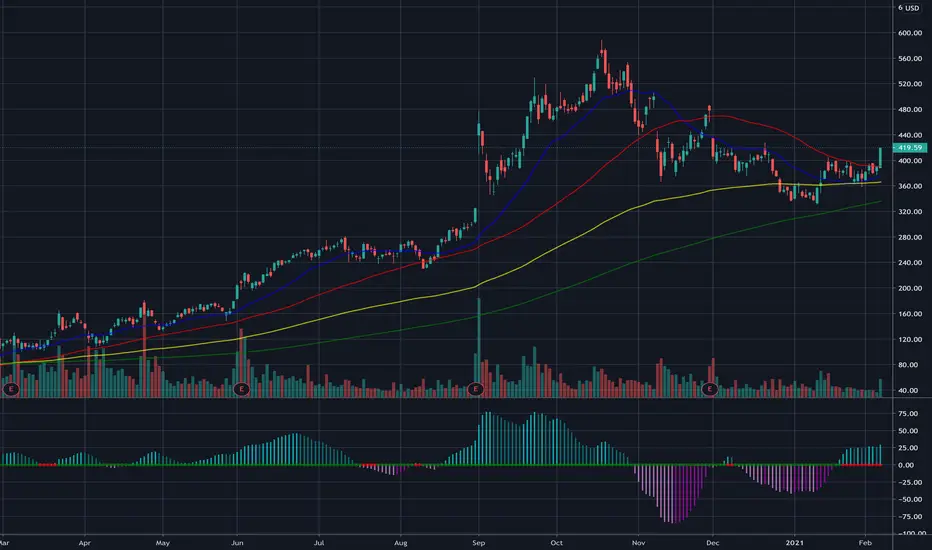
Zm LongZoom Just finished a 3 month correction .
A very nice falling wedge inside a Mega Phone, Bull market. Target is set at several levels.
very strong candle to break out of falling wedge. I only see blue skies here.
Happy Trading