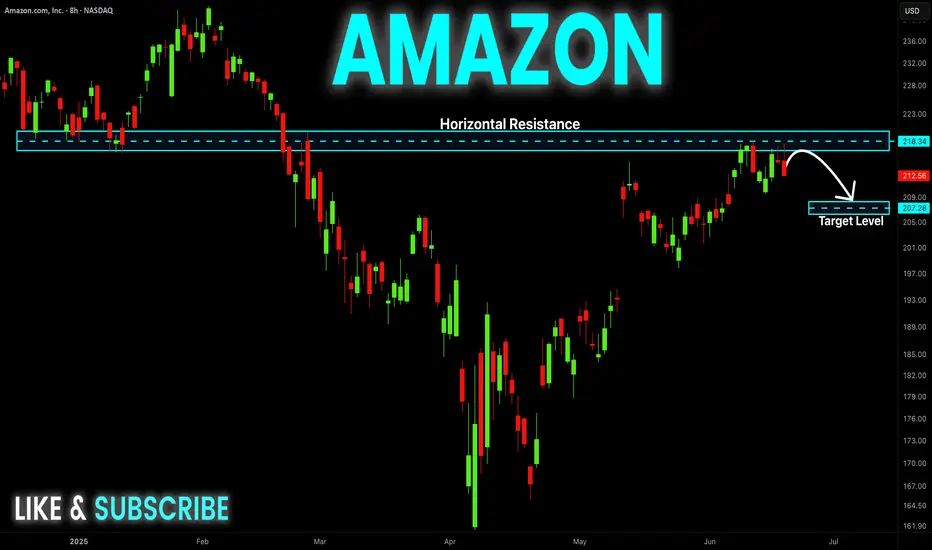
AMAZON Local Short! Sell!
Hello,Traders!
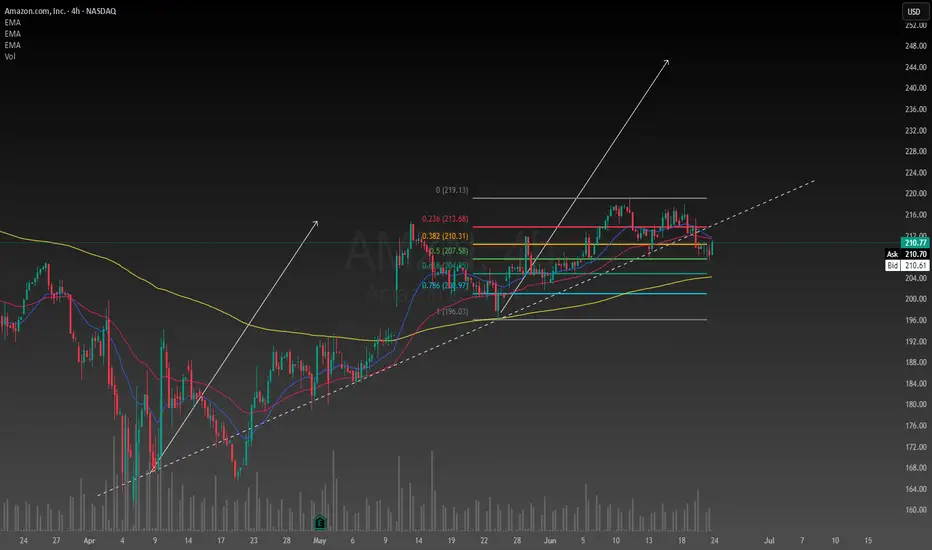
AMAZON made a retest
Of the horizontal resistance
Around 219$ and the stock
Is already making a local
Bearish pullback so a further
Bearish correction
Is to be expected
Sell!
Comment and subscribe to help us grow!
Check out other forecasts below too!
Disclosure: I am part of Trade Nation's Influencer program and receive a monthly fee for using their TradingView charts in my analysis.
AMZ trade ideas
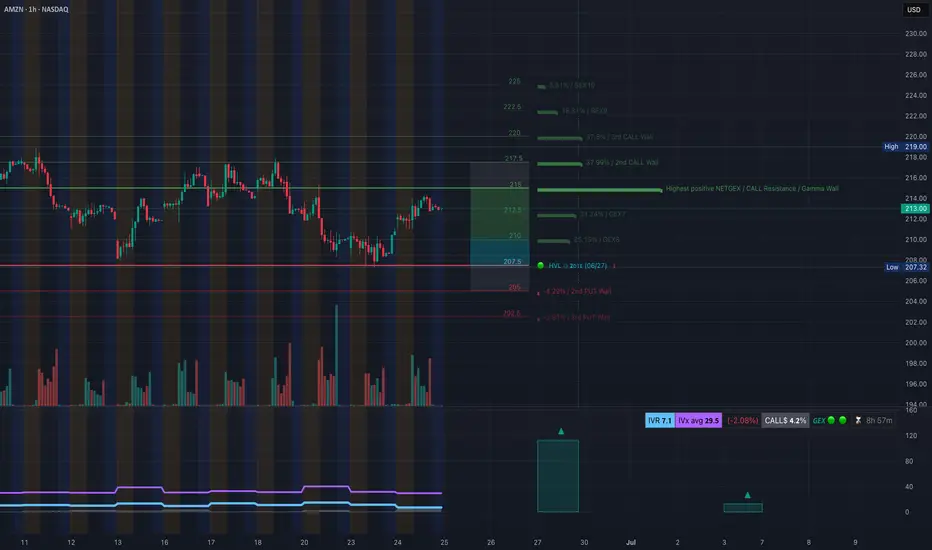
AMZN Heating Up – GEX Shows There's Room to Run!
Alright, guys – here's the scoop on Amazon (AMZN) right now based on the latest GEX map and price action.
🧠 GEX Setup:
We’re seeing solid call gamma buildup from 213 → 220, and a strong positive NET GEX wall near 215–217. That tells us market makers might start pushing price toward those high-gamma zones to hedge, especially above 213. Gamma support kicks in from 210 down to 207, so bulls have a nice cushion below.
👉 IVR 7.1 is low, and calls flow is healthy at 4.2%, meaning option premiums are still pretty cheap – great time to consider buying options before a possible breakout push.
🎯 Options Strategy:
If you're looking to catch the upside gamma move:
* ✅ Buy CALLs around 213–215 strike
* 🎯 Target 217.5 or 220+
* ⛔ Stop below 210 or HVL zone
You want to be in before the gamma snowball effect starts pulling price up.
🧩 Price Action & Smart Money Structure:
The 1H chart is showing strong SMC structure:
* BOS confirmed ✅
* Higher low forming
* Choppy flag forming just under resistance — could break out soon
We have clear liquidity above 214–217 (old OB zone), so price may hunt that next. There’s a big imbalance left from the selloff — if we get a retest of the green OB at 210–211 and hold, that's your confirmation for a solid long entry.
📌 Trade Idea Summary:
* Bias: Bullish short-term
* Entry Zone: 211–213
* Target Zone: 217.5 → 220
* Stop: Below 208
* Option Play: Calls (1–2 DTE or next week)
If 213 holds and volume picks up, we could ride the gamma wave right into those high OI strikes. 🔥
Disclaimer: This is not financial advice. Just one trader’s view using GEX and smart money price action. Always manage risk and size appropriately.
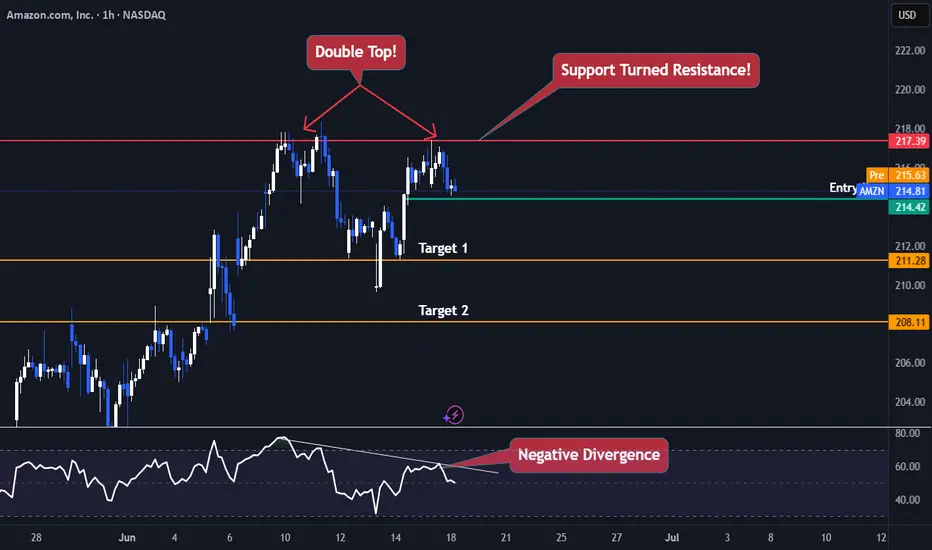
AMAZON TROUBLENASDAQ:AMZN Is currently trading Just 11% below its all time high and currently Facing exhaustion.
Amazon is currently trading 217$ range which was previous support now turned resistance (Daily Timeframe) , making a double top pattern and a negative divergence on the RSI.
The best Trades are the ones with multiple confirmations
- Trading at a resistance (1D chart)✅
- Negative Price Action at the resistance (Double Top Pattern)✅
- RSI negative divergence✅
- Market Structure ✅
Entry Criteria
- A Red candle at the entry Line Marked
- Stoploss Above the Entry Candle
Target 1- 211$
Target 2- 208$
Keep Your Risk Reward Intact! Not An investment Advice
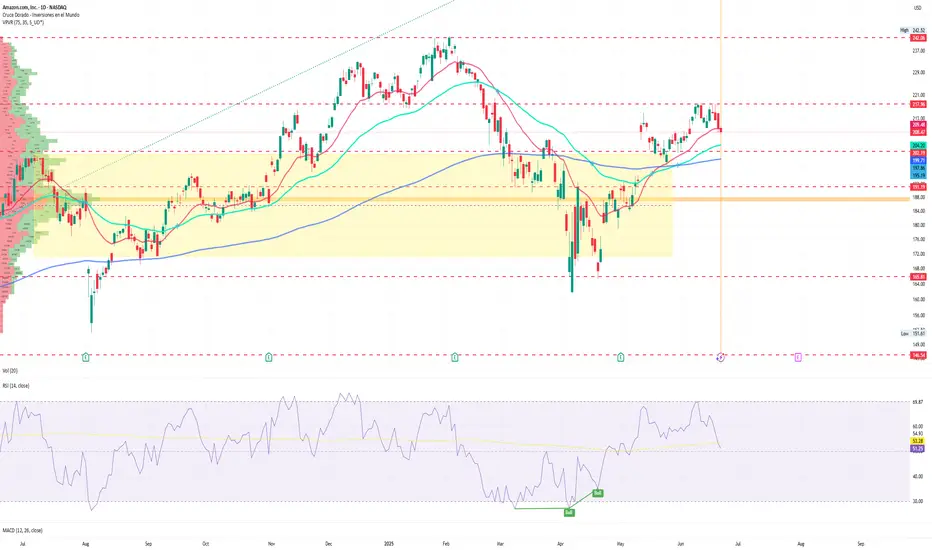
Amazon: Continuing to RiseWith Amazon’s recent climb, prices are edging closer to the top of wave (1) in magenta. However, there is still a bit of upside potential in the short term before wave (2) makes its corrective move. Our primary scenario does not anticipate a new low below $160.50. Instead, we expect wave (3) in magenta to eventually surpass resistance at $242.52. Under our alternative scenario, there is a 30% chance we could see new lows below $160.50. In this case, wave alt.B in beige would have peaked at $242.52, prompting us to focus on a magenta downward impulse.
📈 Over 190 precise analyses, clear entry points, and defined Target Zones - that's what we do.

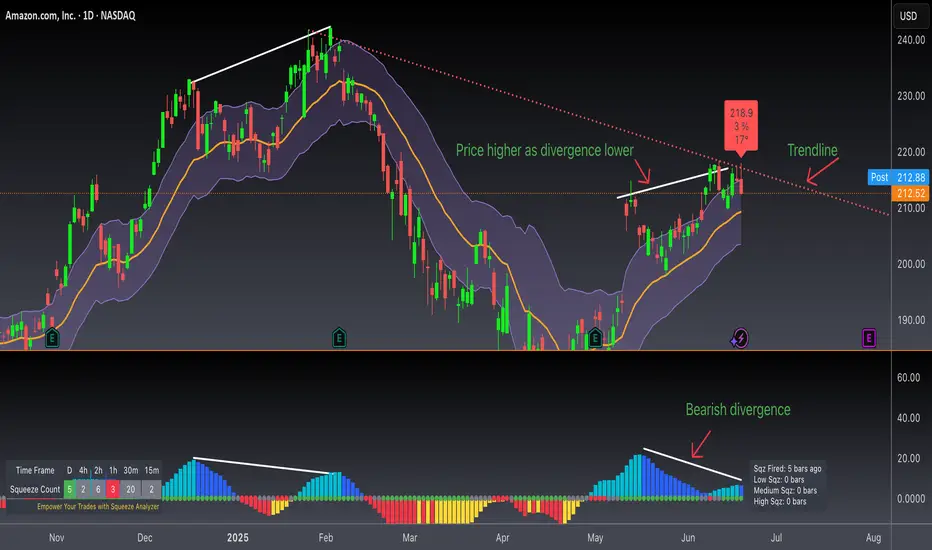
$AMZN Rolling Over?Amazon is showing a bearish divergence and looks like it's ready to roll over. Of course this is contingent on other global factors, but the last time we saw a bearish divergence, there was a drop that followed.
Not financial advice, good luck to all :)
Amazon swing trade ideaAmazon has fallen below its trendline and started to dip slightly despite the fact that the broad market is going higher. I have found an opportunity for a decent long entry and have ran the numbers, the intrinsic value of Amazon right now is between $180 and $520. Not only is it a retail giant but is an emerging technology innovator and investment company. I got about 4% of my portfolio allocated to it now.
Imbalance, FVG & Short Trend Flag Strategy / Estrategia basada..*************************
* ENGLISH VERSION *
*************************
This analysis blends institutional structure with price action to identify high-probability zones on AMZN.
🔍 Setup Structure:
Imbalance breaks PH/L of the trend: Confirmation of institutional strength breaking a Previous High or Low, creating a liquidity imbalance.
Short Trend Flags: A corrective flag pattern within the impulse move, signaling continuation until the Fair Value Gap (FVG) is filled.
FVG Closure: Validates key zones where price must return to restore market balance.
IFVG: Institutional Fair Value Gap that also needs to be closed, showing deeper order flow activity.
Key Resistance & Support Zones: Act as liquidity magnets where price often reacts.
9:30am Opening Candle Against the Trend: This candle acts as a liquidity trap and potential reversal trigger.
🧠 Technical Notes:
FVG and IFVG used as targets and reaction zones.
Confirmation through opening volume and candlestick behavior.
Flags serve as entry triggers in trend direction.
🎯 Perfect for scalpers and day traders who trade clean structure with multi-layered confirmations (structure + liquidity + reaction).
*************************
* SPANISH VERSION *
*************************
Este análisis combina estructuras institucionales con acción del precio para identificar zonas de alta probabilidad en AMZN.
🔍 Estructura del Setup:
Imbalance rompe PH/L de la tendencia: Confirmación de fuerza institucional al romper un Previous High/Low, generando desequilibrio de liquidez.
Short Trend Flags: Patrón correctivo dentro del impulso que sirve como señal de continuación hasta cerrar el FVG (Fair Value Gap).
Cierre de FVG: Validación de zonas de interés donde el precio debe retornar para balancear el mercado.
IFVG: Imbalance Fair Value Gap que también necesita ser cerrado, indicando profundidad institucional.
Zonas clave de resistencia y soporte: Actúan como imanes de liquidez donde el precio suele reaccionar.
Apertura 9:30am contra la tendencia: Vela que actúa como trampa de liquidez y posible gatillo para reversión.
🧠 Notas Técnicas:
Uso de FVG y IFVG como targets y zonas de reacción.
Confirmación con el volumen de apertura y comportamiento de las velas.
Flags como patrón de entrada para seguir la dirección dominante.
🎯 Ideal para scalpers y day traders que siguen estructuras limpias con validaciones múltiples (estructura + liquidez + reacción).

Amazon ($AMZN) – Bullish Breakout WatchPublished by: Wavervanir_International_LLC
🗓️ May 19, 2025 | 1D Chart
Amazon is showing strong momentum with a confirmed break above the $200.92 resistance zone (now flipped support). The price is currently consolidating around the 0.786 Fibonacci level ($208.21), and a clean daily close above this region could open up an impulsive move toward the 1.618 Fib extension at $233.99 and the key resistance level of $239.23.
🔍 Key Levels to Watch:
🔹 Support: $200.92
🔹 Resistance: $208.21 → $214.84 → $233.99
🔹 Final Target (Short-term swing): $239.23
🎯 Bullish Fib Extensions: 1.618 ($233.99), 2.618 ($264.98), 3.618 ($295.97)
📊 Setup Rationale:
Bullish structure with higher lows forming since May.
Breakout above major supply zone.
Clean Fibonacci confluence for upside targets.
Volume confirmation and market momentum favor upside continuation.
🚨 Disclaimer:
This is not financial advice. Always perform your own due diligence. This chart is for educational purposes under Wavervanir DSS guidance.

Amazon getting ready for another leg downAmazon is now in consolidation mode right below the 200MA which also happens to line up with a previous area of resistance. As long as it continues to consolidate below the 200MA, look for another leg down. If it breaks above the 200MA and closes an entire candle above then that would cancel the bearish set up.
Nothing good ever happens below the 200

Amazon “All-In” on UK InvestmentIon Jauregui – Analyst at ActivTrades
Amazon announced on Tuesday an ambitious £40 billion investment in the United Kingdom over the next three years. The goal: to boost technological innovation, expand its logistics network, and strengthen the infrastructure needed for artificial intelligence development across Europe.
According to the company, this investment will contribute approximately £38 billion to the UK’s GDP and includes the construction of four new fulfilment centres, delivery stations, and upgrades to Amazon’s more than 100 existing operational sites in the country. Part of this expansion will create 4,000 new jobs in Hull and Northampton, in addition to new roles in the East Midlands and other regions.
A significant portion of the plan includes the £8 billion previously announced in September 2024 for AWS data centre development through 2028. This move reinforces Amazon’s commitment to cloud computing leadership and AI-driven services.
UK Prime Minister Keir Starmer described the announcement as “a huge vote of confidence in the UK as a place to do business,” while Amazon CEO Andy Jassy highlighted the company’s steady growth in the country over the past 27 years.
Fundamental Analysis: Strong Results with a Cautious Outlook
As of yesterday’s close, Amazon (NASDAQ: AMZN) shares slipped by –0.62%, ending the session at USD 208.47. However, the Q1 2025 financials reveal a robust growth trajectory:
• Revenue: USD 155.7 billion (+9% YoY)
• Net Income: USD 17.1 billion (+64%), with EPS at USD 1.59
• AWS: USD 29.3 billion in revenue (+17%), with an operating margin near 40%
• Amazon Ads: USD 13.9 billion (+19%), consolidating as a key revenue driver
• Operating cash flow: USD 113.9 billion over the last 12 months
Despite this strength, the company issued a conservative outlook for Q2, which applied some pressure on markets: operating income is expected between USD 13.0 and 17.5 billion, below analysts’ consensus.
Technical Analysis: Solid Support, But Breakout Needed
From a technical standpoint, Amazon maintains the bullish structure initiated in November 2023. It is currently trading near the technical resistance range of USD 191–218, a breakout above which could pave the way toward the current high of USD 242.52.
• Key support: USD 202.04
• Moving averages: The 50-day MA is above the 200-day MA, and the 100-day MA has remained consolidated above both since the bullish crossover on May 30
• RSI: Neutral (~51%), providing room for further upside after the last failed attempt to break the USD 217.96 resistance
A confirmed break above USD 218 could signal a renewed expansion phase. Conversely, a drop below the USD 200 mark would test the bullish channel and could lead to a correction toward the current point of control near USD 187, or even lower toward USD 165, which marks the current technical floor.
Conclusion
Amazon combines operational strength with a long-term strategic vision in Europe. Its commitment to the UK—through investment in logistics, technology, and sustainability—reinforces its role as a key player in the continent’s digital transformation. In the markets, despite a cautious guidance, Amazon’s fundamentals remain solid, and its stock continues to offer opportunities in a stable growth environment.
*******************************************************************************************
The information provided does not constitute investment research. The material has not been prepared in accordance with the legal requirements designed to promote the independence of investment research and such should be considered a marketing communication.
All information has been prepared by ActivTrades ("AT"). The information does not contain a record of AT's prices, or an offer of or solicitation for a transaction in any financial instrument. No representation or warranty is given as to the accuracy or completeness of this information.
Any material provided does not have regard to the specific investment objective and financial situation of any person who may receive it. Past performance is not reliable indicator of future performance. AT provides an execution-only service. Consequently, any person acting on the information provided does so at their own risk.
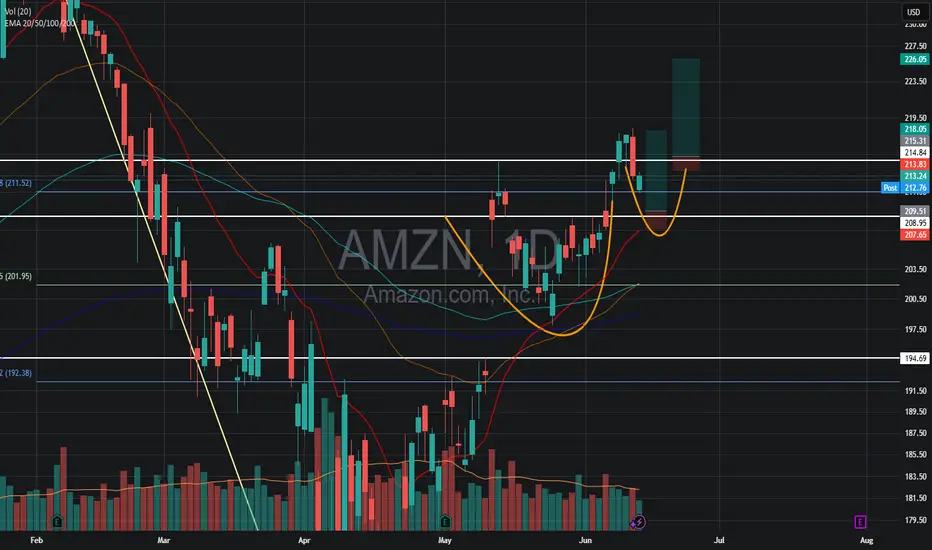
AMZN: Daily Trend Change with Bullish Continuation Setup
🗓 Published: June 26, 2025
📍 Ticker: NASDAQ:AMZN – Amazon.com Inc.
🕒 Timeframes: Daily & 4H
📊 Technical Bias: Bullish
📈 Trend: Higher Highs & Higher Lows
🧠 Analysis Summary
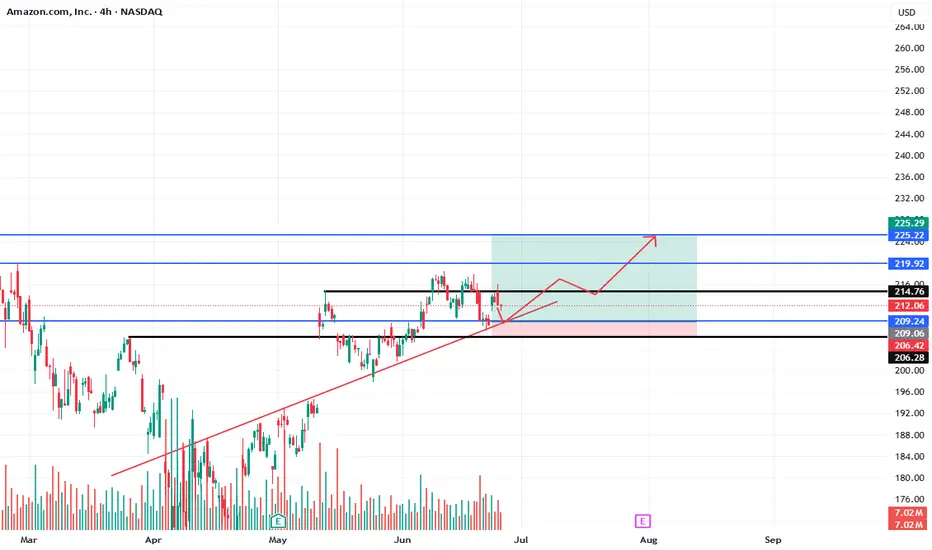
Amazon has successfully reclaimed a bullish market structure on the daily chart by forming higher highs and higher lows since late April. Price is now retesting a key support zone around $209–$212, which aligns with both horizontal support and the rising trendline.
On the 4H chart, the price is stabilizing near the trendline support, offering a high-probability long entry setup if the current structure holds.
📍 Key Levels
Price Level Description
206.28–206.42 Key support zone (invalidation area)
209.06 Local demand area
212.06 Retest level, potential entry
214.76 Local high / minor resistance
219.92 Intermediate target zone
225.22–225.29 Main bullish target / resistance
✅ Trade Setup
Entry Zone:
🔵 Long between $209.00 – $212.00 on confirmation of support
Take Profit Targets:
TP1: $214.76
TP2: $219.92
TP3: $225.22–225.29
Stop Loss:
🔴 Below $206.00 (break of structure + trendline invalidation)
Risk:Reward Potential: ~1:2.5
🔍 Confluence Factors
Daily trendline acting as dynamic support
Demand zone overlap at $209
Volume spike near base, suggesting buyer interest
Higher low formation + potential breakout of local range
⚠️ Risk Note
Only valid if price holds the $209–$212 demand area. If $206.00 is broken with strong bearish candles, the long setup is invalidated and a reassessment is required.
💬 Do you think AMZN will reclaim $225 by earnings? Let me know your outlook!
🚀 Stay patient, follow price structure, and manage your risk properly.
Rendon1
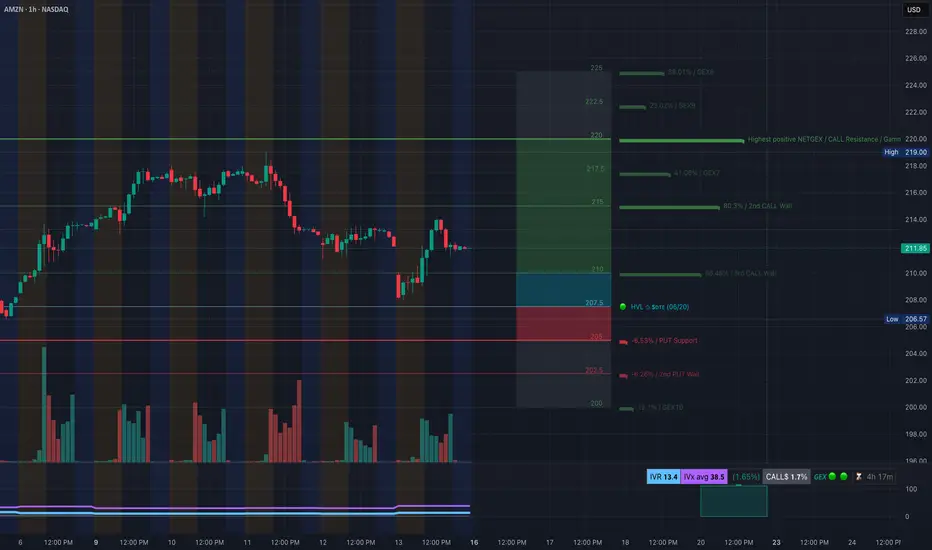
AMZN Quick Take: GEX & Chart Analysis- jun 161️⃣ Gamma Context (1‑Hour Chart)
* Call gamma wall clusters around $214–220, with the strongest resistance near $218–220—dealers may hedge/delta-neutralize here, creating selling pressure at that zone.
* Implied volatility is low (~13%) relative to average (~38%), making call spreads cheaper and appealing for defined-risk entries.
* Option setup suggestion: Consider a bull call spread around the $215–220 strike range. This targets the gamma resistance while managing risk—ideal in a low-IV environment.
2️⃣ Price Structure & Momentum (15‑Min Chart)
* Support: The $208–210 level has held twice, reinforced by a rising trendline—suggests short-term bullish structure.
* Resistance breakout occurred above the $214–217 supply box, confirming a short-term bullish shift (BOS). A strong volume breakout through this zone supports further upside.
* Key red flags: A breakdown below $208 or the trendline could invalidate the bull scenario, pushing price back toward $205 or lower.
3️⃣ Trade Logic & Execution
* Bullish Scenario: If AMZN holds above $210 and cleaves through $214–217 with conviction, initiate a $215–220 call spread with 5–10 days to expiration. This plays momentum toward the gamma ceiling.
* Risk Definition: Use a stop-loss just below the $208–210 trendline support. Breakdown triggers consideration for a bear put spread targeting $205, while maintaining risk discipline.
💡 Why This Setup?
* Gamma walls guide momentum: Targeting the $220 resistance uses options to your advantage while respecting dealer positioning.
* Low IV = cost efficiency: Spread premiums are cheaper, reducing breakeven pressure and making directional plays more attractive.
* Chart structure aligns: Support and breakout structure underpin the bullish thesis, giving confidence to engage defined-risk setups.
⚠️ TradingView Disclaimer
This analysis is educational, not financial advice. Options trading involves substantial risk and may not be suitable for all investors. Always manage your position size, set stop-losses, confirm price action breaking structure, and be cautious around news or earnings events.
AMZN on WatchLooking for a pull back to around $209.50 or a break out above $215.
Why:
20EMA and $209 resistance are lining up
On an uptrend
Possible Cup and Handle forming
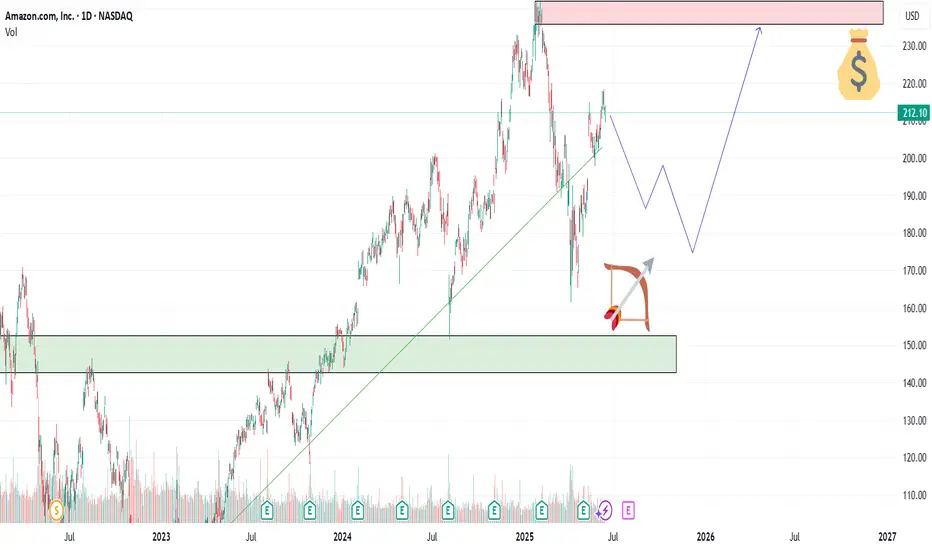
AMZN — Accumulation Zone or Just a Healthy Pullback?📦Amazon (AMZN) is offering an interesting opportunity after a healthy correction from its 2025 highs. With continued AWS expansion and aggressive investment in AI infrastructure, the fundamentals remain solid — but short-term volatility opens the door for strategic entries.
🎯 Entry Points
🔹 $194 – First key support, ideal for early buyers
🔹 $187 – Strong technical congestion zone
🔹 $169 – Deep value zone with higher risk/reward potential
💰 Profit Targets
✅ TP1: $210 – First resistance and psychological level
✅ TP2: $227 – Last swing high area
✅ TP3: $241+ – Full recovery path if momentum holds
🧠 Strategy Insight
This setup suits a swing trade horizon (30–60 days). Scaling into the position and adjusting stops under $160 offers a risk-managed approach. The upcoming earnings on July 31, 2025 could be the trigger for a major move — watch AWS growth numbers and forward guidance closely.
⚠️ Disclaimer: This analysis is for educational purposes only. It is not financial advice. Always do your own research and manage risk accordingly.
$AMZN - $2128.20 break for move higher. Multiple catalystAMZN - Stock rejecting daily highs at $218.20 and rejecting it trice. Long and swing calls added in the group. July has been a good month for the stock. Prime day coming in the next 2 weeks. looking for more calls above $220 for a move towards $240 and higher
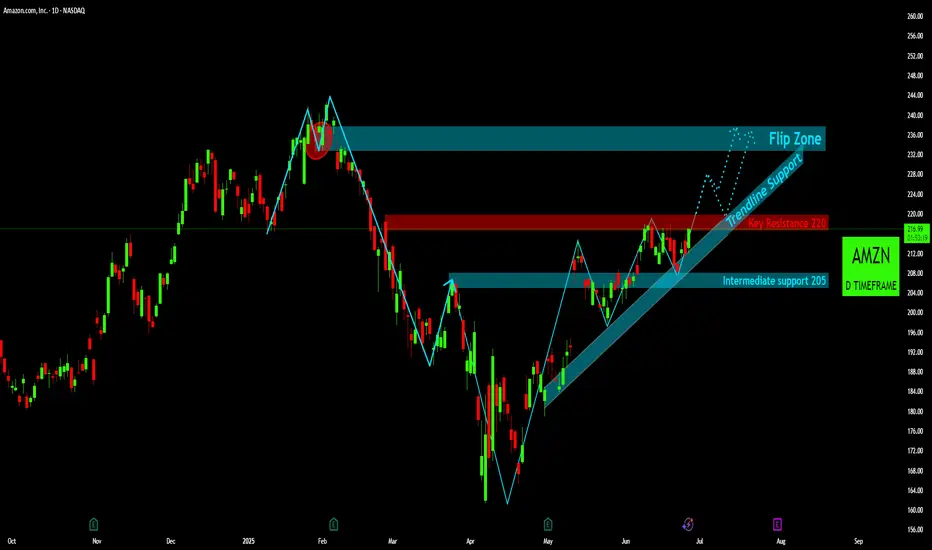
AMZN: Bullish Momentum Meets Critical Resistance - What's NextOverview:
After a significant downtrend from its early February highs (a move initiated after breaking down from the "Flip Zone" around 232−238), Amazon ( NASDAQ:AMZN ) found a strong bottom in late April. Since then, the stock has been in a well-defined uptrend, characterized by a consistent series of higher lows and higher highs.
Current Market Structure:
The price action is clearly respecting an ascending "Trendline Support" (the shaded teal channel), indicating underlying bullish strength. Each pullback has found buyers around this trendline or the identified support levels.
Key Levels to Watch:
Key Resistance 220 (Red Zone):
This is the most immediate and critical hurdle for AMZN.
The price has tested this level multiple times in recent weeks (late May and mid-June) and faced strong rejections, indicating significant selling pressure or profit-taking at this psychological and technical barrier.
A decisive break and sustained close above $220 would be a highly bullish signal, suggesting a continuation of the uptrend.
Intermediate Support 205 (Lower Teal Zone):
This level has proven to be reliable support during recent pullbacks (early June and late June).
It acts as a key pivot point; as long as price holds above $205, the bullish structure remains intact.
Flip Zone (232-238 - Upper Teal Zone):
This zone is crucial from a historical perspective. It acted as strong support in early February before the major breakdown. After breaking, it effectively "flipped" to resistance (as seen with the red circle showing a rejection).
If AMZN successfully breaks above the "Key Resistance 220," this "Flip Zone" will likely be the next major target for buyers and a potential area for sellers to emerge.
Disclaimer:
The information provided in this chart is for educational and informational purposes only and should not be considered as investment advice. Trading and investing involve substantial risk and are not suitable for every investor. You should carefully consider your financial situation and consult with a financial advisor before making any investment decisions. The creator of this chart does not guarantee any specific outcome or profit and is not responsible for any losses incurred as a result of using this information. Past performance is not indicative of future results. Use this information at your own risk. This chart has been created for my own improvement in Trading and Investment Analysis. Please do your own analysis before any investments.
AMZN Breakdown Brewing — Will $213 Hold or Slipping to $210?📈 GEX Options Sentiment (As of June 17 Close):
* Resistance Zones (CALL Walls):
* $217.5 → 2nd CALL Wall and YDH (Yesterday’s High)
* $220 → Gamma Wall (Highest Positive NET GEX)
* $222.5–225 = Upper GEX cluster (low probability unless a macro bounce)
* Support Zones (PUT Walls):
* $210 → Major gamma-supported zone
* $207.5 → GEX Pivot/Defensive line
* $202.5 = 2nd PUT Wall (Flush zone if $207 breaks)
* Options Metrics:
* IVR: 13.6 (still low)
* IVx avg: 32.7
* Put Flow: 0.6% = nearly no bearish hedging → risk of fast re-pricing
* GEX Sentiment: 🟢🟢🟢 (still stable but neutralizing)
🧠 15-Min Smart Price Action Breakdown:
* Current Price: $214.22
* Structure:
* Price rejected multiple times off ORH (216.26) and YDH (217.06), forming multiple FVGs downward.
* Currently sitting in the PML–Demand Zone at $213.65 — critical bounce or breakdown area.
* Indicators (RSI, BBP, MACD, DMI) show building bearish pressure with fear (-14.44) and oversold tag.
* Trend Confluence:
* Lower highs + FVGs stacking downward = exhaustion
* Market mode = choppy / waiting, but volatility could expand below $213
🧭 Trade Scenarios for June 18:
🟥 Bearish Breakdown Setup:
* Trigger: Breakdown and 15-min close below $213.60 (PML)
* Target 1: $210.00 (Gamma cluster + PUT support)
* Target 2: $207.50 (Critical GEX floor)
* Stop-loss: Above $215.00
Momentum + volume pickup in that zone = likely flush to gamma magnet
🟩 Bullish Reversal Setup (Fade Play):
* Trigger: Hold and bounce from $213.60 zone + reclaim $215.00
* Target 1: $216.16 (YDC/PMH)
* Target 2: $217.50 (CALL wall + YDH)
* Stop-loss: Below $213.40
Needs market-wide support from SPY/QQQ to hold up — more likely a short squeeze bounce than clean rally
🔮 My Thoughts for Wednesday:
* AMZN is sitting on the last support shelf before gamma accelerates to the downside.
* GEX is still slightly neutral/bullish but very fragile — one push below $213 and dealers start to hedge short.
* Options flow is light, but low IVR makes buying options attractive if direction is clear.
* Best play is to watch open reaction at $213.60 — either rejection confirms short, or bounce gives scalp long.
✅ Summary:
* Bias: Bearish below $213.60
* Key Level to Break: $213.60
* Gamma Risk Level: $210
* Upside Reclaim: $216.16 → $217.5
Disclaimer: This analysis is for educational purposes only. Always do your own research and manage risk accordingly.

Amazon (AMZN) at a Decision Zone! Jun 17🧠 GEX Options Sentiment Summary:
* GEX Walls & Zones:
* Gamma Wall / Resistance near $220 — heavy CALL interest.
* 2nd CALL Wall at $217.5, aligning with recent rejection.
* PUT Support strongest near $207.45, overlapping with a key demand zone.
* Negative GEX/PUT Walls cluster between $202–197, showing downside gamma acceleration risk if $207 breaks.
* Current GEX Metrics:
* IVR: 9.4 (low vol)
* IVx avg: 30.6
* GEX Signal: 🟢🟢🟢 (bullish tilt but vulnerable)
* Call Dollar Flow: 3.4% (muted call flow despite recent rally)
* Interpretation:
* GEX shows strong resistance overhead at $217.5–220 with the bulk of positive gamma above current price.
* Below $210, gamma flips negative and opens room to $202/$197 PUT walls — possibly a slippery slope on a break.
🧭 15-Minute Intraday Price Action (SMC View):
* Current Price: $213.25
* Structure:
* CHoCH confirmed from recent local high at $217.
* Price swept local liquidity and broke structure, then retraced into the supply zone (highlighted box) and rejected cleanly.
* Multiple CHoCHs around $214.08 → now acting as key support/resistance.
* Trendlines:
* Still holding the ascending trendline, but just barely.
* Break below $212.10 → $211.60 could lead to bearish acceleration.
* Volume Profile:
* Spike in bearish volume during the breakdown — institutions likely unloading.
🧪 Trade Scenarios:
✅ Bullish Setup:
* Trigger: Reclaim $214.08 (prior CHoCH zone)
* Target 1: $217.50 (CALL wall)
* Target 2: $220 (GEX gamma wall)
* Stop-loss: Below $211.50 (invalidate reclaim thesis)
Ideal if market finds support at demand + reclaim $214 with volume. Watch for higher lows and bullish divergence on RSI/MACD.
🚨 Bearish Setup:
* Trigger: Clean break below $211.60
* Target 1: $207.45 (PUT support + demand zone)
* Target 2: $202.50 / $200 (2nd PUT wall / gamma acceleration)
* Stop-loss: Above $214 (reclaim negates bearish thesis)
If the trendline snaps with confirmation, expect price to magnet to gamma-supported downside zones fast.
🎯 My Thoughts:
* We’re in a mean-reversion + options pinball range. This is a game of patience and levels.
* $214.08 is the intraday decision zone — reclaim = bounce play, reject = breakdown play.
* The market is likely to chop within $207–$217 unless broader market drives a breakout.
* For options traders, focus on $215–220 CALLs for breakout plays or $210–205 PUTs on breakdowns with short expiry for gamma moves.
🔚 Conclusion:
AMZN is at a pivot where Smart Money just reversed structure after liquidity sweep. The GEX shows resistance above and puts support below, compressing price into a decision wedge. Trade the breakout/breakdown — not the chop.
🛑 Disclaimer: This analysis is for educational purposes only and does not constitute financial advice. Always do your own research and manage your risk.

Shoulders to the Sky: Amazon’s Breakout Journey BeginsOverview
Name: Amazon.com, Inc
Ticker Symbol: AMZN
Exchange: NASDAQ
Founded: 1994
Headquarters: Seattle, Washington, USA
CEO: Andy Jassy (as of 2025)
Sector: Consumer Discretionary / E-commerce & Cloud Computing
About
Amazon is a global e-commerce and cloud services powerhouse. It dominates online retail while also operating AWS (Amazon Web Services), one of the world’s leading cloud computing platforms. Other segments include advertising, logistics, streaming, AI hardware (Alexa), and physical retail.
Fundamentals
Earnings: Amazon has consistently beaten revenue expectations with strong growth in AWS and advertising segments.Revenue: Q1 2025 revenue topped $154.8B, up 13% YoY, with solid margins.Outlook: Management has raised guidance for Q2 citing AI integration in AWS and retail efficiency gains.
Technicals
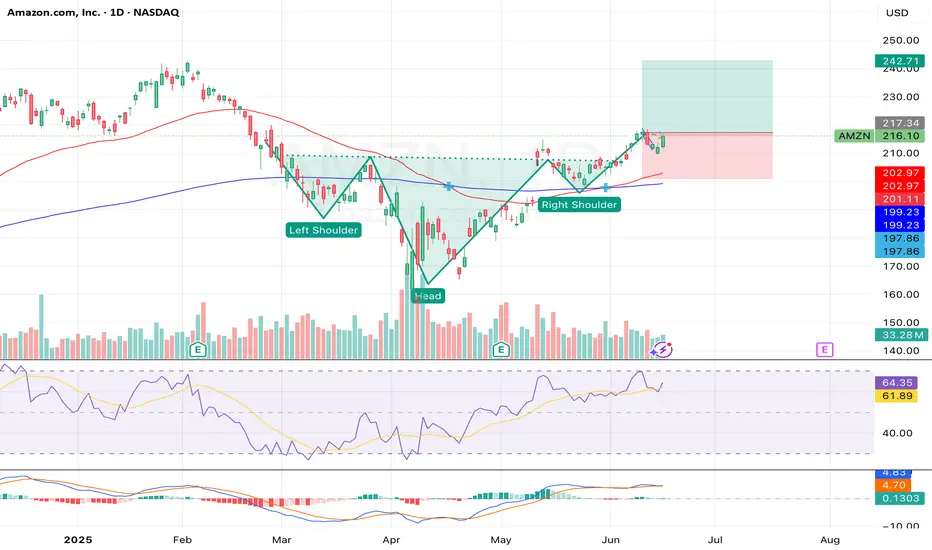
Inverted Head and Shoulders Pattern confirmed on the daily chart — a strong bullish reversal signal.
Price has broken above the neckline (~$213–$215) with volume confirmation.
Golden Cross forming on short-term MAs — bullish signal.
RSI is around 64, suggesting momentum remains but is nearing overbought.
MACD is bullish with widening divergence — supports potential continuation.
📌 Support Zones: $202, $199
📈 Resistance / Target Zones: $217 (short-term), $235 (TP), $242 (extension)
💡 My Take
AMZN is showing bullish continuation out of a textbook inverted head and shoulders — typically a strong reversal setup after a downtrend. We’ve seen the neckline break with follow-through, and volume patterns support the move.
While the RSI shows slight overbought conditions, this could lead to a short consolidation before another leg up toward $235–$242. With macro tailwinds from cloud and advertising sectors, AMZN is positioned well for a strong Q3 rally.
Position
Type: AMZN 235 Call
Expiry: July 11, 2025
Quantity: 7
Average Cost Basis: $1.00
Last Price: $0.69
Purchase Date: June 12, 2025
Total % Gain/Loss: –30%
Despite current drawdown, I remain optimistic about AMZN's momentum. The technical setup is strong, and short-term weakness is likely just healthy consolidation. I'm holding through July with my eyes on the $235 target.
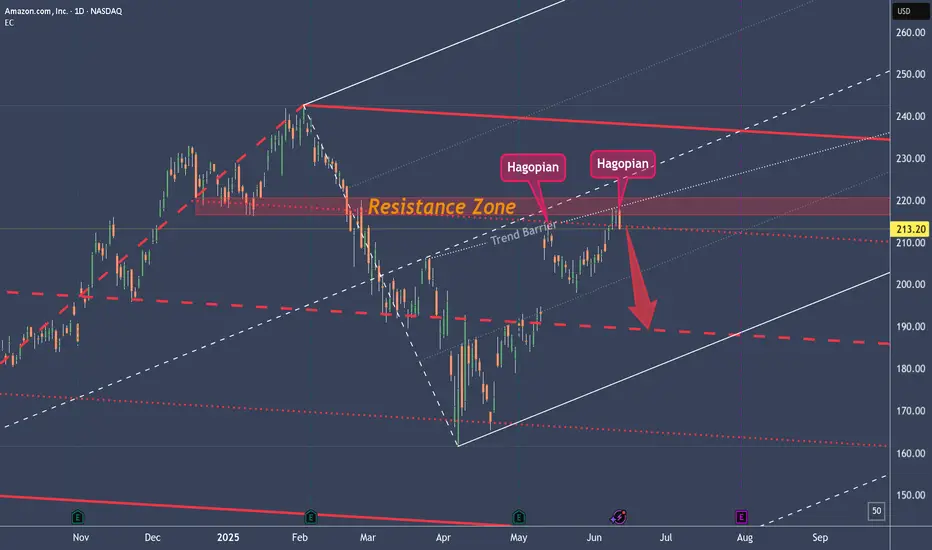
AMZN Struggles at Trend-Barrier and ResistancePrice is still in upward mode.
Why am I bearish?
1. Rejection in the Resistance Zone
2. Second Hagopian
3. Close below the Red Forks 1/4 Line
PTG1 is the Center-Line.
Potential further PTG's below at the 1/4 Line and then of course the L-MLH.
Playing it with Options which give me much more leeway. For a hard Stop I would put it right behind the last high above the TB.
AMZN: Watch for a Break Above 218.00If NASDAQ:AMZN manages to push above 217.85 , there's a strong chance we’ll see a move toward 219.96 . However, caution is advised around the 218.00 level – both premarket and postmarket sessions showed hesitation and failed to hold above that resistance.
A more conservative approach would be to wait for a clean break above 218.00 before entering.
🔍 Context:
We’re currently in a solid uptrend. On the daily chart, we’ve seen a rejection of the downside, marked by an inside bullish candle with a notable wick – suggesting upward pressure that the market may try to release. Given recent premarket activity, the 218.00 area remains a key battleground for bulls and bears alike.

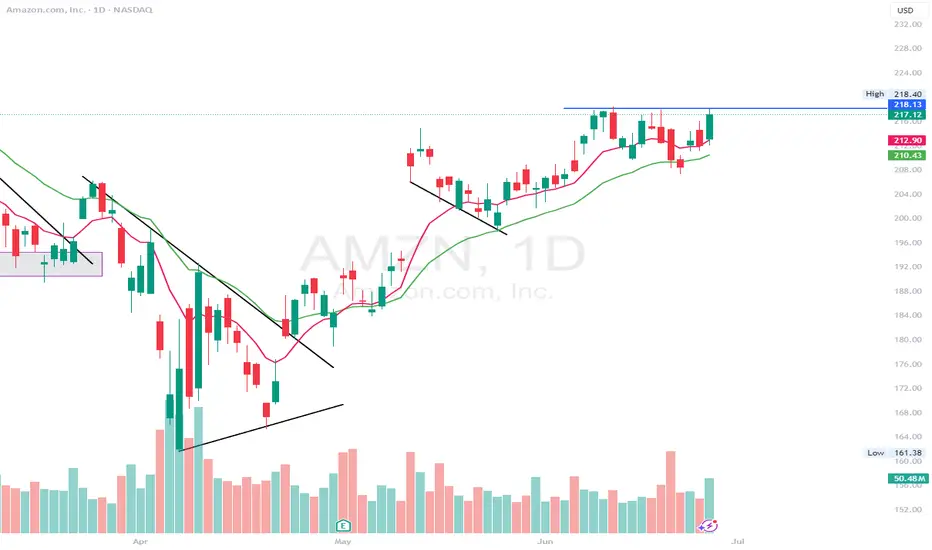
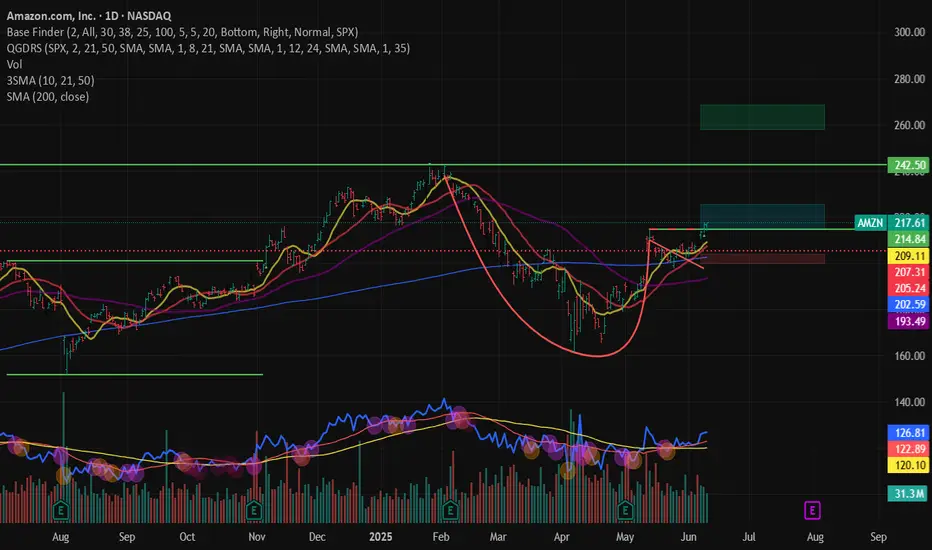
AMZN – Breaking Out From Handle in Cup & Handle BaseAmazon ( NASDAQ:AMZN ) is breaking out from the handle of a well-formed cup and handle base, offering a defined, low-risk entry with a strong technical structure.
📈 Entry Zone: 214.84 – 225.25
🛑 Stop Range: 203.88 – 197.23 (5–8% below entry, based on risk preference)
🎯 Target: 242.50
📌 Will consider adding above all-time highs if momentum builds
Price is riding above all major moving averages (10, 21, 50, 200), with bullish alignment across the board. The handle showed tight price action before this breakout, a constructive sign for continuation.
Relative strength is not leading, but it's starting to slope upward — signaling early participation. In a market where growth stocks are volatile, names like AMZN provide a more stable trend with potential for measured upside.
Fundamentally, Amazon continues to deliver across AWS, logistics, and advertising — with consistent earnings growth backing the technical picture.
UNISWAP - Long Term Buy Opportunity 🚨MartyBoots here , I have been trading for 17 years and sharing my thoughts on UNI here.🚨
UNI vs ETH | Why Uniswap Deserves a New All-Time High
In this video, we dive deep into the fundamentals of Uniswap (UNI) and explore its close relationship with Ethereum (ETH)—the blockchain it’s built on. While ETH has regained massive attention with its expanding ecosystem and institutional adoption, UNI is still massively undervalued in comparison, despite powering one of the largest DeFi protocols in the world.
⸻
Fundamentals Breakdown:
• Uniswap is the backbone of decentralized trading, facilitating billions in volume without intermediaries.
• Fee switch mechanics and upcoming v4 upgrades have the potential to drive real yield to UNI holders.
• Unlike ETH, which serves as a Layer 1 gas token, UNI represents governance and future revenue potential over a growing protocol.
⸻
Why UNI Has Upside:
• UNI still trades far below its all-time highs—even as Ethereum ecosystem activity rebounds.
• ETH has already made major recovery moves, but UNI hasn’t caught up yet—creating a bullish divergence.
• With the rise of on-chain liquidity, tokenized real-world assets, and institutional DeFi, Uniswap is positioned to be a key infrastructure layer.
⸻
My Thesis:
• ETH = Base Layer | UNI = DeFi Rail
• As ETH grows, Uniswap scales alongside it—capturing more swap volume, TVL, and governance power.
• If Uniswap activates protocol revenue, UNI transitions from a governance token to a yield-bearing asset, giving it real valuation metrics and long-term investor interest.
⸻
Watch to see my full breakdown, including:
• UNI vs ETH price chart comparison
• On-chain stats, dominance shifts, and upcoming catalysts
• Why I believe UNI is set for a breakout back toward new all-time highs
⸻
Like, comment, and follow for more deep-dive crypto breakdowns and technical setups.
#Uniswap #UNI #Ethereum #ETH #CryptoAnalysis #DeFi #TradingView #AltcoinSeason #PineScript #FundamentalAnalysis
