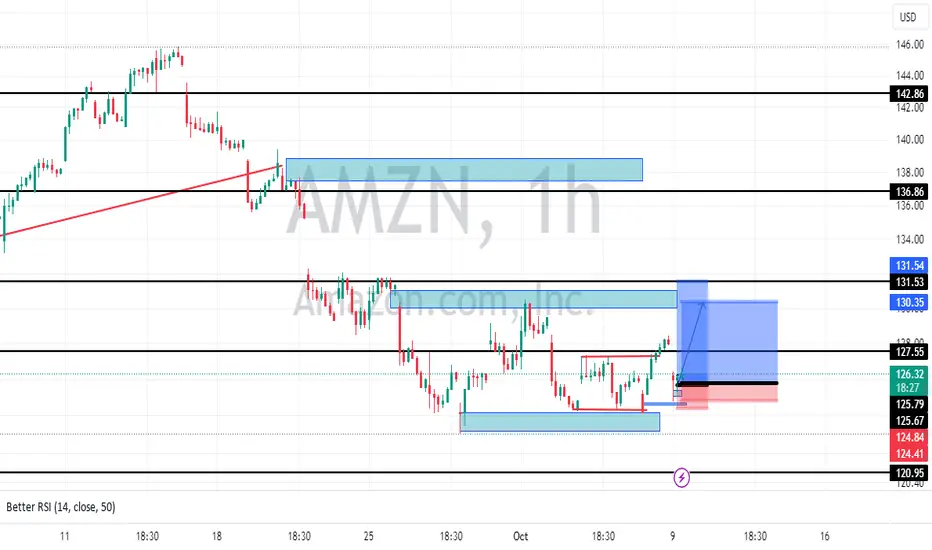
AMAZON MARKET ANALYSIS1H AMZN BUY ORDER
TARGET +44USD
Price to impulse out of liquidity.
Buy order taken after price tapped into order block.
AMZ trade ideas
AMZN bear flag. Must touch white TL before turning bullish. ~120This is a classic bear flag and trendline rejection on the daily.
There is no floor for AMZN buyers to keep the price up here.
Next floor and support is the white TL.
We also saw NASDAQ:AMZN breakout under a long term trend here. 120 is just a mini target. They'll tell you markets are turning bullish but give it 1-2 weeks until they start pumping out, "Gov Shutdown Looming" headlines again. Manipulation is common and allows the markets to be liquid. Stop falling for it.
In my opinion, today was a bull trap.
Look at the SP:SPX AMEX:SPY CAPITALCOM:US100 chart:
I said yesterday in a minds post that we'll pump to 430 then re-evaluate. I did not expect 430 to hit the next day. This is crucial and is usually a sign of weakness. Could be wrong.
Welcome to follow & trade with us - many callouts this month including NASDAQ:NVDA @ 415 NASDAQ:TSLA @ 234 NASDAQ:AMD @ 95

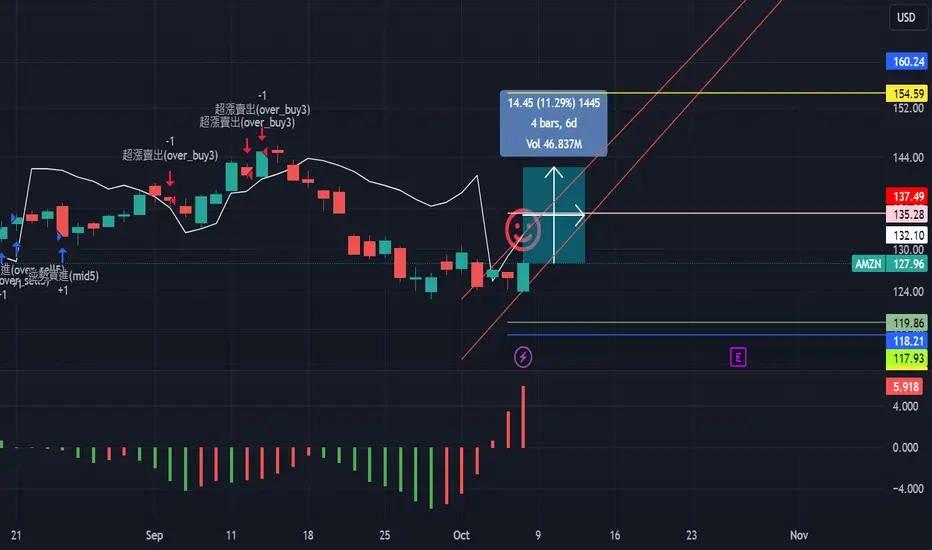
AMZN, 4d/11.29%rising cycle 11.29% in 4 days.
==================================================================================
This data is analyzed by robots. Analyze historical trends based on The Adam Theory of Markets (20 moving averages/60 moving averages/120 moving averages/240 moving averages) and estimate the trend in the next 10 days. The white line is the robot's expected price, and the upper and lower horizontal line stop loss and stop profit prices have no financial basis. The results are for reference only.
AMAZON Stock Chart Fibonacci Analysis 100723Trading Idea
1) Find a FIBO slingshot
2) Check FIBO 61.80% level
3) Entry Point > 128/61.80%
Chart time frame : B
A) 15 min(1W-3M)
B) 1 hr(3M-6M)
C) 4 hr(6M-1year)
D) 1 day(1-3years)
Stock progress : B
A) Keep rising over 61.80% resistance
B) 61.80% resistance
C) Hit the bottom
D) Hit the top
Stocks rise as they rise from support and fall from resistance. Our goal is to find a low support point and enter. It can be referred to as buying at the pullback point. The pullback point can be found with a Fibonacci extension of 61.80%. This is a step to find entry level. 1) Find a triangle (Fibonacci Speed Fan Line) that connects the high (resistance) and low (support) points of the stock in progress, where it is continuously expressed as a Slingshot, 2) and create a Fibonacci extension level for the first rising wave from the start point of slingshot pattern.
When the current price goes over 61.80% level , that can be a good entry point, especially if the SMA 100 and 200 curves are gathered together at 61.80%, it is a very good entry point.
As a great help, tradingview provide these Fibonacci speed fan lines and extension levels with ease. So if you use the Fibonacci fan line, the extension level, and the SMA 100/200 curve well, you can find an entry point for the stock market. At least you have to enter at this low point to avoid trading failure, and if you are skilled at entering this low point, with fibonacci6180 technique, your reading skill to chart will be greatly improved.
If you want to do day trading, please set the time frame to 5 minutes or 15 minutes, and you will see many of the low point of rising stocks.
If want to prefer long term range trading, you can set the time frame to 1 hr or 1 day.

"Amazon's Intriguing Stock Movement”**Amazon (AMZN): Recent Bullish Trend**
In the last five hours of trading, Amazon (AMZN) has displayed a clear bullish trend. The stock's price surged, driven by strong buying momentum and positive news surrounding the company's expanding e-commerce ventures and cloud computing dominance. Technical indicators like the Moving Average Convergence Divergence (MACD) and Relative Strength Index (RSI) both suggest a bullish sentiment. Investor optimism appears robust, and AMZN is on an upward trajectory.
Amzn 10723Amazon appears to be putting in another failed high that is about the same high as the previous attempt. I would expect a drawdown to test supports. Not sure but this thing is looking ready to fall off a cliff
AmznPennant here to close gaps..
Gaps are at.129.46 , 131.30 and lastly 135..
I think the first two gap close will come easily. 135 will be a tough gap, I'd wait for a push over 132.50 for to long the final gap close.
Entry
128
Stop loss 126.50

$AMZN2 steps for Bullish Scenario with T1S Indicator:
1. Candles Above the Green Line:
• Check that the candles on the chart are positioned above the green line of the T1S indicator. This could be an indication of bullish momentum.
2. Bars Above Zero:
• Ensure that the bars on the T1S indicator are above zero. This condition might suggest positive market sentiment or upward price movement.
2 steps for Bearish Scenario with T1S Indicator:
1. Candles Below the Green Line:
• Verify that the candles on the chart are positioned below the green line of the T1S indicator. This condition may indicate bearish momentum or a potential downward trend.
2. Bars Negative Below Zero:
• Confirm that the bars on the T1S indicator are in the negative territory and located below zero. This setup suggests a negative market sentiment or downward price movement.
Incorporating green-red line dynamics enhances criteria for authentic signals
For Bullish Scenario:
1. Candles Above the Green Line:
• Confirm that the candles on the chart are positioned above the green line of the T1S indicator.
2. Bars Above Zero:
• Ensure that the bars on the T1S indicator are above zero, indicating positive market sentiment.
3. Green Line Above Red Line:
• Verify that the green line of the T1S indicator is positioned above the red line. This relationship helps maintain the bullish scenario.
For Bearish Scenario:
1. Candles Below the Green Line:
• Verify that the candles on the chart are positioned below the green line of the T1S indicator.
2. Bars Negative Below Zero:
• Confirm that the bars on the T1S indicator are in the negative territory and located below zero, indicating a negative market sentiment.
3. Green Line Below Red Line:
• Ensure that the green line of the T1S indicator is positioned below the red line. This relationship helps maintain the bearish scenario.
These additional conditions regarding the relationship between the green and red lines act as a filter, providing more guidance to traders and investors and helping them avoid potential false signals or fake breakouts/breakdowns. It introduces a layer of confirmation to the overall analysis. As always, it's important to use such indicators as part of a comprehensive trading strategy and to consider risk management principles.

$AMZN - Can it get to 200DMA?NASDAQ:AMZN broke down from the rising wedge. The full measured move for the breakdown is $113, coincidentally aligning with the 200DMA. Can it reach that level?
$121 could provide support and serve as a potential reversal area. 👀

AMAZON --- is down over 40%! 2031 Till next ATH?The drawdown visualisation is a great tool to determine the characteristic of previous and current market conditions in whatever asset you are looking it.
Here I have drawn up AMZN priced in CPI index units rather than notional US Dollar's.
For what purpose do people allocate money to equities... but to grow a nest-egg for the your future.
But timing is everything
And we can see that AMZN is currently down over 40% priced against goods/services/expenditures
Effectively you have gotten 40% poorer
(assuming 100% allocation at the top... unlikely I know ,,, but for illustrative purposes still useful to know. ..
And the point is how during a bull market, the price doesn't deviate away from the high that much. in 2022 we have already been down 60% are we facing a price reset for risk and stalling market for the rest of the decade. It has happened many times before, so we have to assume the old adage History Rhyming.

Wyckoff Distribution EventsAfter the SOW (sign of weakness) the Wyckoff Distribution Events goes in its last phase.
LPSY—last point of supply.
After testing support on a SOW, a feeble rally on narrow spread shows that the market is having considerable difficulty advancing. This inability to rally may be due to weak demand, substantial supply or both. LPSYs represent exhaustion of demand and the last waves of large operators’ distribution before markdown begins in earnest.

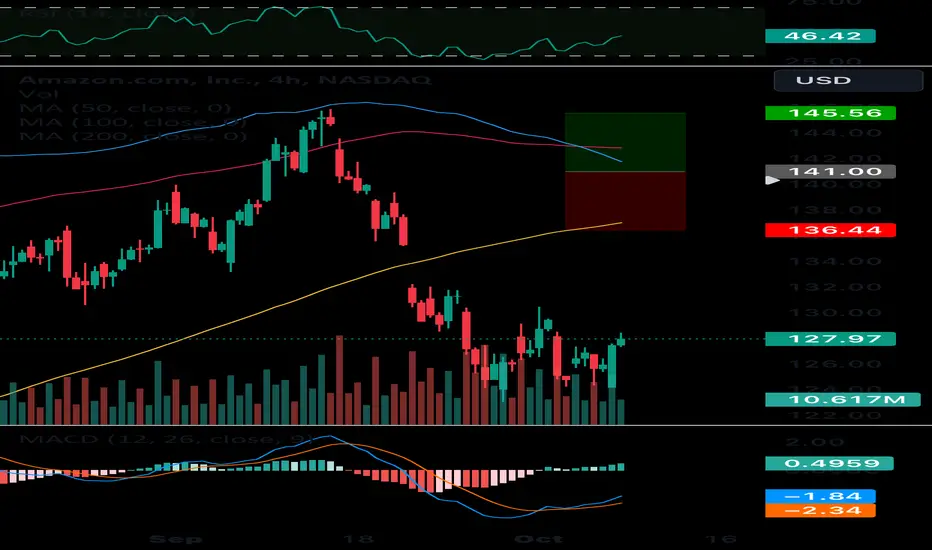
GAP OVERHEADPrice fell from the bearish rising wedge a while back.
Earnings toward end of October.
Structure that is wedge shape and is forming up, which is against the most current trend which was down.
Flags and pennants are neutral until broken and can break up or down.
Gap overhead.
No recommendation

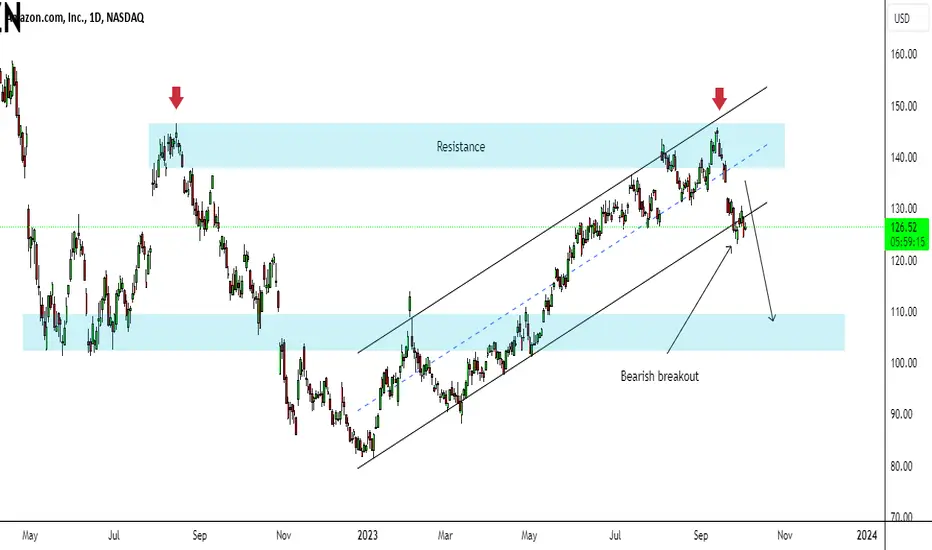
AMZN BREAKOUT ON THE CHANNELAMZN confirms a bearish breakout on the bullish channel formed. Here we see the price respected the major resistance and followed up a bearish sentiment which has caused the price to show up a breakout on the structure formed. We expect a decent price decline back towards the daily support created on the bottom.
AMZN AnalysisPrice played out nicely from my last analysis, giving us a 10.51% move to the downside, taking all the objectives. Right now, I'm expecting a continuation lower into the bullish OB at 118.60. Price could make a bullish retracement to fill the FVG above if it's unable to break the lows at 123.04, before going lower.

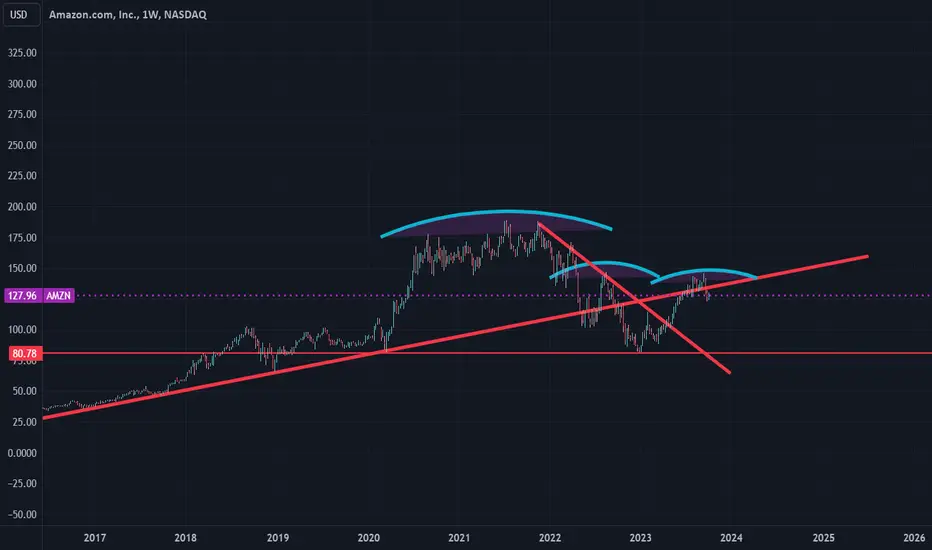
AMAZON Will easily overcome this. Buy now, low prices won't lastAmazon / AMZN has paused the aggressive rally since the start of the year and is testing the 1week MA100 as Support.
Being around the 0.618 Fibonacci level, a similar pattern where the 1week MA100 was supporting, emerged in 2007 and 2009.
You can see that it is the same sharp recovery formation, which after an aggressive rise, it accumulated on the 1week MA100 and then blasted through to the 1.382 Fibonacci extension.
It may not look like it but this price level is a buy opportunity that we might not see again any time soon. The 1.382 Fib is at $260. Late 2024 target perhaps?
Follow us, like the idea and leave a comment below!!

AMAZON LONG Amazon has reached a major support region of $80-$84 and looks like it's ready for a possible bounce to $95-$100 region.
