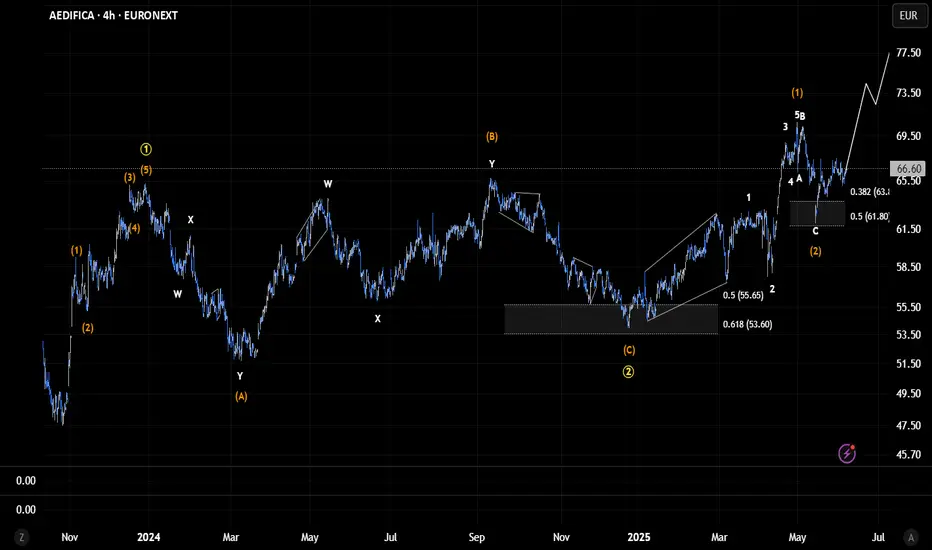
AEDIFICA - Alternative Medium Timeframe Elliot Wave analysisIn this scenario, I’m interpreting the larger Wave 1 as a potential leading contracting diagonal, where each subwave is unfolding as a zigzag (3-3-3-3-3) rather than the typical 5-3-5-3-5 structure.Currently, we appear to be in Wave 4 (Pink) of this diagonal, which seems to be in the final stages of its downward leg before starting Wave 5 the final move of the pattern. The decline in Wave 4 (Pink) may take the form of either a WXY or an ABC correction; continued price development will help validate the count.
I believe this interpretation aligns well with the recent price action, particularly because the market has been moving sideways for quite some time now without delivering a convincing impulsive move to the upside.
Disclaimer: This analysis is for informational and educational purposes only and should not be considered financial or investment advice. All trading involves risk, and you should perform your own due diligence before making any trading decisions. The author is not responsible for any losses that may arise from reliance on this content. Always trade at your own risk. #AED
AOO trade ideas
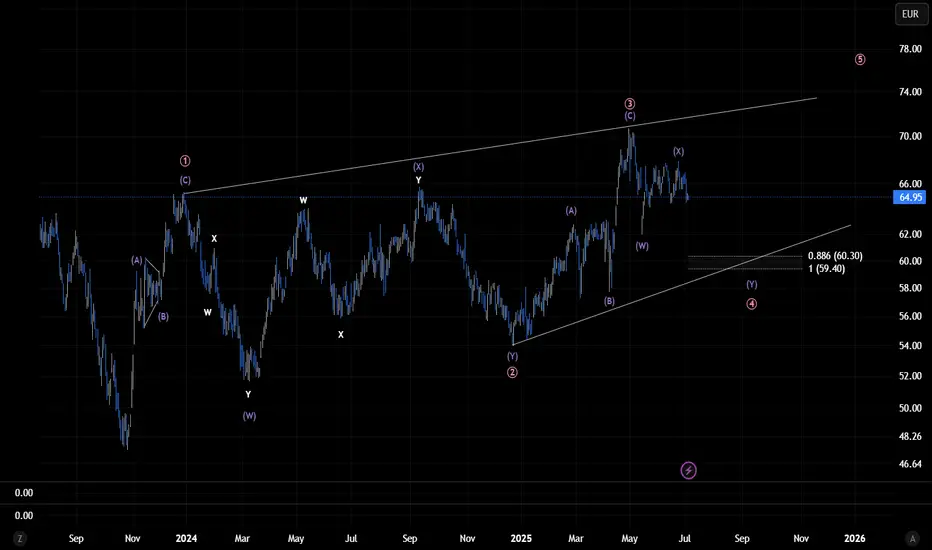
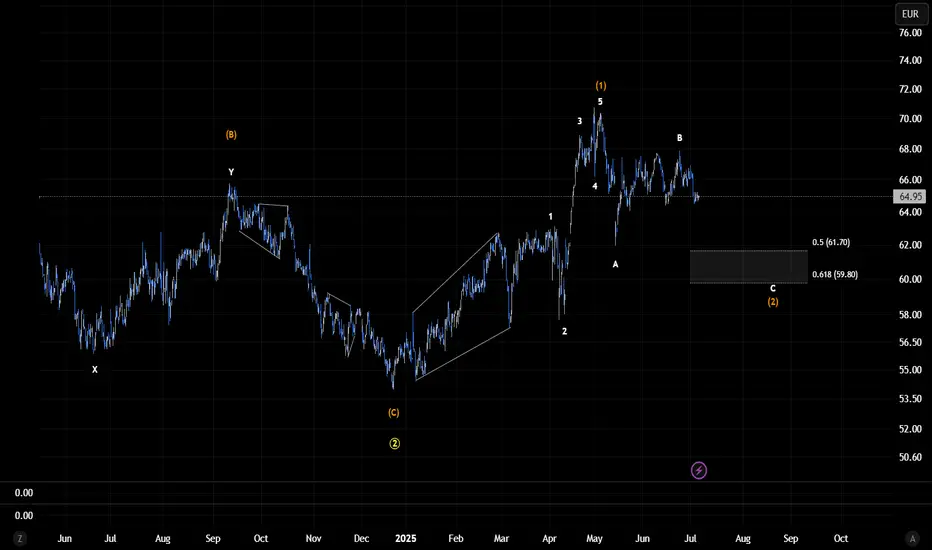
AEDIFICA - Micro Timeframe EW-Analasyis *Updated* VersionThe bigger picture remains unchanged. As mentioned in the previous count, the Orange Wave 1/2 has either completed or is very close to completion. I can now say with confidence that we're approaching the end of Wave 2, which appears to be unfolding as an ABC correction within that second wave.
Disclaimer: This analysis is for informational and educational purposes only and should not be considered financial or investment advice. All trading involves risk, and you should perform your own due diligence before making any trading decisions. The author is not responsible for any losses that may arise from reliance on this content. Always trade at your own risk.
Bullish Elliot Wave count on AEDThis is my bullish Elliott Wave count for Aedifica, which I consider the more probable scenario. The corrective structure that began in early February 2020 reached the ideal Fibonacci retracement levels for a sharp correction between 0.5 and 0.618 by October 26, 2023 (not shown in this chart), and has already unfolded over nearly four years.
Despite the fact that price action over the past year has remained largely corrective and we haven’t yet seen a clear impulsive move, I still view this as the most likely count and my preferred scenario. In my view, the yellow micro-degree Wave 1/2 has completed, and we are currently in the third wave impulse, with the lower orange-degree Wave 1/2 either completed or nearing completion.
That said, the recent upward movement still appears somewhat corrective in nature, so we should remain cautious of the potential for a larger correction which I discussed in detail yesterday.
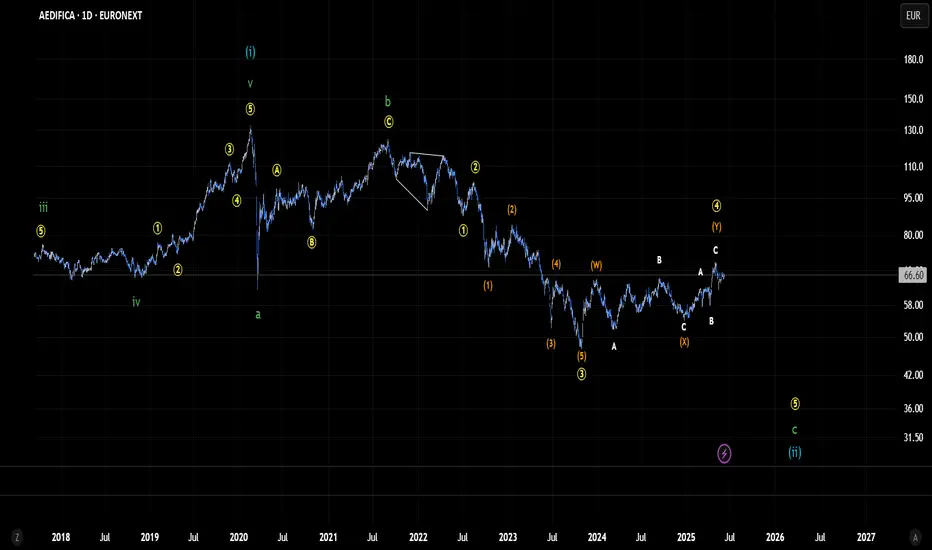
Bearish EW count on Aedifica.Last Yellow 5th wave (micro degree) to the downside to end correction that started on 18/02/2020. If prices moves beyond the ending point of Yellow wave 4, then this count would
be invalidated, suggesting that the bullish count is likely underway.
Ps: The bullish count will be posted later.