AAPL: Update - Key Levels to Watch for Price DevelopmentAAPL: Update - Key Levels to Watch for Price Development
Overall nothing changed and AAPL remains a valuable and strong structure
Apple's stock (AAPL) has been range-bound between $193 and $212.50 for the past two months, repeatedly testing support near $193 on three occasions.
Each time, the
Key facts today
Next report date
—
Report period
—
EPS estimate
—
Revenue estimate
—
5.61 EUR
84.19 B EUR
351.20 B EUR
14.83 B
About Apple Inc
Sector
Industry
CEO
Timothy Donald Cook
Website
Headquarters
Cupertino
Founded
1976
FIGI
BBG00FGWYHR4
Apple, Inc. engages in the design, manufacture, and sale of smartphones, personal computers, tablets, wearables and accessories, and other varieties of related services. It operates through the following geographical segments: Americas, Europe, Greater China, Japan, and Rest of Asia Pacific. The Americas segment includes North and South America. The Europe segment consists of European countries, as well as India, the Middle East, and Africa. The Greater China segment comprises China, Hong Kong, and Taiwan. The Rest of Asia Pacific segment includes Australia and Asian countries. Its products and services include iPhone, Mac, iPad, AirPods, Apple TV, Apple Watch, Beats products, AppleCare, iCloud, digital content stores, streaming, and licensing services. The company was founded by Steven Paul Jobs, Ronald Gerald Wayne, and Stephen G. Wozniak in April 1976 and is headquartered in Cupertino, CA.
Related stocks
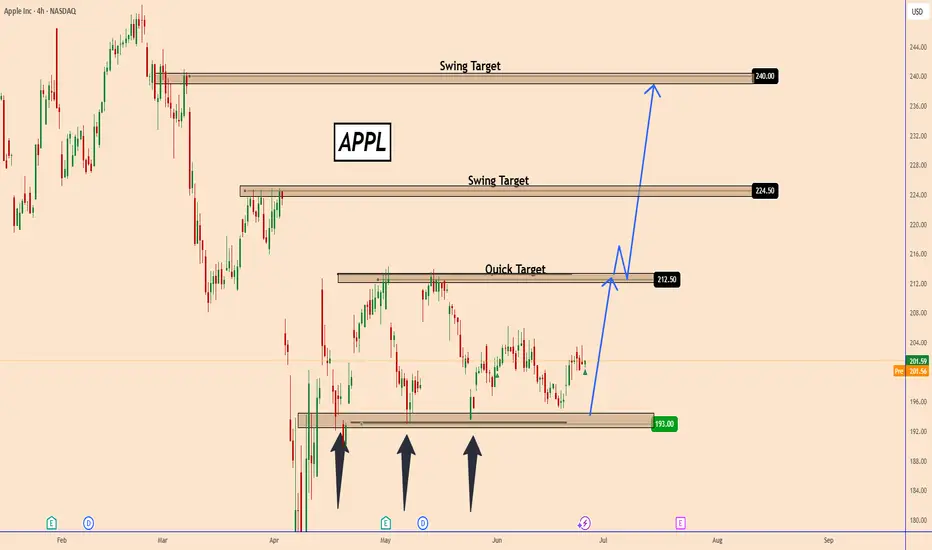
AAPL: 202.92Bullish Entry: Level: 206.00 / 208.00 Target 210.00 Stop 206.00 Bearish Entry: 200.00/198.00 Stop 201.00 Target 196.00

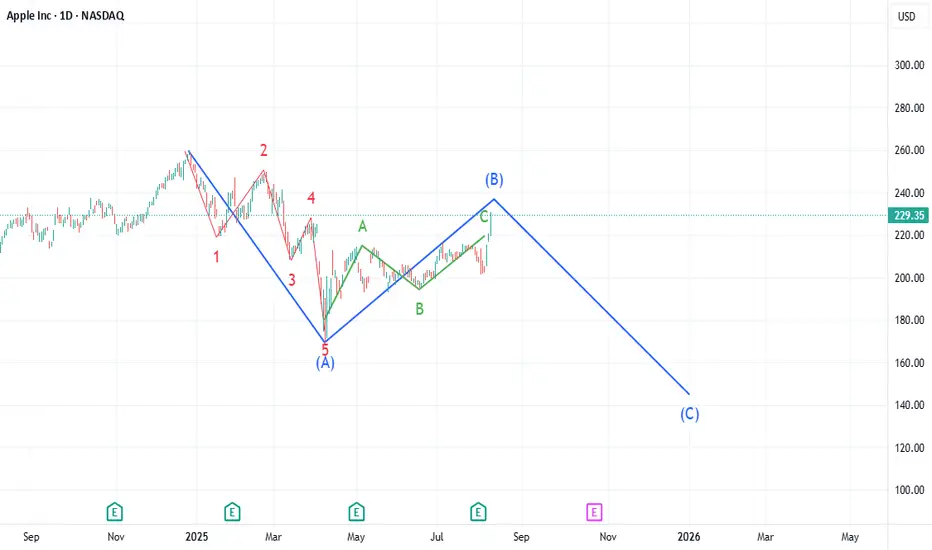
AAPL: End of B Wave in ABC CorrectionApple blasted upwards Wednesday through Friday for what likely is a blowoff of wave C ov Wave B. AAPL could potentially reach 232, but that is as high as I am anticipating. The next wave down will likely be more violent than Wave A and could bring AAPL down to as low as $143 over the next 3 - 5 mont
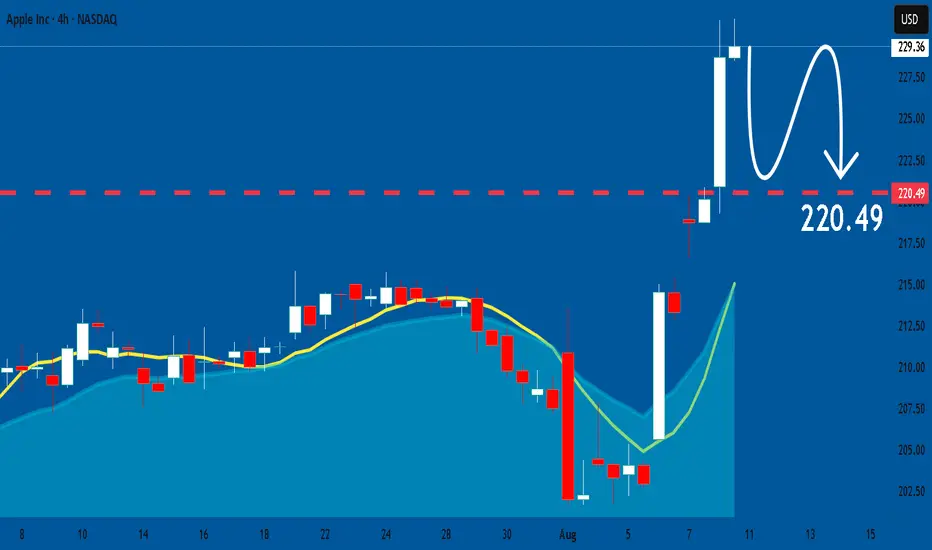
APPLE My Opinion! SELL!
My dear friends,
Please, find my technical outlook for APPLE below:
The price is coiling around a solid key level - 229.36
Bias - Bearish
Technical Indicators: Pivot Points Low anticipates a potential price reversal.
Super trend shows a clear sell, giving a perfect indicators' convergence.
Goal
Apple (AAPL) Shares Surge to Four-Month HighApple (AAPL) Shares Surge to Four-Month High
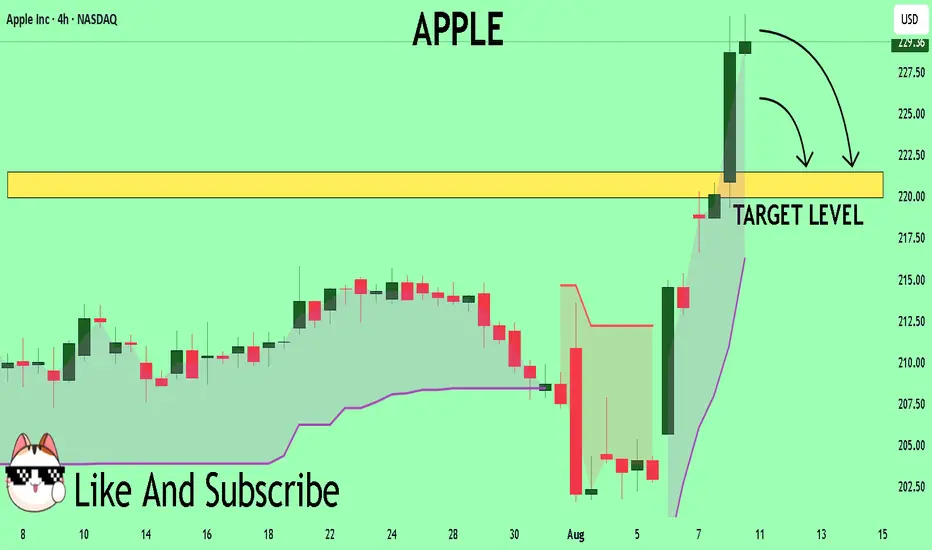
According to the AAPL price chart, the stock rose to the $220 level yesterday – marking its highest point since early April.
The rally was fuelled by several bullish factors:
→ Trade developments: President Trump announced an additional 25% tariff o
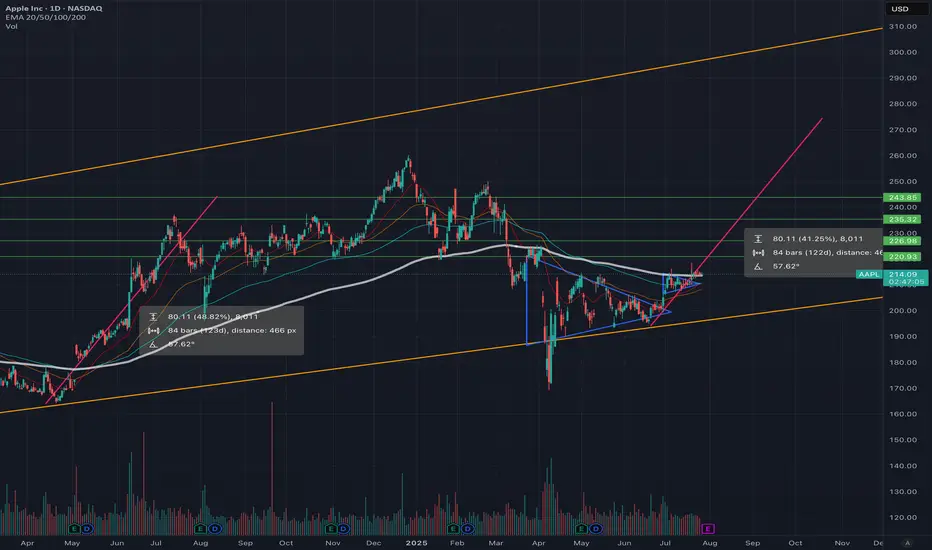
AAPL Eyeing \$240 Breakout — Don’t Miss This Move
🚀 **AAPL Eyeing \$240 Breakout — Calls Lined Up for 100%+ Move** 📈
💎 Weekly sentiment: **STRONG BULLISH** (Call/Put = 1.86)
📊 RSI: Daily 77.7 | Weekly 59.8 | Volume 1.3x ↑ (Institutional Buying Confirmed)
🔥 VIX: 15.15 (Low Volatility = Green Light)
🎯 **Trade Setup**
* Type: **Call** (Long)
* Stri

APPLE: Forecast & Trading Plan
Remember that we can not, and should not impose our will on the market but rather listen to its whims and make profit by following it. And thus shall be done today on the APPLE pair which is likely to be pushed down by the bears so we will sell!
Disclosure: I am part of Trade Nation's Influencer
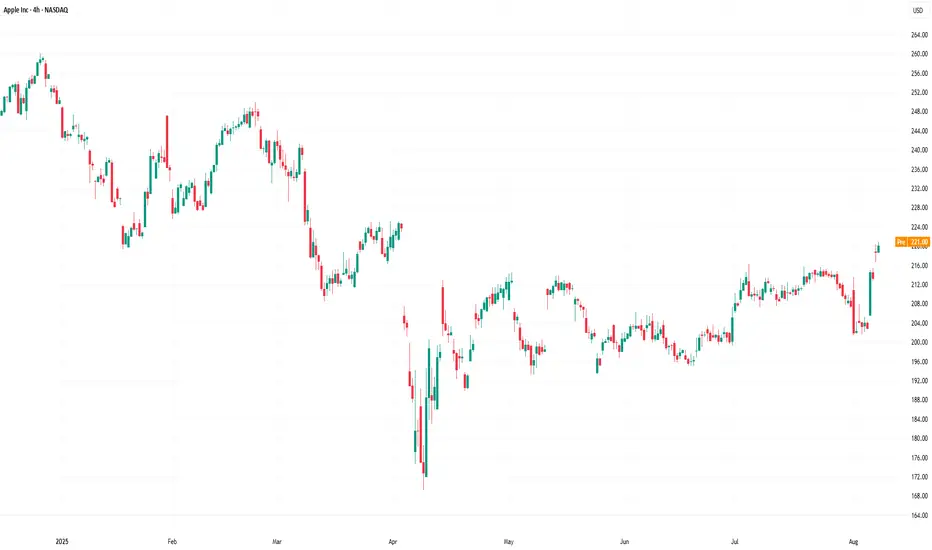
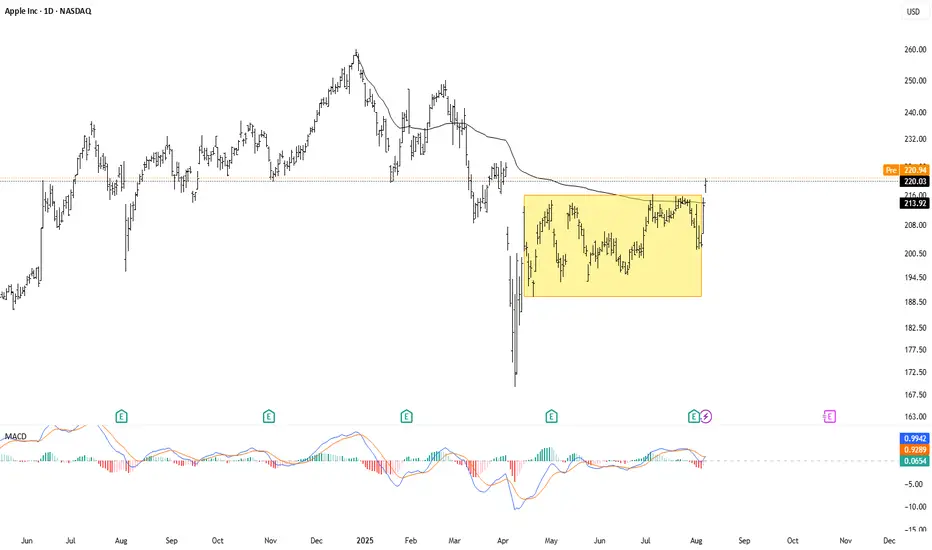
AAPL - Breakout in Apple After ConsolidationApple's stock appears to be breaking out of its three months trading range between 216 and 190, potentially opening the way for more upside from here. Not only did the pair break above the previous highs, it has also broken above the VWAP line from last year's highs.
APPLE INC. STOCK FORMING BEARISH TREND MARKET STRUCTUREApple Inc. (AAPL) Stock Developing Bearish Structure in 4-Hour Chart - Key Levels to Watch
Technical analysis of Apple Inc.'s (AAPL) 4-hour chart reveals a concerning bearish trend formation that traders should monitor closely. The recent price action has shown strong selling pressure, confirmed

Time to buy? Too much negative press. Buy in Fear- Updated 28/7Apple has been making steady gains since April 8th. Trading volume has been consistently strong, increasing intermittently, with sell pressure exhausted at the 200 USD mark. The price point is now sitting above the 200 daily EMA support, which indicates strong potential for continued upward movement
See all ideas
Summarizing what the indicators are suggesting.
Neutral
SellBuy
Strong sellStrong buy
Strong sellSellNeutralBuyStrong buy
Neutral
SellBuy
Strong sellStrong buy
Strong sellSellNeutralBuyStrong buy
Neutral
SellBuy
Strong sellStrong buy
Strong sellSellNeutralBuyStrong buy
An aggregate view of professional's ratings.
Neutral
SellBuy
Strong sellStrong buy
Strong sellSellNeutralBuyStrong buy
Neutral
SellBuy
Strong sellStrong buy
Strong sellSellNeutralBuyStrong buy
Neutral
SellBuy
Strong sellStrong buy
Strong sellSellNeutralBuyStrong buy
Displays a symbol's price movements over previous years to identify recurring trends.
US37833DX5
APPLE 20/25Yield to maturity
9.95%
Maturity date
Aug 20, 2025
US37833DZ0
APPLE 20/50Yield to maturity
6.84%
Maturity date
Aug 20, 2050
US37833DW7
APPLE 20/50Yield to maturity
6.67%
Maturity date
May 11, 2050
US37833EA4
APPLE 20/60Yield to maturity
6.65%
Maturity date
Aug 20, 2060
US37833EK2
APPLE 21/51Yield to maturity
6.63%
Maturity date
Aug 5, 2051
US37833EF3
APPLE 21/51Yield to maturity
6.61%
Maturity date
Feb 8, 2051
US37833EG1
APPLE 21/61Yield to maturity
6.60%
Maturity date
Feb 8, 2061
US37833EL0
APPLE 21/61Yield to maturity
6.56%
Maturity date
Aug 5, 2061
US37833DQ0
APPLE 19/49Yield to maturity
6.38%
Maturity date
Sep 11, 2049
US37833EE6
APPLE 21/41Yield to maturity
6.10%
Maturity date
Feb 8, 2041
APCL
APPLE 15/42Yield to maturity
5.94%
Maturity date
Jul 31, 2042
See all APC bonds
Curated watchlists where APC is featured.


Frequently Asked Questions
The current price of APC is 200.25 EUR — it has increased by 0.66% in the past 24 hours. Watch APPLE INC stock price performance more closely on the chart.
Depending on the exchange, the stock ticker may vary. For instance, on GETTEX exchange APPLE INC stocks are traded under the ticker APC.
APC stock has risen by 11.58% compared to the previous week, the month change is a 8.48% rise, over the last year APPLE INC has showed a 0.30% increase.
We've gathered analysts' opinions on APPLE INC future price: according to them, APC price has a max estimate of 236.28 EUR and a min estimate of 119.43 EUR. Watch APC chart and read a more detailed APPLE INC stock forecast: see what analysts think of APPLE INC and suggest that you do with its stocks.
APC stock is 2.35% volatile and has beta coefficient of 1.13. Track APPLE INC stock price on the chart and check out the list of the most volatile stocks — is APPLE INC there?
Today APPLE INC has the market capitalization of 2.92 T, it has increased by 7.97% over the last week.
Yes, you can track APPLE INC financials in yearly and quarterly reports right on TradingView.
APPLE INC is going to release the next earnings report on Oct 23, 2025. Keep track of upcoming events with our Earnings Calendar.
APC earnings for the last quarter are 1.33 EUR per share, whereas the estimation was 1.22 EUR resulting in a 9.18% surprise. The estimated earnings for the next quarter are 1.50 EUR per share. See more details about APPLE INC earnings.
APPLE INC revenue for the last quarter amounts to 79.83 B EUR, despite the estimated figure of 76.03 B EUR. In the next quarter, revenue is expected to reach 86.76 B EUR.
APC net income for the last quarter is 19.89 B EUR, while the quarter before that showed 22.91 B EUR of net income which accounts for −13.15% change. Track more APPLE INC financial stats to get the full picture.
Yes, APC dividends are paid quarterly. The last dividend per share was 0.22 EUR. As of today, Dividend Yield (TTM)% is 0.44%. Tracking APPLE INC dividends might help you take more informed decisions.
APPLE INC dividend yield was 0.43% in 2024, and payout ratio reached 16.11%. The year before the numbers were 0.55% and 15.32% correspondingly. See high-dividend stocks and find more opportunities for your portfolio.
As of Aug 13, 2025, the company has 164 K employees. See our rating of the largest employees — is APPLE INC on this list?
EBITDA measures a company's operating performance, its growth signifies an improvement in the efficiency of a company. APPLE INC EBITDA is 120.29 B EUR, and current EBITDA margin is 34.44%. See more stats in APPLE INC financial statements.
Like other stocks, APC shares are traded on stock exchanges, e.g. Nasdaq, Nyse, Euronext, and the easiest way to buy them is through an online stock broker. To do this, you need to open an account and follow a broker's procedures, then start trading. You can trade APPLE INC stock right from TradingView charts — choose your broker and connect to your account.
Investing in stocks requires a comprehensive research: you should carefully study all the available data, e.g. company's financials, related news, and its technical analysis. So APPLE INC technincal analysis shows the buy rating today, and its 1 week rating is buy. Since market conditions are prone to changes, it's worth looking a bit further into the future — according to the 1 month rating APPLE INC stock shows the buy signal. See more of APPLE INC technicals for a more comprehensive analysis.
If you're still not sure, try looking for inspiration in our curated watchlists.
If you're still not sure, try looking for inspiration in our curated watchlists.