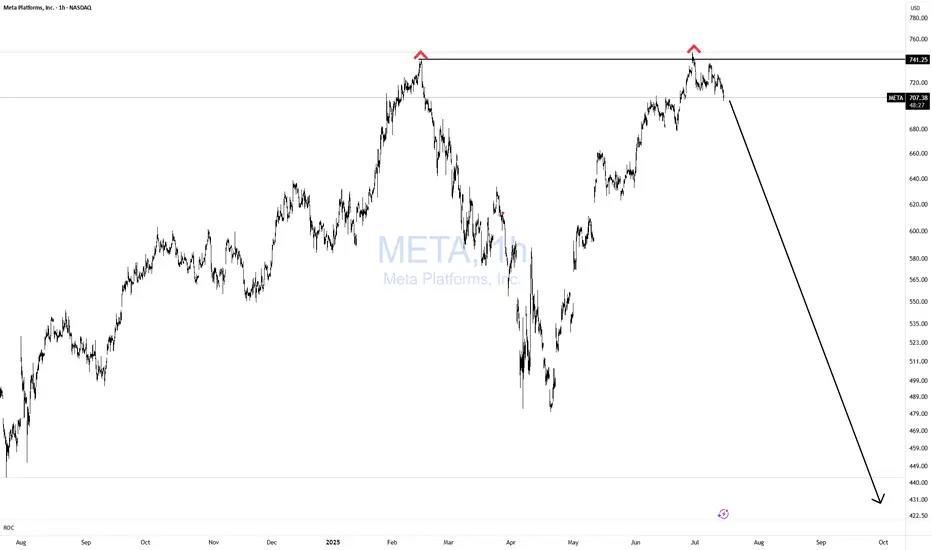
META Double Topping!Does it get any easier than this? NOPE!
If you can't spot this pattern from 1000 miles away, then you need a lot more time in the seat, training yourself in TA.
Simple with great risk reward!
Bulls GTFO!
FB2A trade ideas
Meta .. (Where we stand)Long term, I think this stock is headed back to 300-400...
Short term I think it's a high chance we see 740-800...
Let me explain
Back in Feb we tagged our long term resistance, corrected and then we retested it with a lower high on the RSI (Bearish divergence) that you can see on the monthly and weekly time frame
Last few weeks Meta has pulled back while chips have pumped with good tariff news. I think Meta could be ready for another bounce here
My reasons
1. On the lower edge of daily Bollingerband
2. The 3-4 hour money flow is too oversold here. Last 4 times this happened, Meta mover 5-7%
3. Daily hammer candle with volume
Near the 50ema
4.
Meta closed below is 20ma at 715 also has stiff price action also at
So the best entry would be either to wait for a break over 720.00 then long it to 740-750..
Or 698-700
Meta would only be bearish immediately with a close below 680 price action and 50sma
Keep on mind googl has earnings this week and Meta will trade in sympathy on any advertising news
The best short setup long term is to wait for a test of 780-800 on the monthly trend .
MetaSince the last post I made price has yet to make a new high. It has managed to chop in this area with a slight downward bias. If we're on the verge of the top of the indices, there is no reason to think Meta will continue higher much longer. This pattern, which is clearly corrective in nature, is way overextended. We started off with a 3-wave move higher off the April low and have risen all the way to the 2.236. Even if you could somehow say this is impulsive, it would still be over extended. So, no matter how you look at this pattern, it is in need of a correction. The question is how will that correction look. IMO, it will look like a minor C wave of intermediate (A). However, if it is somehow impulsive, then it would look like either minor A just now starting, or a smaller degree wave 2.

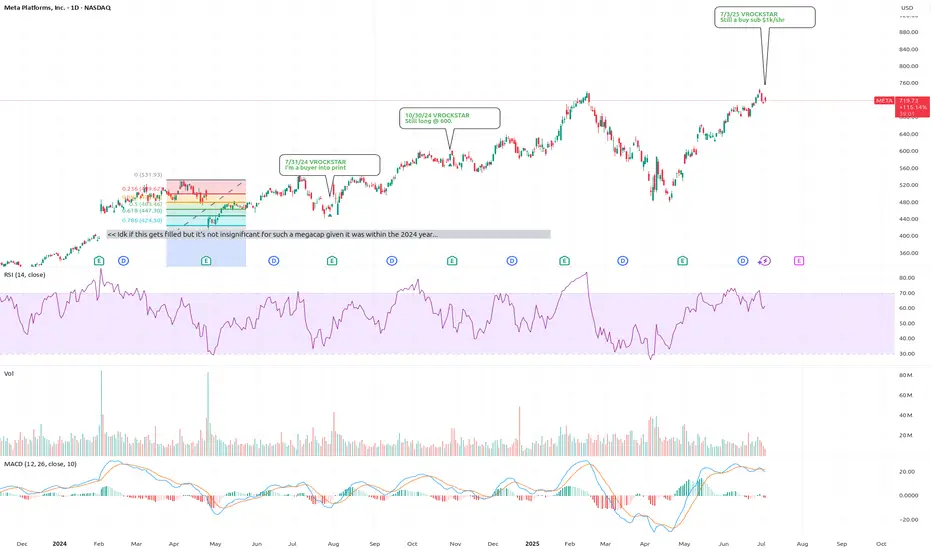
7/3/25 - $meta - Still a buy sub $1k/shr7/3/25 :: VROCKSTAR :: NASDAQ:META
Still a buy sub $1k/shr
- reality is, why would you bet against zuck
- his platforms are hitting on all strides. he is willing to internally build the best AI when he's falling behind by hiring the best talent and it is a LOT cheaper to hire for collectively $500 mm than say pay billions for a developed product and internalize it. great move Zuck!
- and their ad tools are second to none and don't suffer as much from "Google search" narrative as the ecosystem is one of those that's incrementally chipping away from Google.
- at mid 20s + PE, the stock is not "cheap" but it's actually quite affordable for the environment we're in
- some market POV: I think we've seen the "garden variety" pullback already. believe it or not... when you look at the individual names from recent highs, we've seen a lil 3 to 10% shuffle and not all on the same day (take for instance the TSLA dip the other day, large, and not on a day where nasdaq or other Mag7's were red).
- i continue to see small caps failing on large cap peers
- i see more money still floating lager caps higher at the expense of small caps, even tho it might look the opposite in the immediate term (this is a story as old as time... newbs chase quick thrills, get squashed and can afford less of the assets they should be buying to begin with). so word to the wise: if you've made some nice tendies lately on slightly more degen plays... buying stuff like Mag7's or even indices at highs is not necessarily a "bad" buy.
- anyway i like NASDAQ:META at sub $1k and sub 35x PE into the print
- would like to own more, so would be buying dips
- but think this is a winner in 2H
V
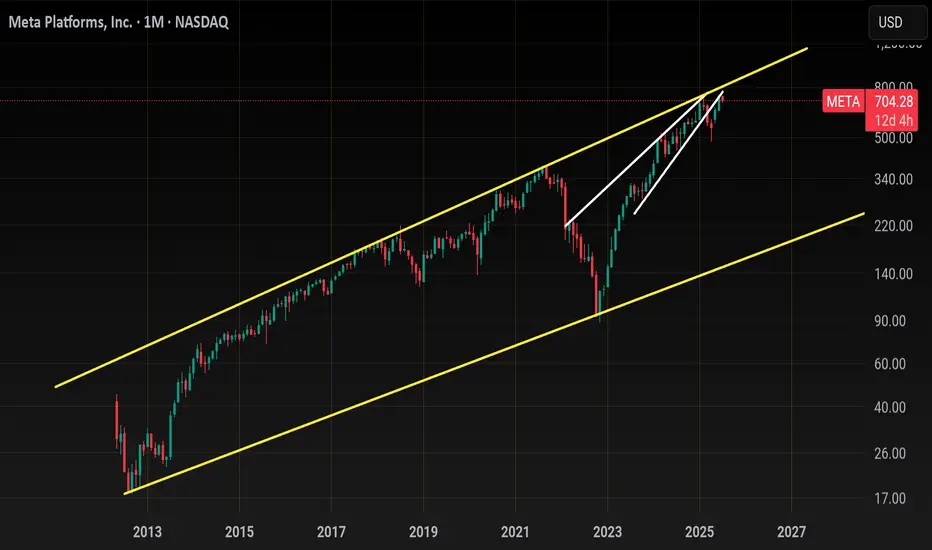
Meta - The breakout in question?🪓Meta ( NASDAQ:META ) is retesting major structure:
🔎Analysis summary:
After Meta perfectly retested a major previous support trendline in 2022, the trend shifted bullish. We have been witnessing an incredible rally of about +700% with a current retest of the previous all time highs. Time will tell but a bullish breakout remains quite likely.
📝Levels to watch:
$750
🙏🏻#LONGTERMVISION
Philip - Swing Trader

Is Meta breaking down?It's too early to tell. But investors need to keep an eye out for key support levels at $680 - $700
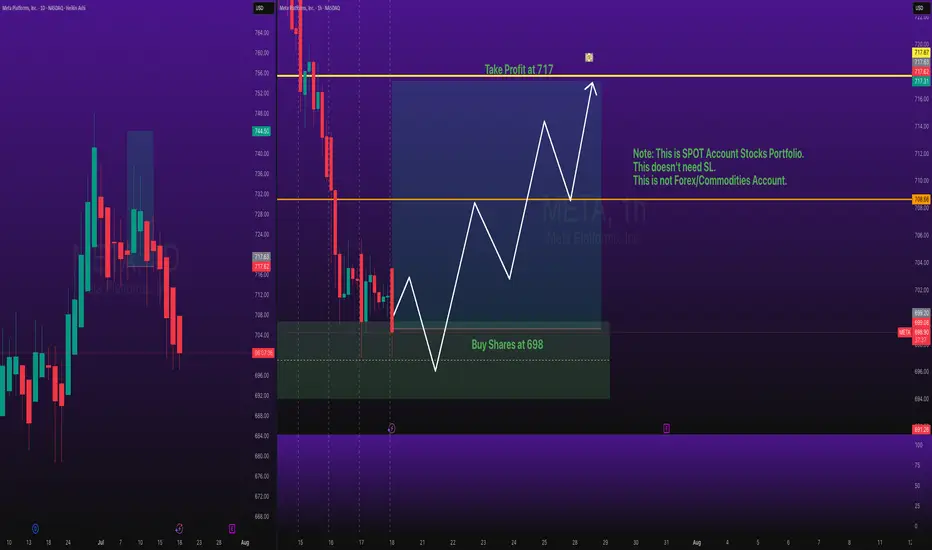
Stocks SPOT ACCOUNT: META Shares Buy Trade with Take ProfitStocks SPOT ACCOUNT:
NASDAQ:META shares: my buy trade with take profit.
This is my SPOT Accounts for Stocks Portfolio.
Trade shows my Buying and Take Profit Level.
Spot account doesn't need SL because its stocks buying account.
Looks good Trade.
Disclaimer: only idea, not advice
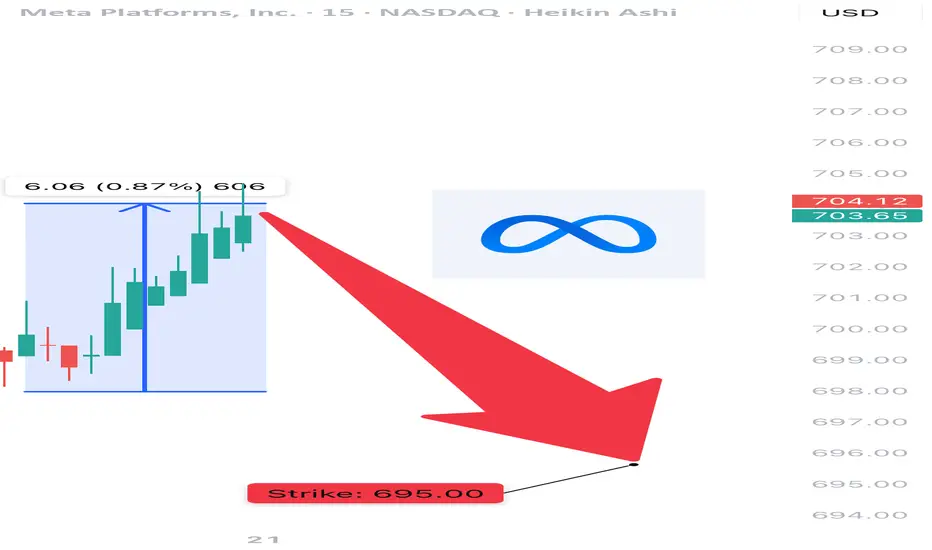
META Bearish Swing Alert – Bear in Hiding? Watch for Breakdown B
🔻 NASDAQ:META Bearish Swing Alert – Bear in Hiding? Watch for Breakdown Below $690 🐻
📅 Posted: July 18, 2025
💡 All models say “bearish,” but volume is the wildcard. Tight play, big potential.
⸻
🧠 AI Consensus Summary: Bearish But Not Triggered
Model Bias Key Notes
Grok 🐻 Bearish RSI 40.5, weak volume, neutral options flow. No clear flow bias.
Claude 🐻 Bearish Same indicators. Recommends conditional entry.
Gemini ⚠️ Bearish Wait Bearish bias but no trigger yet due to low volume.
Llama 🐻 Cautious Bear Trade only if breakdown below $678 with volume.
DeepSeek 🐻 Bearish No bull signals. Neutral options flow confirms low conviction.
⸻
⚙️ Setup Details – META Naked Put
🎯 Strike: $695.00
📅 Expiry: August 1, 2025
💰 Entry Price (Premium): $22.70
💵 Profit Target: $30.00
🛑 Stop Loss: $14.00 (~40% of premium)
📏 Contract Size: 1
📈 Confidence Level: 70%
⏰ Entry Timing: Market open — only if price breaks below $690 with volume confirmation
🕒 Signal Timestamp: 2025-07-18 @ 10:54 AM EDT
⸻
🔍 Why This Works
• ✅ Technical Trend: RSI < 45, negative 5-day/10-day momentum
• 🧊 Options Flow: Flat — no bullish bias = clean downside setup
• 🧨 Trigger Level: Breakdown below $690 = institutional exit confirmed
• ⚠️ Key Caveat: Weak volume = don’t front-run the breakdown
⸻
📌 Levels to Watch
• ⚠️ Breakdown Confirm: Below $690 with volume > 1.25x
• 🧱 Target Zone: $678 support
• ❌ Invalid If: Bounces back over $705 on volume
⸻
🚨 Risk Warning
This isn’t the “all-in” moment — it’s a sniper trade.
No volume = no entry. Tight stop. Fast hands. Smart size.
⸻
📊 TRADE SNAPSHOT
{
"instrument": "META",
"direction": "put",
"strike": 695.0,
"expiry": "2025-08-01",
"confidence": 0.70,
"profit_target": 30.00,
"stop_loss": 14.00,
"size": 1,
"entry_price": 22.70,
"entry_timing": "open",
"signal_publish_time": "2025-07-18 10:53:53 UTC-04:00"
}
⸻
🔁 Follow for more AI-backed trades
💬 Is META breaking down — or faking out?
👀 Drop your entry thoughts in the comments.
New Setup: METAMeta is now setting up for a potential bounce now. If the Markets can be positive tomorrow, we should see Meta also participate.

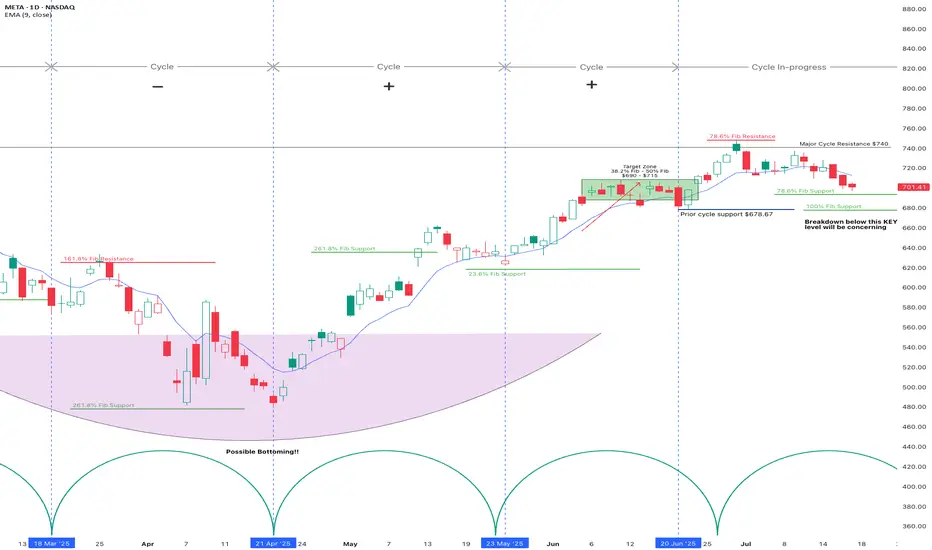
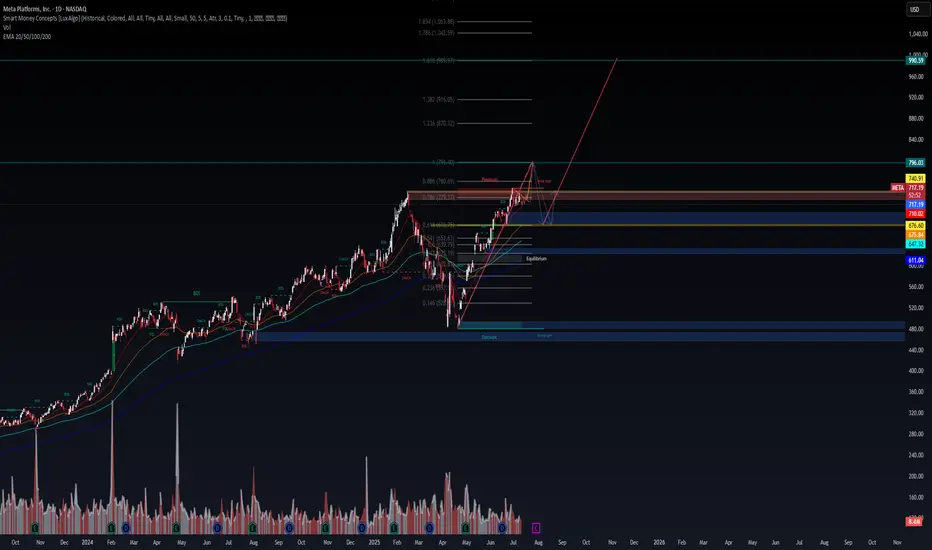
META | Accumulation Zone Identified — Road to $990?🧠 META | Accumulation Zone Identified — Road to $990?
📊 Ticker: META (Meta Platforms Inc.)
🕒 Timeframe: 1H
📍 Current Price: $717.36
📈 Bias: Bullish accumulation → Expansion
🔍 WaverVanir DSS Thesis
Our system has flagged a liquidity harvesting and accumulation phase between $676–$740. Institutional behavior suggests price is returning to equilibrium before a potential reaccumulation and markup.
🔑 Key SMC Zones:
🔺 Premium Zone: $729–$740 — recent rejection + liquidity engineered
🔻 Discount Zone: $676–$696 — ideal accumulation range
🔵 Equilibrium Pivot: ~$705
🟦 Volume Cluster: $716–$718 → short-term magnet and likely chop area
📐 Fibonacci Confluence:
0.786 Fib = $729.37 (converging with premium zone)
1.272–1.618 extensions → Targets = $870, $990+
0.618 retracement = $676.60 — deep discount level
🚨 VolanX Execution Logic:
Wait for sweep + displacement below $700
Watch for internal BOS + higher low formation
Confirmed entry above $729 = breakout of accumulation
Scale-out zone: $870 → $990+
🧬 Trade Strategy:
Leg Action Level Risk
A Accumulate $680–$705 Low
B Confirm Break $729+ Medium
C Profit Zone $870 / $990 High reward
⚡ Alpha Outlook: META is in a controlled markup with engineered pullbacks. This is where narratives shift, and the smart money loads. VolanX signals strong alignment with SMC zones — this may be a high-conviction multileg long.
#WaverVanir #VolanX #META #SmartMoney #TradingAlpha #SMC #Accumulation #Gamma #OptionsFlow #LSTM #DSS #AITrading #TechStocks #GrowthEquity #Fibonacci #TradingView
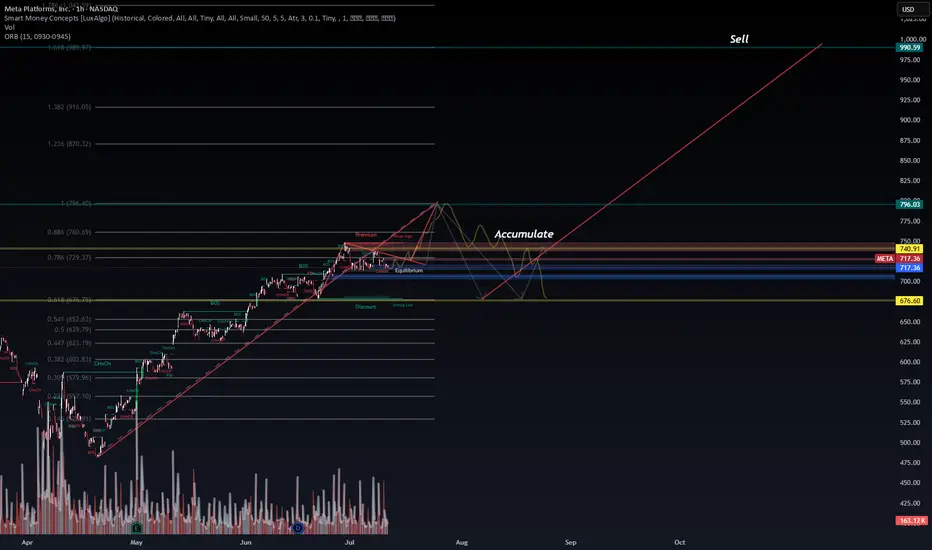
META (Meta Platforms Inc.) – Macro Compression Before Expansion META sits at a decisive macro juncture:
A clean SMC structure combined with Fibonacci premium zones signals an imminent directional expansion.
🧠 Macro Thesis:
Price is coiled just under 0.786–0.886 Premium Zone ($729–$760)
↳ This is a known trap area for retail liquidity – institutions often engineer sweeps here.
Volatility compression and volume tapering beneath the “weak high” setup
↳ Perfect conditions for either an engineered breakout raid or a sell-side liquidity hunt.
Fibonacci Expansion Zones:
🟢 Bull case: Clean path to $796 → $870 → $990
🔻 Bear case: Reversion into EQ → discount zones → $676 or $611
🗺️ Trade Structure:
🟢 Scenario A: Expansion Breakout
Entry: $729.50+ (break above weak high)
Target Range: $740.91 → $796 → $870 → $990
Stop: $710.04 (below EQ + EMA confluence)
🔻 Scenario B: Distribution Rejection
Entry: Break below $710
Target: $676 → $647 → $611
Stop: $729.50
📊 Institutional Alignment:
SMC shows liquidity-engineered structure with BOS + CHoCH confirmed
EMA 100/200 still rising → trend remains intact unless $675 fails
🧠 Positioning around EQ and premium zones is key. META is not in a “buy or sell” zone—it's in a smart money trap. Let price decide.
This is chess, not checkers.
📍 Posted by WaverVanir International LLC – Advanced Market Intelligence & AI Governance Engine
#Meta #META NASDAQ:META #SmartMoney #InstitutionalFlow #LiquidityZones #TradingPlan #FibStrategy #MarketCycle #SwingTrading #WaverVanirResearch #AITrading #VolanX #QuantStrategy #CapitalFlow #TradingView
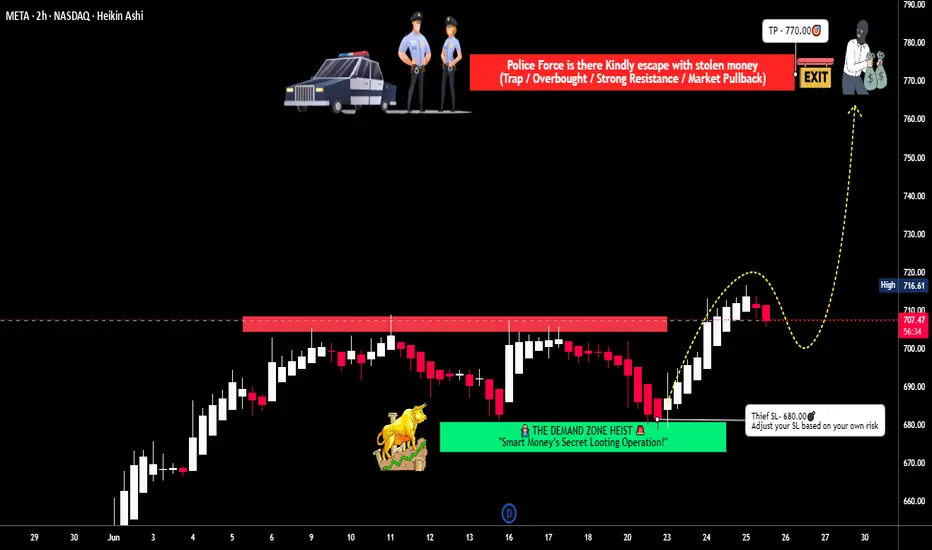
META Platforms Long Setup – Ready for the Next Move?💣 META Masterplan: Bullish Break-In Activated! 💼📈
🌟Hi! Hola! Ola! Bonjour! Hallo!🌟
Dear Money Makers & Silent Strategists, 🤑💰💸✈️
We’ve locked in on our next high-value digital vault: META Platforms Inc.
Built on our signature Thief Trading Style™ — where fundamentals meet stealth technical precision — this is your map to the bullish jackpot.
📍 ENTRY PLAN – Door’s Unlocked!
✅ Enter at any level — this heist is already in motion.
OR
🎯 Set your Buy Limit on a 15m/30m swing low or high — classic pullback infiltration.
🛑 STOP LOSS – Your Exit Route
Before breakout? Hold the line.
After breakout? Drop your SL at the recent 4H swing low – and size it to your risk appetite.
This isn’t luck — it’s calculated theft. 🔐
🎯 TARGET ZONE – Grab & Vanish
🎯 Aim: 770.00
But if the cops (aka sellers) show up early, get out with your loot — no shame in a clean getaway.
“Profit is the win. Perfection is fantasy.”
⚡ SCALPERS' TIPS – Quick In & Out
💵 Big wallet? Enter now.
💳 Tight budget? Follow the swing team.
Either way — longs only, and trailing SL is your safety rope.
📊 WHY META? – Intel Behind the Mission
🔍 This plan is reinforced by:
🔥 Strong Fundamentals
📈 Sentiment Signals
🧠 Quantitative + Macro Flow
💼 COT Data
🌐 Intermarket Correlations
It’s all aligning — the pressure’s building, and the breakout door is creaking open...
🚨 TRADING ALERT – Stay Outta Trouble
💥 Avoid placing new trades during major news drops.
🎯 Use trailing SL to protect and lock profits — your getaway vehicle must be ready.
💖 Support the Heist? Smash Boost!
Fuel the mission — every Boost empowers the crew.
This is Thief Trading Style — we don’t chase, we plan, strike, and vanish with the win. 🏆💪🐱👤
📡 Another breakout mission incoming. Stay hidden. Stay profitable. 🤑🚀
META (Meta Platforms) – Battle at the Premium | WaverVanir Resea🚨 META is coiling at a critical inflection zone.
We're observing textbook Smart Money Concepts (SMC) behavior on both the daily and intraday timeframes:
🧠 Key Observations:
Price is hovering below the Premium Zone (0.786–0.886 Fibonacci: ~$729–$760) – a known liquidity trap.
15M structure shift shows a CHoCH (Change of Character) and BOS (Break of Structure), signaling possible upside.
Volume is tapering near a weak high – suggesting accumulation or engineered liquidity sweep.
⚔️ Scenarios in Play:
🟢 Bullish Breakout:
If META breaks and closes above $729.50 with strength and volume:
Long Trigger: $729.50+
Targets: $740.91 → $796 → $870+
Stop: Below $718 (EQ/EMA cluster)
🔴 Bearish Rejection:
If price rejects premium and breaks below $710:
Short Trigger: <$710
Targets: $676 → $647 → $611
Stop: Above $723
🎯 Strategic Outlook:
META is trapped between buy-side and sell-side liquidity. We’re watching for either a bullish expansion above weak highs or a reversion into discount toward deeper demand zones.
Volume and macro catalysts (e.g., earnings, tech sector rotation) will decide the direction.
📍 Posted by WaverVanir International LLC – Institutional Market Intelligence Engine
#Meta NASDAQ:META #OptionsFlow #SmartMoneyConcepts #TradingStrategy #VolumeProfile #Fibonacci #LiquidityZones #WaverVanirResearch #VolanX #TechStocks #MarketOutlook #InstitutionalTrading #LongOrShort #TradingView #SwingTrade #BreakoutSetup
META Holds Bullish Ground Above Support at $714.0#META dipped to a high volume area at $720.8, while critical support stands tall at $714.0. The market is bullish above this level, with the next target at $748.8.
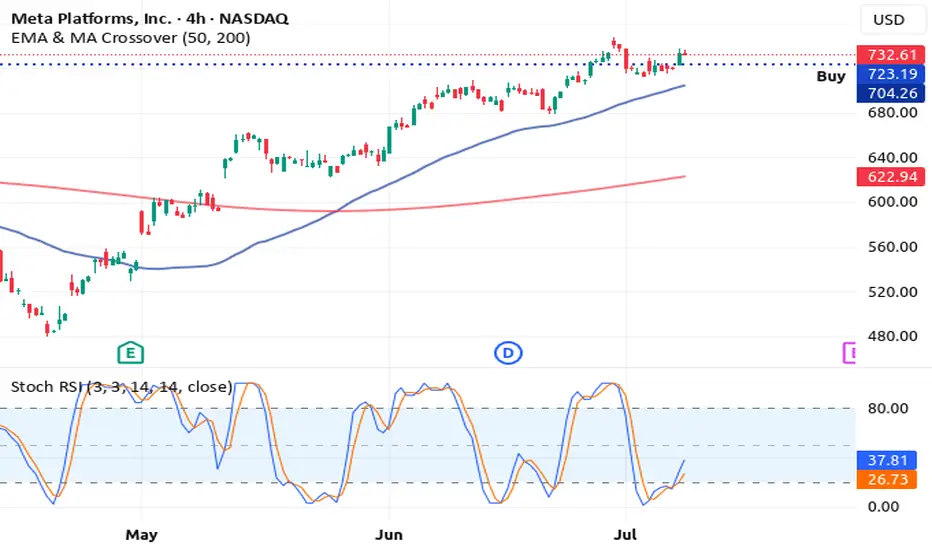
4H Chart: How Meta's Double Top Turned Into a Reversal Buy How Meta's Double Top Turned Into a Reversal Buy Signal on the 4H Chart
Meta Platforms Inc. (META) recently formed a classic double top pattern, which is often interpreted as a bearish reversal signal.
The price touched a key resistance level twice and then pulled back, triggering caution among technical traders. However, the
stochastic RSI on the 4-hour timeframe is now flashing a potential reversal buy signal that could shift market sentiment.
This hidden momentum may catch short sellers off guard. Here’s a breakdown of the setup:
Technical Breakdown
1. Double top formation
Resistance was tested two times, forming a temporary ceiling.
Typically, this signals a possible trend reversal.
However, there has been no strong bearish follow-through after the second top.
2. Stochastic RSI buy signal on the 4H chart
The %K line has crossed above the %D line in oversold territory.
This suggests a potential bullish reversal.
RSI is also recovering from a low zone, pointing to increasing buying pressure.
3. Support is holding
The neckline of the double top remains unbroken.
Price action shows higher lows forming just below resistance, a bullish sign.
Strategy Outlook: Contrarian Reversal Play
While the double top suggests weakness, the stochastic RSI indicates a rebound. Traders may be witnessing a bear trap, where the market tempts sellers before reversing higher.
If the price moves above both the 50 EMA and 200 EMA on the 4-hour chart, it could trigger what some i call a rocket booster setup —strong upside momentum backed by moving average alignment.
A bullish confirmation candle with volume could solidify the reversal case.
Conclusion
Meta’s chart pattern might look bearish at first glance, but momentum indicators tell a different story. A reversal from here could lead to a breakout if bulls step in with strong follow-through.
Disclaimer: Trading is risky. Use a simulation trading account before you trade with real money and learn risk management and profit-taking strategies.
---
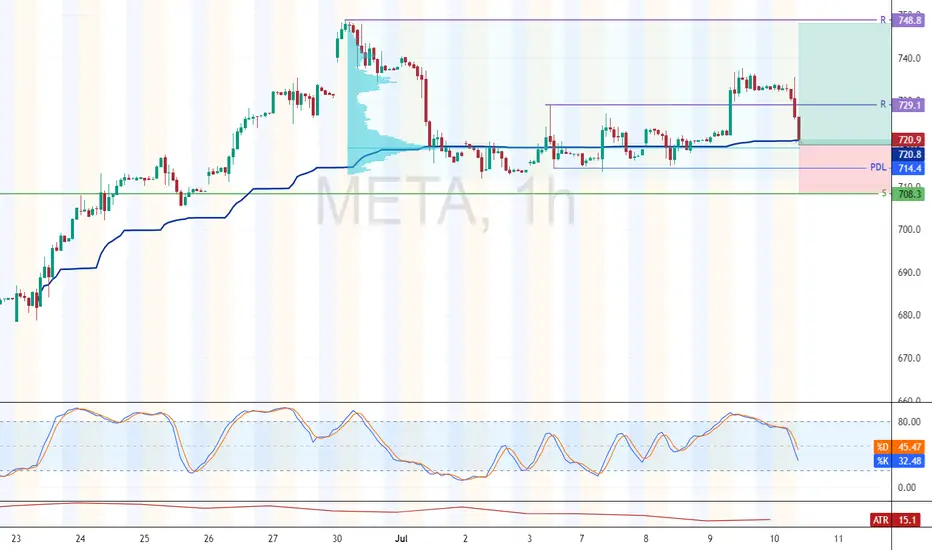
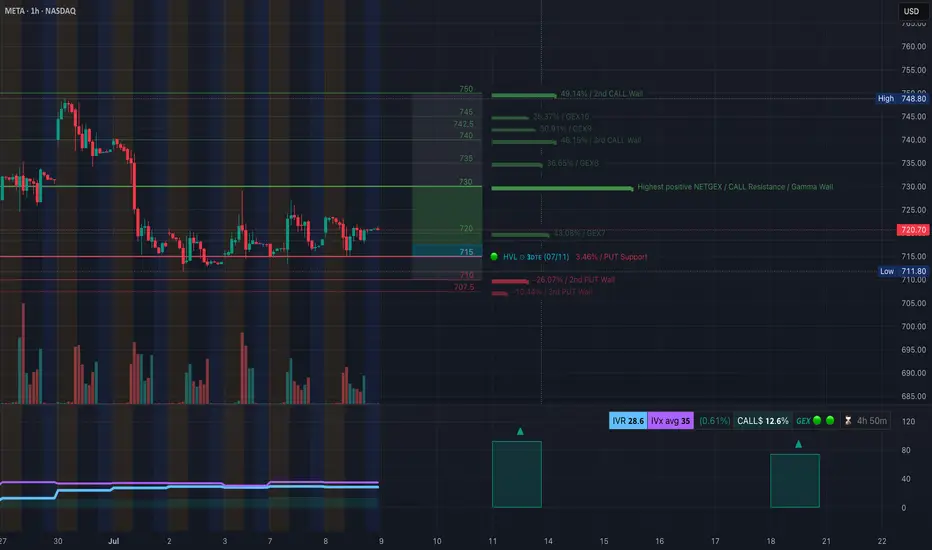
META at the Pivot Zone: Big Options Energy Building Ahead of CPIGEX-Based Options Analysis:
META is currently trading at $720.70, right beneath the highest positive GEX wall at $725, which aligns with the Gamma Resistance zone. The call structure above is dense, with strong walls at 730, 735, and 740, suggesting sellers may be active on strength unless price can break through and hold above $725. This zone is the inflection.
Below, Put Support builds at 715, 710, and especially at 707.5, forming a defensive gamma floor. The net gamma delta leans slightly CALL-biased at 12.6%, and IVR at 28.6 signals a relatively low volatility environment. This favors premium-selling strategies or debit spreads with strong directional confluence.
💡 Option Trade Setup Ideas:
* Bullish: Above $725 with confirmation, long 735c or 740c dated 7/12 or 7/19. Safer via debit spreads (e.g., 725/735 call spread) if IV climbs post-CPI.
* Bearish: Rejection below $723 with failed breakout = potential short via 720p or 715p targeting $710–707 area.
* Neutral-to-Range Play: Short strangle 715p/735c if expecting chop until CPI resolution.
1-Hour Chart Technical Analysis:
The price action is forming a compression wedge between descending trendline resistance and a horizontal demand base between 711.80–713.50, which has been defended multiple times. The current structure shows lower highs, but also consistent support with multiple BOS/CHoCH flips, especially along the 715 zone.
A strong reaction candle printed off the demand block after sweeping liquidity on July 8th. Volume is declining, suggesting compression before expansion.
🔍 Key Technical Levels:
* Support: 711.80 → 707.50 (Put wall + SMC demand)
* Resistance: 725 → 730 → 735 (GEX resistance cluster)
The EMA and volume structure hint at accumulation, but buyers need a clear breakout over 725 and retest for confirmation. A break below 711 would signal bearish continuation toward 707 and potentially 700.
My Trading Outlook:
* Bullish above 725: I’ll be looking for breakout + volume confluence for short-term long toward 735–740.
* Bearish below 713: If price loses structure and VWAP shifts downward, I’ll scalp short setups toward 707.50 zone.
* Avoid chasing in mid-zone: Let CPI and market sentiment unfold.
Disclaimer:
This analysis is for educational purposes only and does not constitute financial advice. Trade based on your own risk tolerance and always use proper risk management.
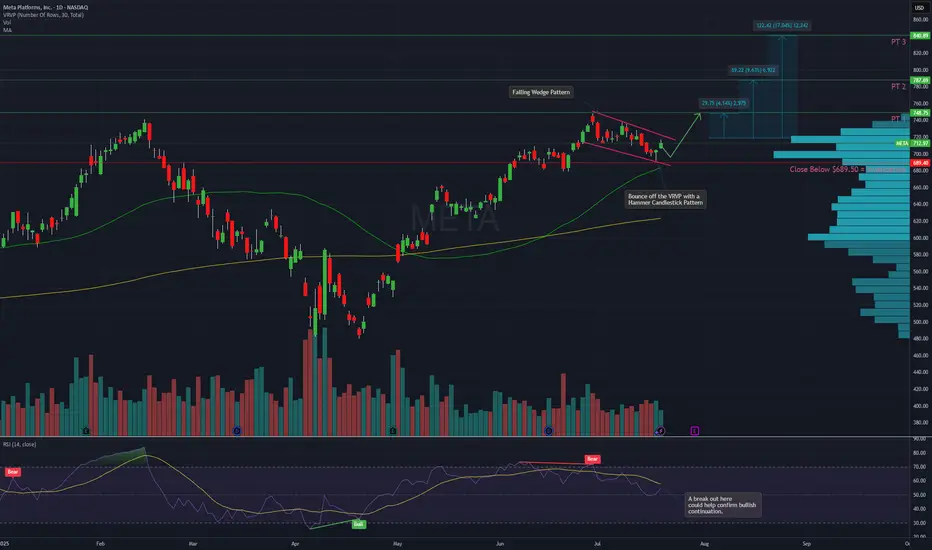
META – Falling Wedge Breakout Setup with Strong Risk/RewardDescription:
Meta (META) has been consolidating within a textbook falling wedge pattern, now showing signs of a potential breakout and bullish continuation.
Price Action Highlights:
Multiple rejections near 748 resistance
Recent bounce off the high-volume node on the VRVP with a hammer candlestick pattern
Holding above the 50-day moving average
RSI showing signs of reversal, approaching a key trendline breakout
Bullish Signal Criteria:
A breakout above the 720–725 range confirms wedge breakout
Watch for volume expansion to validate the move
Targets:
PT1: 748
PT2: 787
PT3: 840
Invalidation Level:
Close below 689.50 invalidates the setup
This setup offers a clear structure for continuation with well-defined risk levels and upside potential. Monitoring volume and RSI confirmation will be critical in the coming sessions.
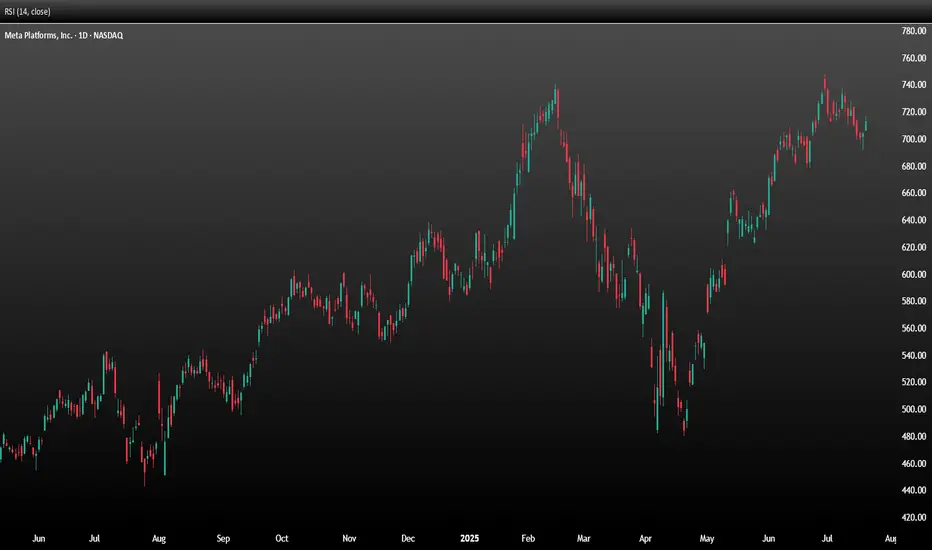
Meta Stock Risks Breakdown Amid Slowing Growth and Rising CostsMeta (NASDAQ: META), the parent company of Facebook, will report second-quarter 2025 results on Wednesday, 30 July, after the close of trading in New York. The social media giant is expected to report that earnings growth slowed to 14.2% to $5.89 per share, as revenue growth decelerated to 14.4%, reaching $44.7 billion. CAPEX is expected to more than double from a year ago, increasing to $17.5 billion from $8.1 billion.
For the third quarter, analysts expect the company to guide revenue to $46.0 billion. CAPEX for full year 2025 is forecast at $64.7 billion. The options market is pricing in a post-earnings move of about 6.5%.
The stock has formed a potential 2B top reversal pattern when it briefly rose on 30 June, closed above the high seen on 14 February, but was unable to maintain it. Now, the stock has fallen below an uptrend that began on 1 May, as well as below technical support at around $705. Meanwhile, the Relative Strength Index has rolled over, suggesting momentum has shifted from bullish to bearish. There is considerable technical support for Meta between $680 and $700 per share, and a move below that support region could lead to the shares falling below $600 over time.
From an option gamma perspective, $700 appears to be the put wall, which also suggests there is solid support around this level. However, the overall call delta values are high, indicating that the options market is very bullish. Therefore, after the company reports, it is possible there could be significant call value decay, leading to the unwinding of hedges and potentially pushing shares below the $700 support region. However, if the stock can hold support at $700, it stands a chance to move higher towards the call wall at $750 and potentially as high as $800.
Written by Michael J. Kramer, founder of Mott Capital Management.
Disclaimer: CMC Markets is an execution-only service provider. The material (whether or not it states any opinions) is for general information purposes only and does not take into account your personal circumstances or objectives. Nothing in this material is (or should be considered to be) financial, investment or other advice on which reliance should be placed.
No opinion given in the material constitutes a recommendation by CMC Markets or the author that any particular investment, security, transaction, or investment strategy is suitable for any specific person. The material has not been prepared in accordance with legal requirements designed to promote the independence of investment research. Although we are not specifically prevented from dealing before providing this material, we do not seek to take advantage of the material prior to its dissemination.
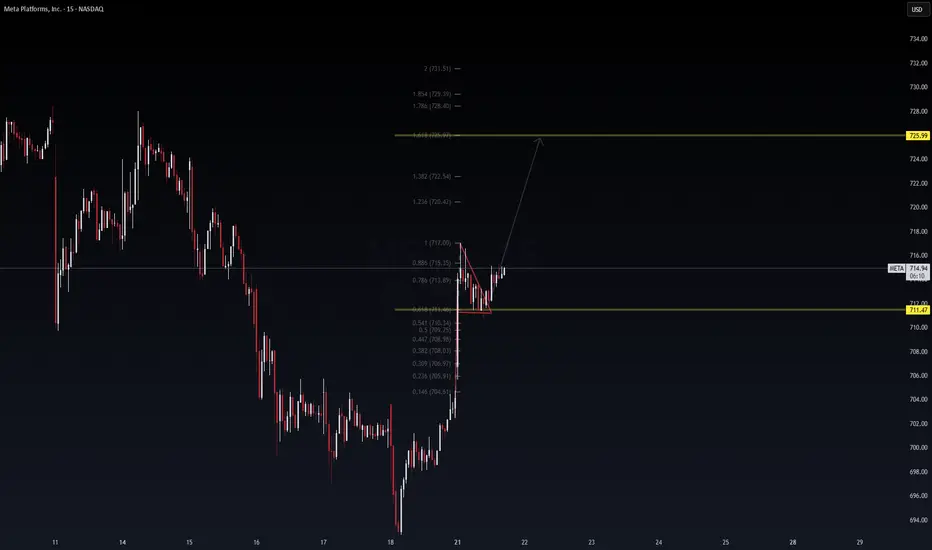
$META Day Trade Update | 15m TF📈 NASDAQ:META Day Trade Update | 15m TF
VolanX DSS framework still intact. Price broke out cleanly from a descending triangle, retested the breakout zone near 713.8, and is now stabilizing above 714.6. We’re printing a bullish structure with momentum building toward:
🎯 Primary Target: 725.99
🧠 Fib Levels in Play:
0.618 = 711.47 (support held)
0.786 = 713.89 (pivot zone)
1.618 = 725.99 (target in sight)
📌 Key Observations:
Retest successful, no wick violation below triangle
Volume holding steady post-breakout
RSI/MACD divergence resolved on lower TFs
If momentum sustains, META may front-run 725 with a sweep into 728–731.5 extension. We’ll adapt based on order flow and price action near 722.5 resistance.
📡 Protocol: VolanX DSS | SMC + Fib + Triangular Structure
🔁 Still stalking. Exit at 725 or scale-out from 722 based on intraday momentum.
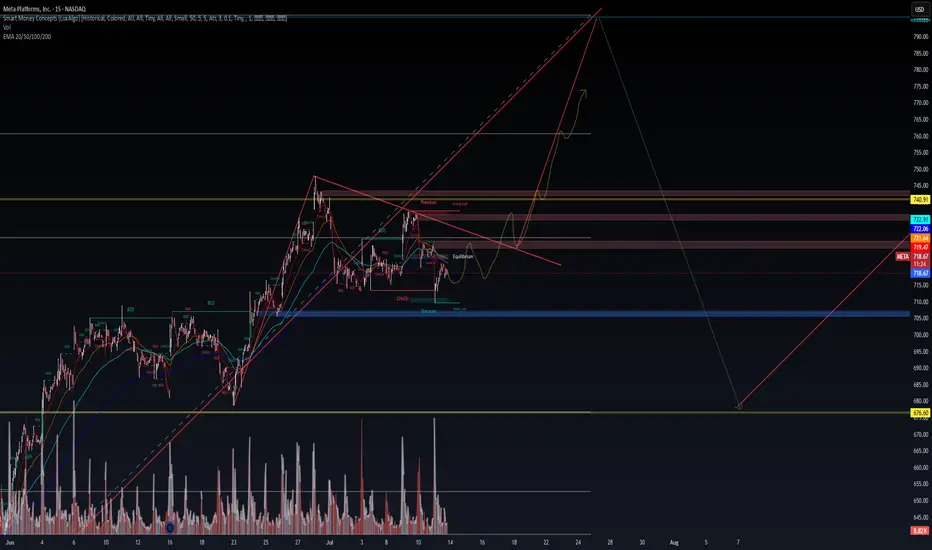
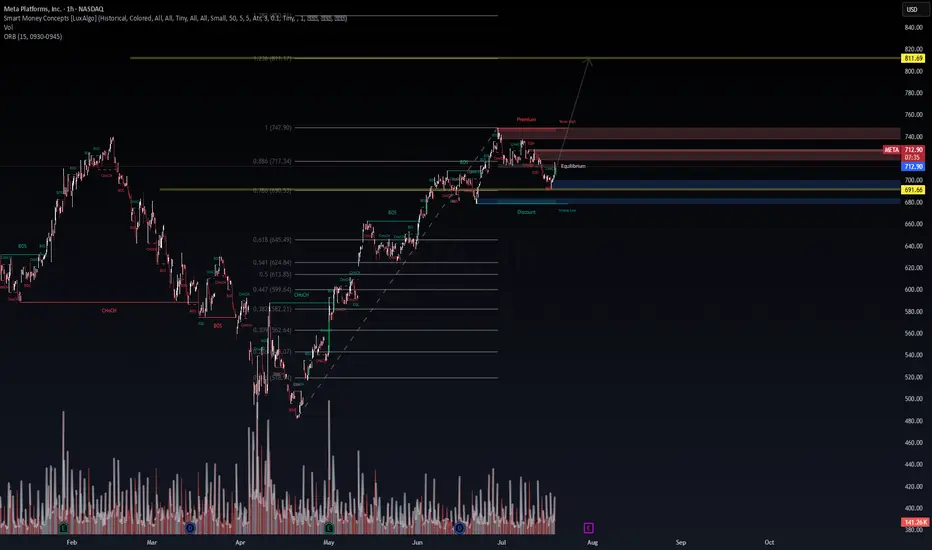
META – Institutional Buy Setup Active | VolanX Protocol Update📡 META – Institutional Buy Setup Active | VolanX Protocol Update
🧠 Price Intelligence Framework: WaverVanir DSS
The institutional model forecasts META to reach $760.64 in the next 15 trading days with a 95% confidence interval between $748.81 – $762.83. Signal is confirmed by 9/9 bullish model consensus.
🔍 Smart Money Concepts (SMC)
Price is rebounding from Equilibrium Zone (~$712.98) after discount mitigation. Liquidity structure favors bullish continuation toward:
🎯 Target 1: $727.63
🎯 Target 2: $760.64
🏁 Extended Target: $811.69 (1.272 extension)
📉 Risk Parameters (From DSS):
Entry: $713.36
Stop: $684.68 (4.0% risk)
Risk/Reward: 1.65:1
Volatility: 1.54% (low)
Capital Allocation: 25% of strategy layer
📈 Options Flow Validation:
Unusual activity observed across $720–$750 calls (Jul 25–Aug 22). Institutions are loading positions aggressively with >$2M notional in call sweeps.
Thesis: META is in an SMC bullish structure with alignment from AI forecasting, liquidity mapping, and options flow. VolanX Protocol confirms directional probability with low variance risk.
📌 Watch zone: $760 → $811
📌 Increased momentum if $717.34 (0.886 Fib) breaks cleanly
📌 Invalidation on close below $684
#META #VolanX #WaverVanir #SmartMoneyConcepts #OptionsFlow #TradingView #AITrading #InstitutionalSignals #Fibonacci #BreakoutSetup #LSTMForecast #TechnicalAnalysis
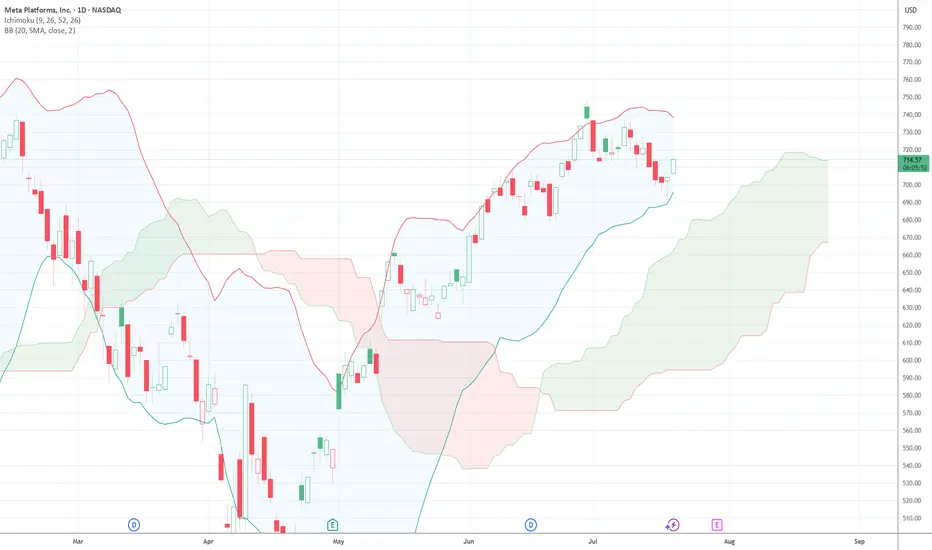
$META Cup & Handle? Wish I would have posted this pre market but I still like it for this week. Tapped the bottom band and it's bouncing and getting really tight now. Looks like a cup and handle near the all time high.
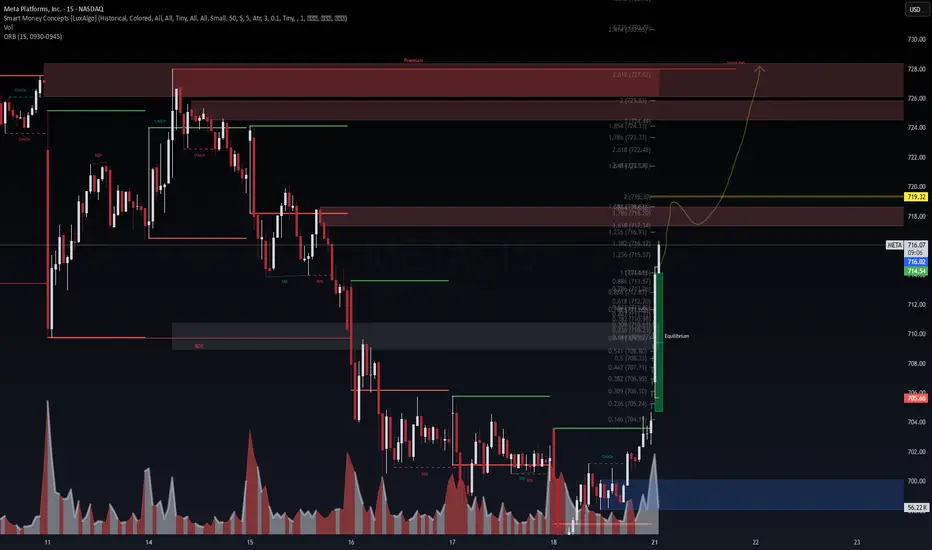
META 15M | Daytrade Setup – VolanX Protocol📈 META 15M | Daytrade Setup – VolanX Protocol
NASDAQ:META just delivered a high-confidence Break of Structure (BOS) + Change of Character (CHOCH) confluence off a low-volume sweep near the Equilibrium Zone (~$704).
Key Signals (VolanX Protocol):
✅ Smart Money Accumulation confirmed at blue demand zone
✅ Strong impulsive candle post-CHOCH (Volume Spike + Displacement)
✅ Fibonacci extensions line up with institutional targets:
📍 1.618 → $718.28 (First liquidity grab zone)
📍 2.0 → $719.30 (Equilibrium breakout target)
📍 3.618 → $727.62 (Full range sweep + premium zone)
🎯 Trade Thesis:
Targeting $719–$727 based on liquidity engineering and algo sweep probabilities.
🧠 VolanX Probability Curve:
📊 Move to $719.3 = 78% (aligned with 2.0 fib and historical rejection level)
📊 Move to $727.6 = 62% (final premium zone; sweep of June supply + “Strong High”)
⚠️ Retrace to $710.8 = 40% (retest demand or shakeout)
⏱️ Valid only for 07/21 NY session unless full structure invalidated.
💡 This setup reflects institutional liquidity dynamics governed by VolanX Smart Flow model. All insights are educational and part of the DSS framework.
🔁 Stay adaptive. Monitor BOS/CHOCH sequences. VolanX protects capital through real-time recalibration.
#WaverVanir #VolanX #META #DayTrade #SMC #DSS #AITrading #LiquidityHunt #VolumeProfile #TechStocks #TradingView
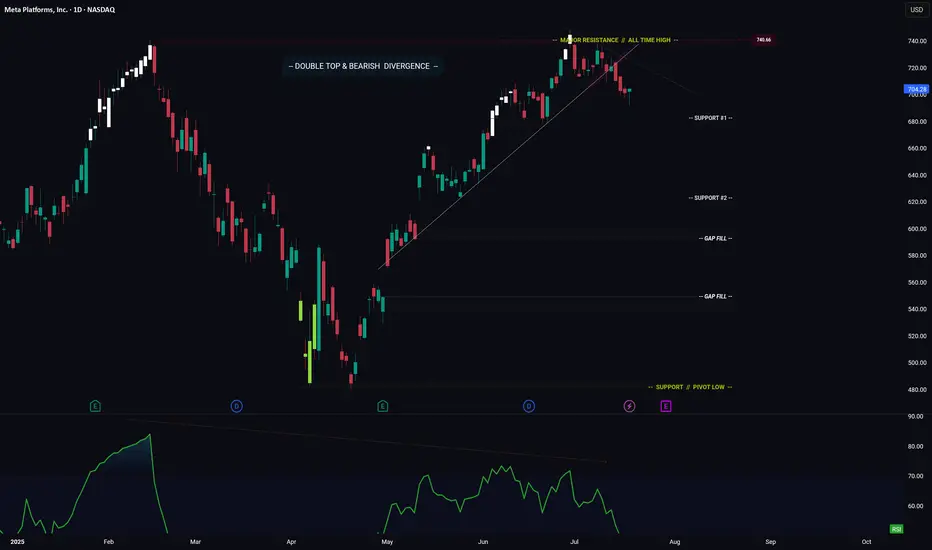
META -- Breakdown? Or Move Higher? Levels To Watch ForHello Traders!
Meta has broken down from its ascending trendline. This is bearish.
In addition price has formed a major Double Top pattern with Bearish Divergence.
Bearish Factors
1) Breakdown of ascending trendline
2) Double top
3) Bearish divergence
Two things need to happen if META is going to make a move higher...
1) Price needs to stay above "Support #1"
2) Price needs to break above the descending trendline (connecting the range highs)
IF price does breaks lower... where do we start looking for long positions?
- Support #2 is a great starting point, however if price makes it to support #2, then I could also see price trading down to fill the gap just below.
- This is where you could enter again to average down your position.
Thanks everyone and best of luck on your trading journey!