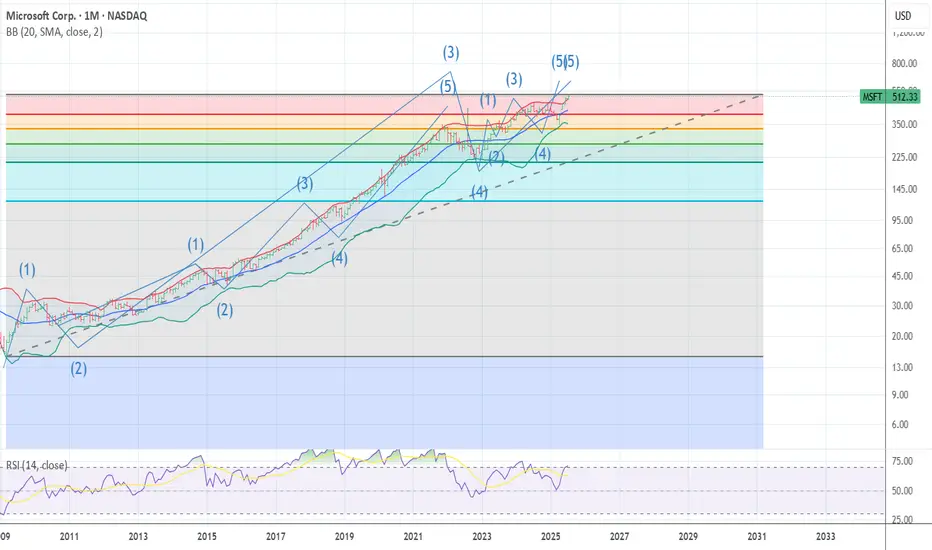
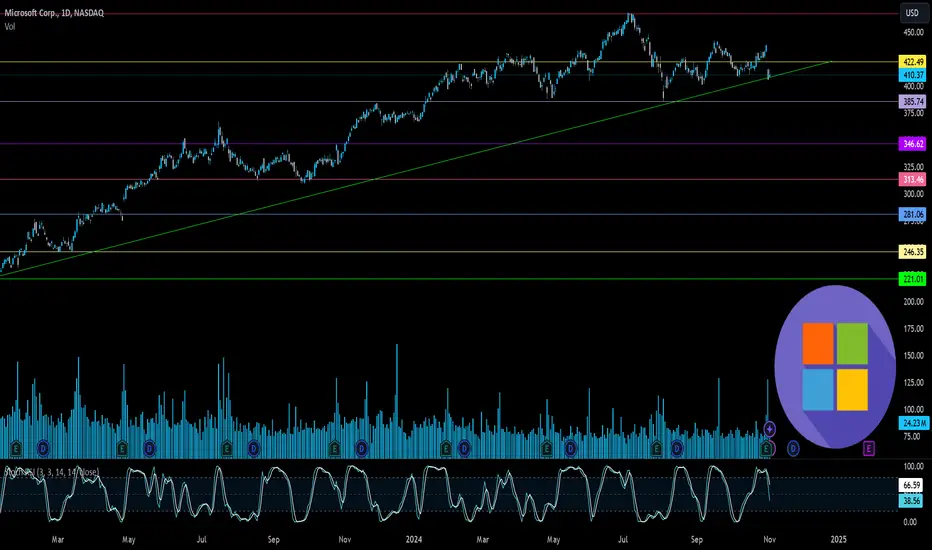
MSFT SUPER CYCLE WAVE 3 TOP MSFT The bell weather .Is now ending what looks to be the 5th wave for super cycle wave 3 top here from 518 to 525 from the 2009 low wave 2 . I am buying late 2027 525 puts Now the downside over the next 18 months is down near the previous wave 4 low 341 area I expect we will that at a min with odds as low as 222 . best of trades Wavetimer
MSF trade ideas
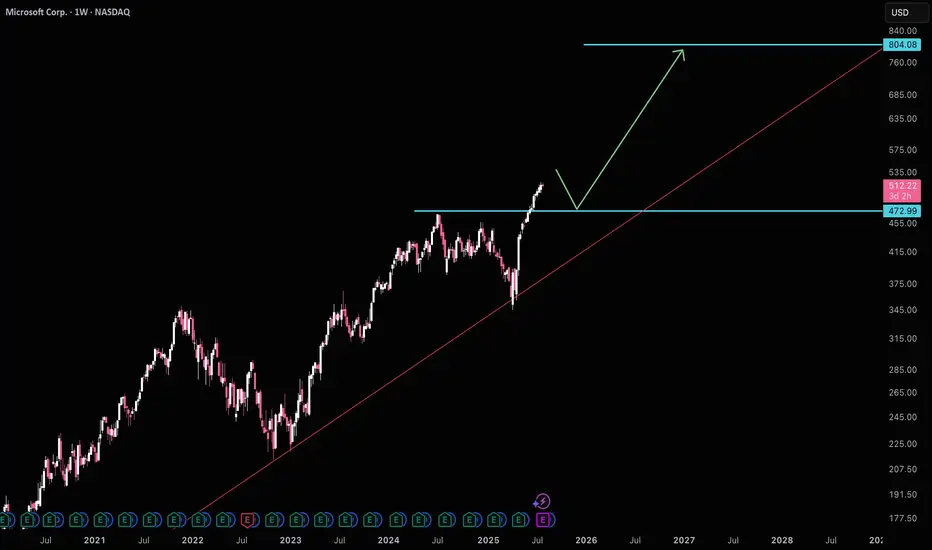
Mircrosoft wants to pullback to $470MSFT is likely to test $470 support before making it's move to $800. Another thing to be weary about is ratio MSFT/AAPL is at historical avg highs, which usually signals a bias towards AAPL. Waiting for $470 is a good idea before getting long again.
Good luck!
MSFT - Should you Buy All Time Highs?Hello everyone, I’m TheCafeTrader.
Next up in our breakdown of the MAG 7 is Microsoft (MSFT) — this post focuses on a long-term swing trade setup.
For short-term analysis, head to my profile and check out the latest posts.
⸻
💡 The Setup:
MSFT continues to ride a strong wave thanks to AI growth, especially with Copilot and its projected impact on revenue.
Several analysts have price targets ranging from $550 to $600, which still leaves 10–20% upside from current levels.
As of this writing, MSFT closed at $511.70, about 9% above its previous all-time high — and it got there in just five weeks.
Momentum is strong, and there’s no clear sign of slowing down.
⸻
📈 Is Now a Good Time to Buy?
Let’s look at two possible strategies:
⸻
Dollar-Cost Averaging (DCA) vs. Lump-Sum Investing
If you’re unfamiliar with DCA: it’s a strategy where you buy in gradually over time.
Say you have $5,000 set aside for MSFT — you might invest $1,000 now and continue adding monthly.
This is a smart approach in choppy or uncertain markets, but MSFT is not showing weakness right now.
Historically, when strong stocks are in clear bull trends, lump-sum investing outperforms DCA.
So if you’re confident in MSFT’s long-term potential — and want exposure to the current momentum — a full position now could make sense.
If you’re looking for a better price or want to scale in patiently, keep an eye on these key zones.
⸻
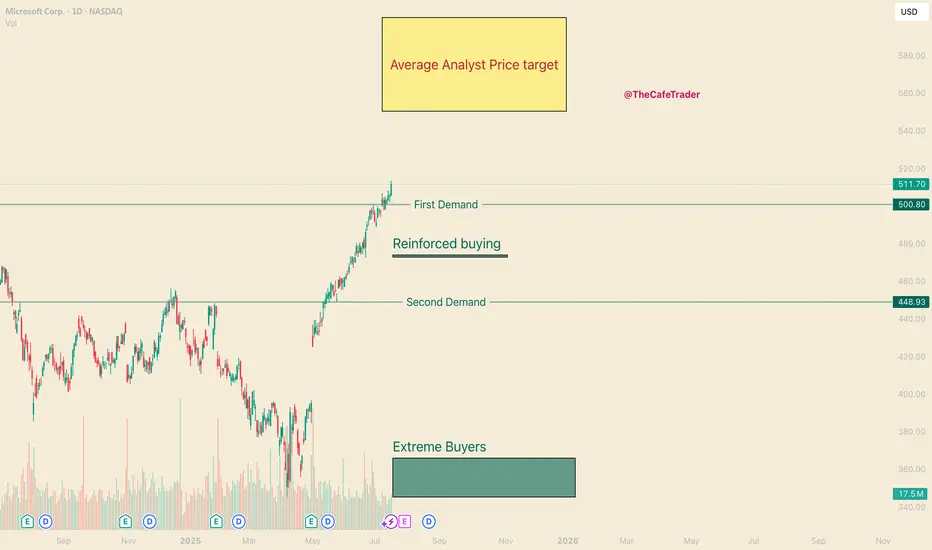
🧭 Areas of Interest on the Chart:
1. Yellow Box (Target Zone):
→ $550–$600 is the broader analyst price target range.
2. First Demand Line (~$500):
Recent signs of active buyer interest. If bulls remain in control, this could act as a springboard.
3. Reinforced Buyer Zone (~$472–$474):
This area has been tested and defended before. It’s a strong pullback entry if momentum stalls.
4. Second Demand Line (~$449):
A previous base of institutional accumulation. Price may revisit here in a broader market dip.
5. Deep Buyer Zone (~$344–$365):
A rare but powerful level where big money entered aggressively. It’s unlikely we revisit this zone — but if we do, it could be a great buy.
⸻
🧠 Strategy Summary:
• Aggressive buyers may consider entering around $500, where recent demand appeared.
• More patient traders might wait for MSFT to pull back into the $449–$474 range, where institutional interest has been high.
• The $344–$365 zone is a long shot — but would be a massive value area if touched.
⸻
That’s it for the long-term outlook on MSFT.
For more short-term trades and entries, check out my other posts — especially as we continue tracking the MAG 7.
@thecafetrader
Microsoft Soars to Record High Following Strong Earnings ReportMicrosoft Stock (MSFT) Soars to Record High Following Strong Earnings Report
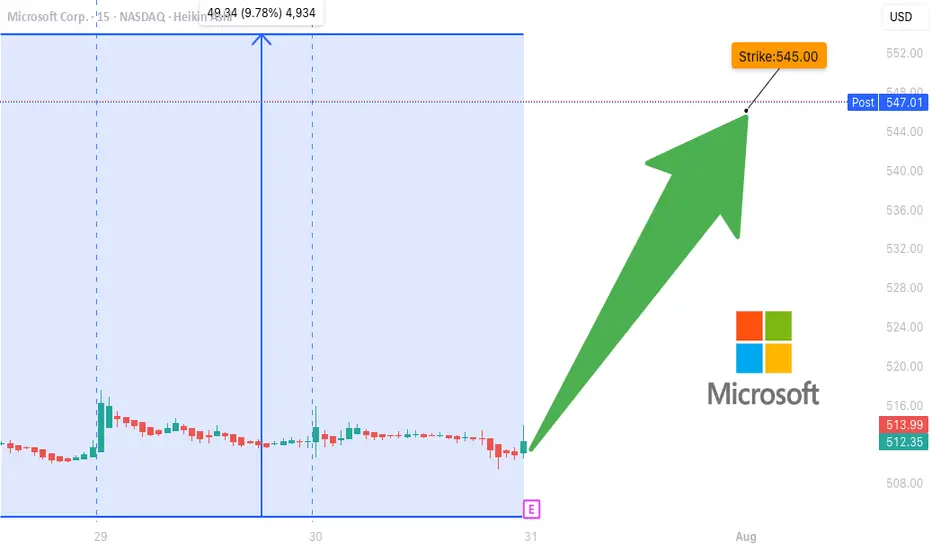
As the chart illustrates, Microsoft (MSFT) shares surged sharply after the close of the regular trading session – an immediate market reaction to the company’s strong quarterly results.
According to available data, MSFT's post-market price jumped to $555 per share, exceeding its previous all-time high by more than 8%.
Why Did MSFT Share Price Rise?
The quarterly report provided several reasons for optimism, including:
→ Earnings per share (EPS) came in at $3.65, beating analysts’ expectations of $3.37 by over 8%. Revenue also exceeded forecasts, totalling $76.4 billion versus the projected $73.9 billion.
→ Microsoft’s cloud revenue rose by 27% to $46.7 billion, while Azure’s annualised revenue exceeded $75 billion, driven by growing demand for AI-related services.
In response to these results, Barclays analysts quickly raised their price target for Microsoft shares from $550 to $625.
Technical Analysis of MSFT Chart
It is worth noting that the previous quarterly report was also strong, resulting in the formation of a large bullish gap on 1 May, followed by a sustained upward trend (highlighted by the purple trendline S). Importantly, the gap in the $395–425 range remains unfilled.
Yesterday’s report is also likely to result in a large bullish gap at the market open today, though this time, the market context could lead to a different scenario.
The key factor here is the long-term ascending channel (shown in blue), which reflects MSFT’s price movements throughout 2024–2025. After the previous strong report, the share price moved from the median to the upper boundary of the channel without setting a new record high. However, following the most recent report, the price has surged deep into overbought territory, potentially setting a multi-month high on the RSI and achieving a significant breakout to a new record.
As a result, once the initial excitement around the earnings subsides – and the desire of investors to close long positions intensifies – MSFT could undergo a correction from the upper boundary of the channel. In this scenario, the following support levels could come into play:
→ The psychological level of $550 in the short term;
→ The S trendline, as a possible support during a deeper correction.
This article represents the opinion of the Companies operating under the FXOpen brand only. It is not to be construed as an offer, solicitation, or recommendation with respect to products and services provided by the Companies operating under the FXOpen brand, nor is it to be considered financial advice.
MSFT Earnings Play (2025-07-31) — STRONG BULLISH SETUP
**🚨 MSFT Earnings Play (2025-07-31) — STRONG BULLISH SETUP 🚨**
**Microsoft \ NASDAQ:MSFT Pre-Earnings Trade Idea — 545C (Aug 1)**
---
### 🧠 **Earnings Thesis (🔥 80% Conviction)**
MSFT is set to report **BMO July 31**, and all signs point *bullish*:
📈 **Revenue Growth**: +13.3% YoY, driven by **AI + Cloud** momentum
💰 **Margins**: Profit 35.8%, Op 45.7%, Gross 69.1% — textbook pricing power
📊 **Guidance**: 100% beat history, avg. +5.8% surprise
📌 **Analyst Consensus**: 💪 Strong Buy | Target: \$549.90
📊 **Sector Tailwinds**: Tech favored in current macro with Fed on hold
➡️ **Score: 9/10 Fundamentals | Bullish Momentum Across the Board**
---
### 🔍 **Options Flow & Technicals**
🔥 **Implied Move**: \~6.3% by Aug 1
📉 **IV Rank**: 0.75 (Room to expand post-earnings)
💸 **Call Flow**: Strong OI in 540–550 zone, gamma buildup may fuel squeeze
📊 **RSI**: 70.14 → Bullish, close to overbought
📈 **Support**: \$505 | **Resistance**: \$518.29
➡️ **Score: 8/10 Options | 8/10 Technicals**
---
### 🧨 Trade Setup: 545 CALL (Aug 1 Exp)
🎯 **Entry Price**: \$0.90
📅 **Expiry**: 2025-08-01
📈 **Profit Target**: \$1.80 (⚡️+100%)
🛑 **Stop Loss**: \$0.45
📐 **Size**: 2 contracts (2% portfolio risk)
💡 **Timing**: Enter **EOD July 30 (Pre-earnings)**
⚠️ **IV Crush Alert** → Exit within 2 hours *post-earnings*
---
### ✅ RISK PLAN
* Position: Max 2–3% of portfolio
* IV crush & gap protection: Tight stop and quick post-earnings exit
* Exit Plan: \$1.80 or Stop \$0.45, OR close manually after earnings move
---
📊 **Trade JSON Snapshot**
```json
{
"ticker": "MSFT",
"direction": "CALL",
"strike": 545,
"entry": 0.90,
"target": 1.80,
"stop": 0.45,
"expiry": "2025-08-01",
"entry_time": "EOD Jul 30",
"earnings_date": "2025-07-31 BMO",
"confidence": "80%",
"expected_move": "6.3%",
"iv_rank": "0.75"
}
```
---
🧠 **Summary**
MSFT is poised for a **clean earnings beat** with bullish fundamentals, strong options flow, and upside momentum. This is a **high-conviction, short-dated trade** with defined risk.
🎯 **Watchlist it. Size smart. Exit fast.**
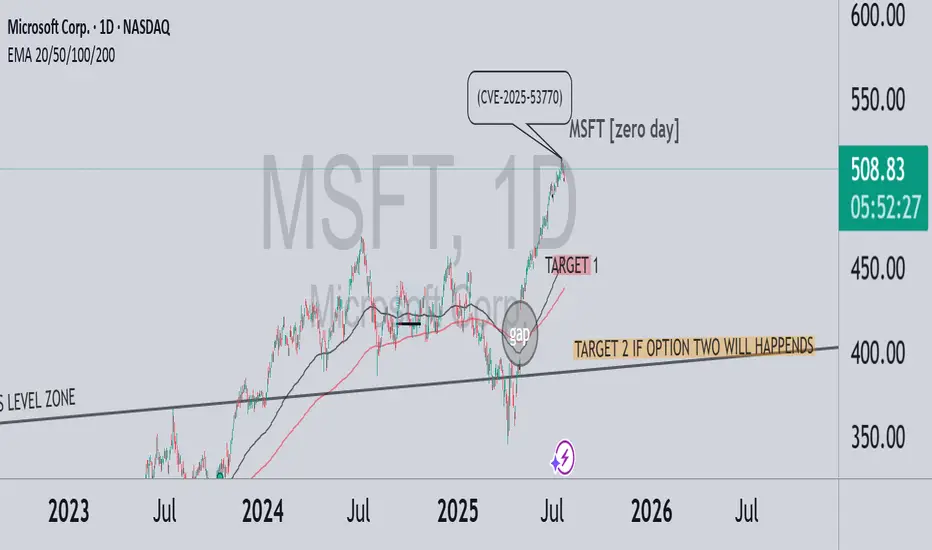
MSFT – A correction brewing? zero day CRWD-like scenario?In July 2025, a critical vulnerability in Microsoft SharePoint (CVE-2025-53770) was exploited by threat actors globally. Although the issue was first reported during the Pwn2Own Berlin competition back in May, Microsoft delayed the patch — allowing attackers a significant head start. Over 400 servers and dozens of organizations were breached, including U.S. and European government entities.
💬 On July 18, Reddit users began discussing the flaw’s severity, comparing it to past vulnerabilities like Log4j. Interestingly, this coincided with the first significant technical deviation from the bullish trend — marking a potential beginning of downside momentum.
🔍 In the chart above:
Strong bullish run until the Zero-Day disclosure
Clear gap beneath current price action
TARGET 1 reflects a natural technical retracement toward EMA 50–100 and the mid-term trendline
TARGET 2 is conditional – it only applies if a massive event occurs, similar to what we saw with CRWD
⚠️ Key distinction:
CrowdStrike: A software update bug caused a global Windows crash — no cyberattack, but massive operational impact
Microsoft: A real, actively exploited security vulnerability — with long-tail risk for data leaks, ransomware, and regulatory backlash
🎯 Conclusion:
If the SharePoint exploit escalates in visibility or consequences, and Microsoft fails to contain the damage — we could see extended downside pressure. TARGET 2 remains valid only under a high-severity scenario, like CRWD’s global meltdown.
Indicator Decoded: RSI Mega Zones: Signals from the EdgeMost traders are familiar with the textbook RSI levels—70 indicating overbought and 30 indicating oversold. But markets, especially in strong momentum phases, do not always obey these boundaries. That is where the concept of Mega Overbought and Mega Oversold zones becomes vital. These are not fixed thresholds, but adaptive zones often beyond 80 and below 20, where the RSI reflects extreme strength or weakness. Rather than acting as reversal points, these levels often signal trend continuation.
A reading above 80 is typically seen during powerful uptrends or post-breakout rallies. It indicates not just buying, but unhesitating, aggressive demand, especially after key resistance zones have been cleared. Such RSI levels have often not been seen in several months—if not more than a year—making their appearance especially significant. Rather than a signal of exhaustion, this may be the start of a major trend, suggesting that the broader structure of the stock or index has shifted decisively. Traders who misinterpret this as a reversal signal often find themselves fighting momentum. Instead, price tends to grind higher, sometimes pausing briefly before further gains. This is why the chapter suggests using Mega Overbought zones as confirmation of bullish control, not a trigger for counter-trades.
The inverse applies to the Mega Oversold zone—RSI falling below 20. This is usually not a buy-the-dip moment, especially if the broader trend and chart structure are bearish. Such readings typically accompany panic-driven breakdowns, where sellers dominate without any counterforce. These extreme values are often rare and may not have appeared for months or even over a year, marking a moment where the market’s character may be undergoing a structural change. As with Mega Overbought, context is critical. If RSI hits such depths after prolonged distribution or a topping pattern, it does not indicate value—it confirms that the tide has turned, and a strong downtrend may be setting in.
Both Mega zones are best used in conjunction with structure—trendlines, volume shifts, anchored VWAP zones, or price patterns. The RSI alone is not enough. But when it aligns with other technical signals, a Mega Overbought or Oversold status becomes a momentum amplifier, not a contrarian prompt. In fact, your RSI chapter rightly warns that entering against such zones can be fatal unless clear divergences, climax patterns, or volume exhaustion are also present. Think of these extremes not as ceilings or floors, but as accelerators when backed by structure.
A word of caution: These signals are rare and often widely spaced. The real challenge lies in managing risk–reward, as strong momentum and shallow pullbacks can make it difficult to find entries with favourable R:R ratios.
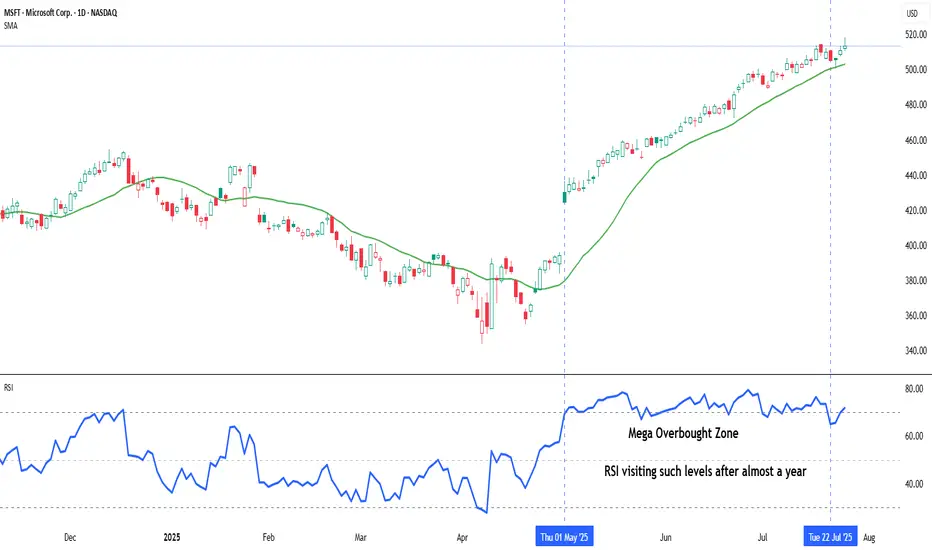
Chart: Microsoft Corp. (MSFT) – Daily Chart with 20-DMA and RSI (as on July 25, 2025)
Microsoft continues its strong upward trajectory, with price action staying well above the rising 20-day simple moving average. The recent surge in RSI into the mega overbought zone marks a significant shift in momentum, as the indicator revisits such elevated levels after nearly a year—an occurrence that often coincides with extended bullish phases.
Microsoft’s Big Moves This Quarter | From Activision to AI AgentMicrosoft’s Revenue Surge: The Power of AI, Gaming, and Strategic Investments
Microsoft has released its Q1 FY25 earnings for the quarter ending in September
The stock saw a 6% drop, indicating the results fell short of investors' high hopes. Trading at over 30 times projected earnings for next year, expectations for Microsoft were significant.
CEO Satya Nadella stated
“Our AI business is set to exceed an annual revenue run rate of $10 billion next quarter, making it the fastest business in our history to reach this milestone.”
This means that AI will soon account for about 4% of Microsoft's total revenue in under three years a remarkable feat for a global giant.
If you need a quick summary, here are three main points:
1. ☁️ Azure’s growth is slowing. As Microsoft’s key player in the AI competition, Azure grew 34%, down slightly from 35% in the prior quarter (after adjustments). This comes as Google Cloud raised the bar, with its growth accelerating from 29% to 35% during the same period.
2. 🤖 AI growth is limited by hardware supply, as capacity struggles to meet demand. Data center expansion is a long-term process, and Microsoft is investing heavily in infrastructure, aiming for a growth boost by 2025.
3. 👨👩👧👦 Consumer-focused products like Gaming and Devices are underperforming. Although not essential to Microsoft's core business, their poor performance has impacted overall results.
Here’s a breakdown of the insights from the quarter.
Overview of today’s insights:
- New segmentation.
- Microsoft’s Q1 FY25 overview.
- Key earnings call highlights.
- Future areas to monitor.
1. New Segmentation
Revised Business Segments
In August, Microsoft announced a reorganization of its business segments, effective this quarter. The purpose? To better align financial reporting with the current business structure and strategic management.
Summary of the main changes
- Microsoft 365 Commercial revenue consolidation: All M365 commercial revenue, including mobility and security services, now falls under the Productivity and Business Processes segment.
-Copilot Pro revenue shift: Revenue from the Copilot Pro tool was moved from Productivity and Business Processes to the More Personal Computing segment under Search and news advertising.
-Nuance Enterprise reallocation: Revenue from Nuance, previously part of Intelligent Cloud, is now included in Productivity and Business Processes.
-Windows and Devices reporting combination: Microsoft now reports Windows and Devices revenue together.
Impact of These Changes:
Core Segments Overview:
In summary:
- The Productivity and Business Processes segment has grown significantly.
- The Intelligent Cloud segment has decreased due to the reallocation of Nuance and other revenue.
Products and Services Overview:
- M365 Commercial now includes Nuance, shifted from the Server products category, along with integrated mobility and security services.
- Windows & Devices have been merged into a single, slower-growth category.
Additional Insights:
- Azure, Microsoft's cloud platform, is reported within 'Server products and cloud services.' Although its growth rate is shared by management, exact revenue figures remain undisclosed.
Azure’s past growth figures have been adjusted for consistency, with the last quarter’s constant currency growth recast from 30% to 35%, setting a higher benchmark. Tracking these metrics is challenging due to limited revenue disclosure, but this recast indicates Azure's raised growth expectations.
2. Microsoft’s Q1 FY25 Performance
Financial Summary:
-Revenue: Up 16% year-over-year, reaching $65.6 billion (exceeding estimates by $1 billion). Post-Activision Blizzard acquisition in October 2023, the growth was 13% excluding the merger.
New Product and Services Segmentation Results
- Server products & cloud services: $22.2 billion (+23% Y/Y).
- M365 Commercial: $20.4 billion (+13% Y/Y).
- Gaming: $5.6 billion (+43% Y/Y), influenced by Activision.
- Windows & Devices: $4.3 billion (flat Y/Y).
- LinkedIn: $4.3 billion (+10% Y/Y).
- Search & news advertising: $3.2 billion (+7% Y/Y).
- Enterprise & partner services: $1.9 billion (flat Y/Y).
- Dynamics: $1.8 billion (+14% Y/Y).
- M365 Consumer products: $1.7 billion (+5% Y/Y).
Core Business Segments Breakdown:
- Productivity and Business Processes: Increased 12% Y/Y to $28.3 billion, supported by M365 Commercial, especially Copilot adoption.
- Intelligent Cloud: Grew 20% Y/Y to $24.1 billion, with Azure AI driving growth.
- More Personal Computing: Grew 17% Y/Y to $13.2 billion, including a 15-point boost from Activision. Devices fell, but search and ad performance improved under new segmentation.
Key Observations:
- Microsoft Cloud revenue climbed 22% Y/Y to $39 billion, making up 59% of total revenue (+3 percentage points Y/Y).
- Azure continues to drive cloud services and server products' growth.
- Xbox growth has surged due to the Activision acquisition since Q2 FY24, expected to stabilize by Q2 FY25.
- Windows OEM and devices combined, showing a 2% decline in Q1 FY25.
- Office rebranded to Microsoft 365; updated naming will be used starting next quarter.
- Margins: Gross margin at 69% (down 2pp Y/Y, 1pp Q/Q); operating margin at 47% (down 1pp Y/Y, up 4pp Q/Q).
- EPS: Increased 10% to $3.30, beating by $0.19.
Cash Flow and Balance Sheet:
- Operating cash flow: $34 billion (52% margin, down 2pp Y/Y).
- Cash**: $78 billion; Long-term debt**: $43 billion.
Q2 FY25 Outlook:
- Productivity and Business Processes: Anticipated 10%-11% Y/Y growth, steady due to M365, Copilot inclusion, and expected LinkedIn growth of ~10%. Dynamics set to grow mid-to-high teens.
- Intelligent Cloud: Projected 18%-20% Y/Y growth, slightly slowing, with Azure growth expected between 28%-29%.
- More Personal Computing: Forecasted ~$14 billion revenue, declines in Windows, Devices, and Gaming anticipated, with some offset from Copilot Pro.
Main Takeaways:
- Azure's growth slowed to 34% Y/Y in constant currency, with AI services contributing 12pp, up from 11pp last quarter. This marks a dip from the recast 35% prior and included an accounting boost.
- Capacity limitations in AI persist; more infrastructure investments are planned, with reacceleration expected in H2 FY25.
- Commercial performance obligations grew 21% to $259 billion, up from 20% in Q4.
- Margins were pressured by AI infrastructure investments; Activision reduced the operating margin by 2 points.
- Capital expenditures increased by 50% to $15 billion, half dedicated to infrastructure, with further Capex growth expected.
- Shareholder returns included $9.0 billion through buybacks and dividends, matching Q4 repurchases.
Earnings Call Highlights:
Azure AI saw a doubling of usage over six months, positioning it as a foundation for services like Cosmos DB and SQL DB. Microsoft Fabric adoption grew 14% sequentially, signaling rapid uptake.
AI Expansion: GitHub Copilot enterprise use surged 55% Q/Q, with AI-powered capabilities used by nearly 600,000 organizations, a 4x increase Y/Y.
M365 Copilot has achieved a 70% adoption rate among Fortune 500 companies and continues to grow rapidly.
LinkedIn saw accelerated growth in markets like India and Brazil and a 6x quarterly increase in video views, aligning with broader social media trends.
Search and Gaming: Bing’s revenue growth surpassed the market, while Game Pass hit a new revenue record, propelled by Black Ops 6
Capital Expenditures: CFO Amy Hood highlighted that half of cloud and AI investments are for long-term infrastructure, positioning the company for sustained growth.
4. Future Outlook
Energy Needs: Microsoft, facing higher power demands, plans to revive a reactor at Three Mile Island with Constellation Energy by 2028 to power its AI data centers sustainably.
Autonomous AI Agents: Coming in November, these agents will perform tasks with minimal human input, enhancing efficiency. Copilot Studio will allow businesses to customize these agents, with 10 pre-built options to start.
Industry Impact: Salesforce has launched Agentforce, signaling increased competition. CEO Mark Benioff recently compared Microsoft’s Copilot to the nostalgic Clippy, stoking rivalry.
For further analysis stay tuned
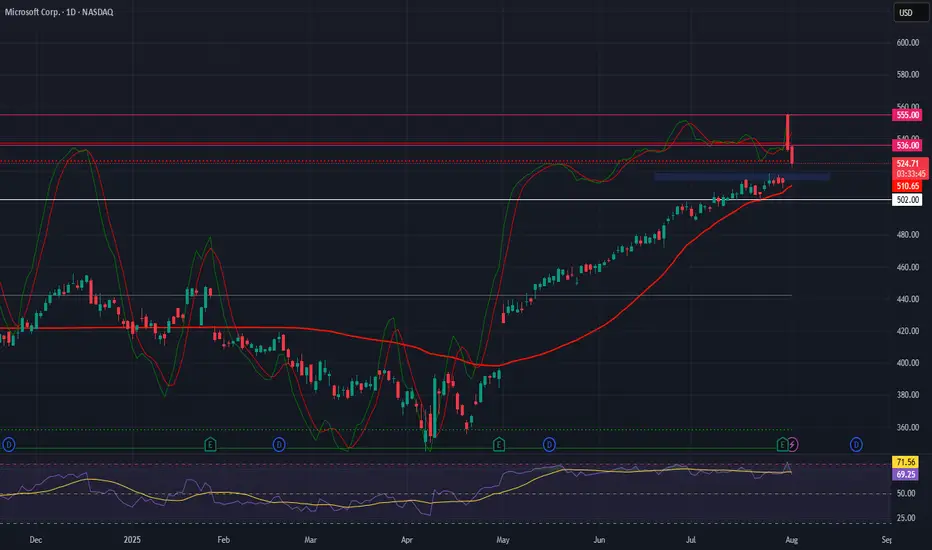
Microsoft (MSFT)–Watching for Pullback Entry After $4T MilestoneMicrosoft Corp. NASDAQ:MSFT has become the second company after Nvidia to cross the $4 trillion market cap, powered by strong AI and cloud demand.
Azure revenue grew 34% to $75B in 2024, with a $30B AI infrastructure investment fueling future growth. Q4 EPS came in at $3.65 on $76.4B revenue, showing strong fundamentals.
We are looking for a pullback to key support for a long entry:
Trade Plan:
Entry Zone: $515 – $518
Take Profit: $536, $555
Stop Loss: $502
#Microsoft #MSFT #Stocks #Trading #StockMarket #TechnicalAnalysis #AI #Cloud #BigTech #NASDAQ
MSFT – Testing Key Resistance at 540. Aug. 5MSFT – Testing Key Resistance at 540, GEX Points to Potential Upside Breakout 🚀
Technical Overview:
Microsoft (MSFT) is consolidating near the 537 zone after a strong late-July rally. The 1H chart shows steady higher lows forming since the 505 bottom, with price now pressing against the 540 resistance zone. This level is important as it coincides with a major GEX call wall and historical supply.
GEX / Options Sentiment:
* Highest Positive NETGEX / Gamma Resistance sits right at 540 — a breakout here would shift dealer hedging flows bullish and could accelerate price toward 545–555.
* 2nd Call Wall: 540 with 75.08% call concentration.
* Support: 530–532 zone, with heavier put positioning (-8.26%) at 515, which also acts as a downside guardrail.
* If 515 breaks, dealers may unwind further, opening risk toward 505.
Thoughts & Option Suggestions:
* Bullish Play: Wait for a confirmed 540 breakout with strong volume. Calls targeting 550–555 could benefit from a gamma squeeze if momentum accelerates.
* Bearish Play: A rejection at 540 followed by a break below 530 could open a quick move to 520–515. Short-dated put spreads could work here.
* Neutral: If MSFT stays pinned between 530–540, selling premium (iron condor or credit spreads) could work for range traders.
15-Minute Intraday View:
* Short-term trend is bullish with higher lows.
* Intraday momentum builds above 538 could quickly retest 540.
* Watch for a rejection at 540 — if it happens early in the session, a pullback to 533–532 is likely before any bounce attempt.
Disclaimer: This analysis is for educational purposes only. Always do your own research and manage risk before trading.

Don't Short MSFT. 2 long scenarios. Hi, I’m The Cafe Trader.
Today we’re diving into the heart of this very bullish run on MSFT. One of the key lessons I’ve learned:
Never get in the way of a strong bull trend — especially just after a breakout.
⸻
🔍 Price Action Overview:
MSFT has been respecting a strong trendline since its initial gap-up.
This has created multiple breakout trade opportunities — and we’ve just spotted another one. I’ve also outlined a secondary setup worth watching.
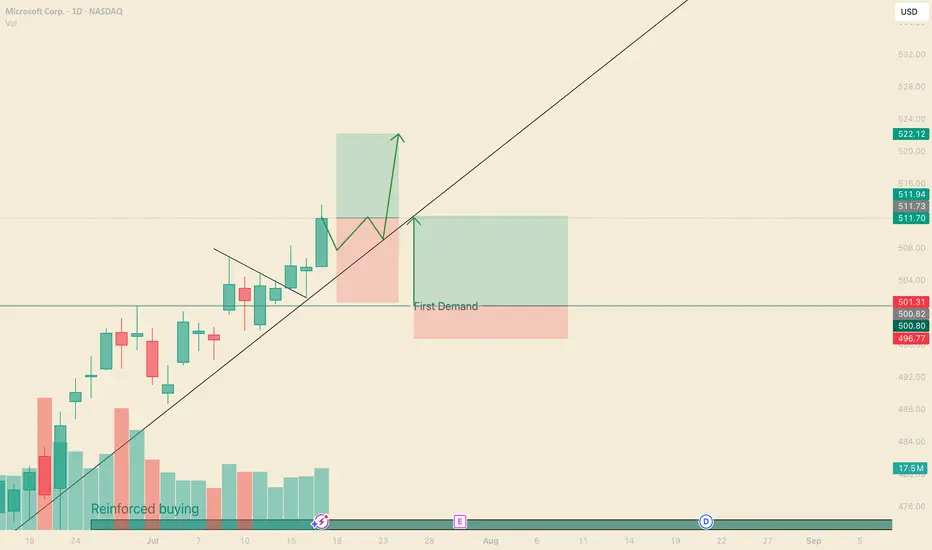
We recently completed a 3-bar break.
Combine that with rising volume, and this suggests a potential move to $522.23.
⏳ I’m expecting a brief consolidation (2–3 trading days) before the next leg up.
⸻
🟢 Trade Setup:
• Entry: $511.70
• Risk Level: Trade remains valid until a daily close below $500
• Reward: TP at $522.23
• Risk-to-Reward: 1:1 at entry; improves with any dip before breakout
⸻
💡 Optional Trade: Swing Trading Options
Options are about two things: price and timing.
Right now, timing looks great — but option pricing is a bit high.
The key is to go from out-of-the-money to in-the-money, and to give yourself at least 5 days on your contracts.
Here are some strike prices I’m watching (assumes expiration 7/25 or later):
• $515 Call — Entry: $2.00 or less → TP: $6.00+
• $517.5 Call — Entry: $1.30 or less → TP: $3.90+
• $520 Call — Entry: $0.70 or less → TP: $2.10+
These levels give you a strong RR if you can catch the right pullback.
⸻
🔁 Secondary Trade Idea: Bounce at $500
The $500 level is both a psychological number and a reinforced demand zone.
While it overlaps with the stop on our main setup, this trade assumes MSFT pushes higher first, then retraces to $500 for a fresh leg up.
This area will likely play a key role in future price action.
If we see a pullback into this zone with contextual selling pressure, it could offer a clean high-probability bounce.
Take profit levels would depend on how price behaves as it sells into this level — but keep this area marked.
⸻
Thanks for reading — be sure to check out my other MAG 7 analysis.
@thecafetrader
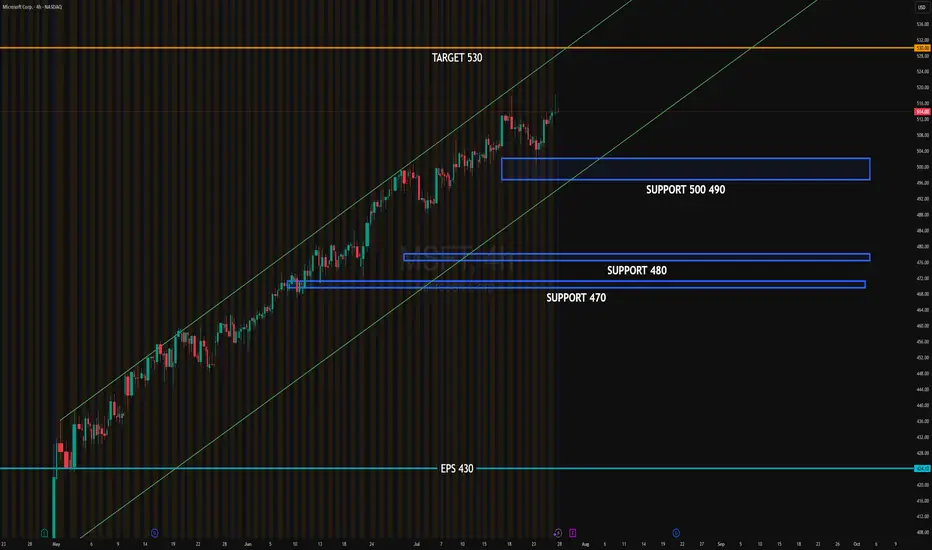
MSFT EARNINGSMicrosoft (MSFT) is consolidating near the upper edge of its ascending channel, with strong institutional defense between 490–500. The 510–520 range shows absorption and may trigger a directional breakout. A close above 515 could ignite momentum toward 530.
Upside target: 530
Downside target: 490 (support) then 480
#MSFT #globaltrade #investment #investing #stockmarket #wealth #realestate #markets #economy #finance #money #forex #trading #price #business #currency #blockchain #crypto #cryptocurrency #airdrop #btc #ethereum #ico #altcoin #cryptonews #Bitcoin #ipo
Microsoft hits record highs days before earnings dayMicrosoft Corporation (symbol ‘MSFT’) share price reached a new all-time high on July 17 at $511.70 while on July 18 it even reached $514.64 intraday. The company’s earnings report for the fiscal quarter ending June 2025 is expected to be released on Wednesday, July 30th, after market close. The consensus EPS is $3.35 against $2.95 of the same quarter last year.
Microsoft is still holding its higher market cap compared to its main competitor, Apple, with $3.75 trillion against $3.02 trillion. Recently, Microsoft’s web-based platform “SharePoint” was hijacked, with Microsoft quickly reacting with patches to resolve the issue. As of today, there was no significant effect on the share price, but as the story unfolds, we might see some market reaction.
Technical analysis shows that the price has found sufficient support on the lower band of the Bollinger bands in early April and has since entered a rather aggressive bullish rally until the day of this report being written. As a result of the bullish rally, the Stochastic oscillator has been pushed to extreme overbought levels and has recently corrected to neutral levels, hinting that the price could move in either direction in the near short term. On the other hand, the moving averages are still validating an overall bullish trend in the market while the Bollinger bands are quite contracted, showing that volatility has dried up, and it might take some time to witness any significant moves.

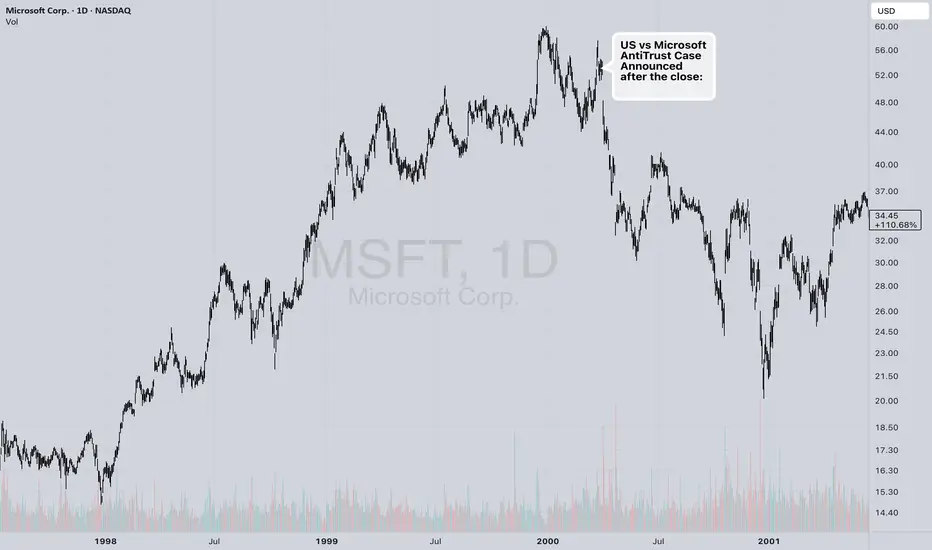
Does Everyone Remember Why The Bubble Popped in Y2K?I heard on Bloomberg Television this morning that they didn't have any recollection of a good reason for the stock market bubble of 1995-2000 to pop. I was stunned that a portfolio manager of such standing had the guts to say that he didn't understand why the market topped in 2000.
This is how history gets re-written by people who didn't pay attention and didn't learn from the past, so how can we trust anything that we read, see, hear today? People don't remember. Why don't people remember? I think that is the fodder for someone to write a book, which isn't the point of this publication today.
What I think "market history" means to us is that there is a fair and unbiased reporting of history and what TradingView does by keeping people's published charts online and not deleting bad forecasts is very refreshing. When TradingView started, I knew immediately that this model was the way to go. It was easy for people to "delete a Tweet" about their "buy recommendation" that didn't pan out. It was easy for people to "lie by omission" by removing the bad forecasts and keeping the ones that worked.
I can add a couple of other points about the Y2K top: One of them was the SEC chairman Arthur Levitt starting the idea of a rule in December 1999 for "Fair Disclosure". This eliminated anyone getting any special information ahead of the crowd and assured a 'level playing field.'
There was another Government Regulation to limit the speed of dial up internet access to 53K from the stated 56K speed. This was in 2000.
The chart published is the close of March 31, 2000 when the Gov't announced their ANTI-TRUST CASE AGAINST MICROSOFT with the stock at $53.13. On Monday, NASDAQ:MSFT opened at $47.22 closed at $45.44, -7.69 that day and proceeded to drop to $20.13 over the ensuing bear market. $53.13 to $20.13 is a massive $33 point drop.
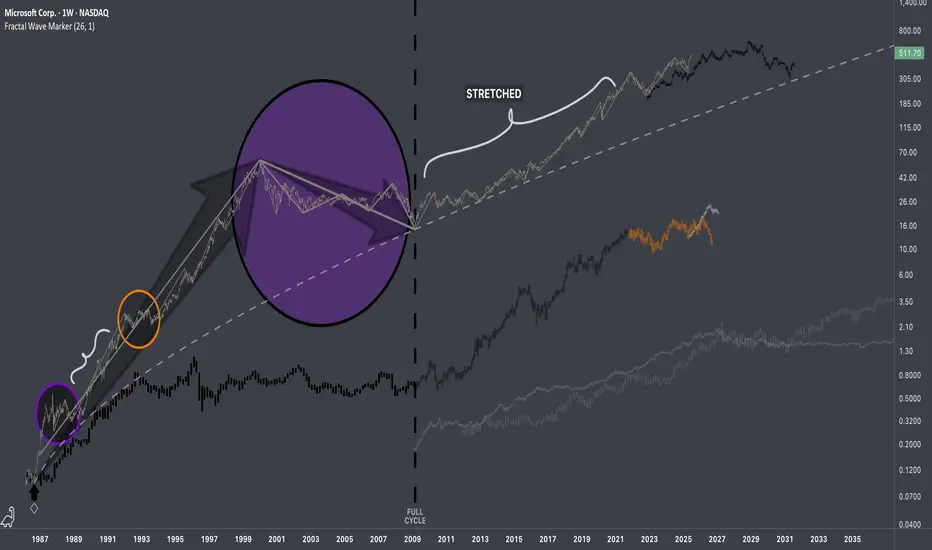
$MSFT: Fractal Hierarchy IResearch Notes
Fluctuations reappearing at broader scale.
If both are manifestations of the same pattern, then the next segments can be applied accordingly.
The remaining part can be deformed (depending on future volatility which can accelerate completion of composite sub-cycles)
Documenting it publicly to keep record of these particular recurring patterns.
Microsoft Sees Declining Trading Volume Despite All Time HighsSince December of 2021, MSFT traded within a Rising Wedge structure that has gradually resulted in lower and lower highs in volume, at the same time IV on the Options Chain has begun to price down the strikes above $515 while Shorter Term Downside IV has begun to price up all the way out to $240.00. If this trend continues we will likely see the $515 area act as strong resistance as liquid interest above it begins to dry out.
This could be the beginning of a move to break down the wedge and trade down to the lower strikes first targeting the $365 price level and resolving around $240 near the 200 Period SMA.
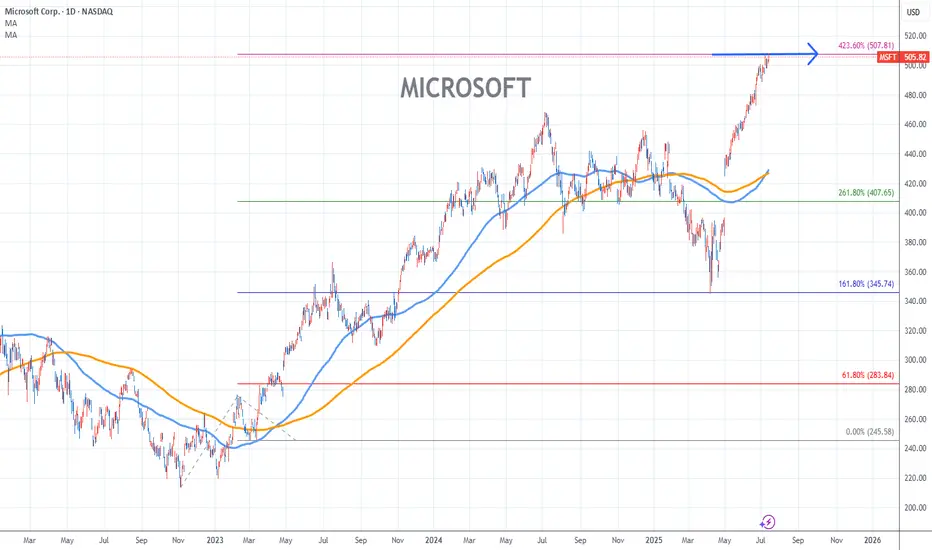
MICROSOFT Stock Chart Fibonacci Analysis 071525Trading idea - Hit the top > 507/423.60%
Chart time frame:D
A) 15 min(1W-3M)
B) 1 hr(3M-6M)
C) 4 hr(6M-1year)
D) 1 day(1-3years)
Stock progress:E
A) Keep rising over 61.80% resistance
B) 61.80% resistance
C) 61.80% support
D) Hit the bottom
E) Hit the top
Stocks rise as they rise from support and fall from resistance. Our goal is to find a low support point and enter. It can be referred to as buying at the pullback point. The pullback point can be found with a Fibonacci extension of 61.80%. This is a step to find entry level. 1) Find a triangle (Fibonacci Speed Fan Line) that connects the high (resistance) and low (support) points of the stock in progress, where it is continuously expressed as a Slingshot, 2) and create a Fibonacci extension level for the first rising wave from the start point of slingshot pattern.
When the current price goes over 61.80% level , that can be a good entry point, especially if the SMA 100 and 200 curves are gathered together at 61.80%, it is a very good entry point.
As a great help, tradingview provides these Fibonacci speed fan lines and extension levels with ease. So if you use the Fibonacci fan line, the extension level, and the SMA 100/200 curve well, you can find an entry point for the stock market. At least you have to enter at this low point to avoid trading failure, and if you are skilled at entering this low point, with fibonacci6180 technique, your reading skill to chart will be greatly improved.
If you want to do day trading, please set the time frame to 5 minutes or 15 minutes, and you will see many of the low point of rising stocks.
If want to prefer long term range trading, you can set the time frame to 1 hr or 1 day.
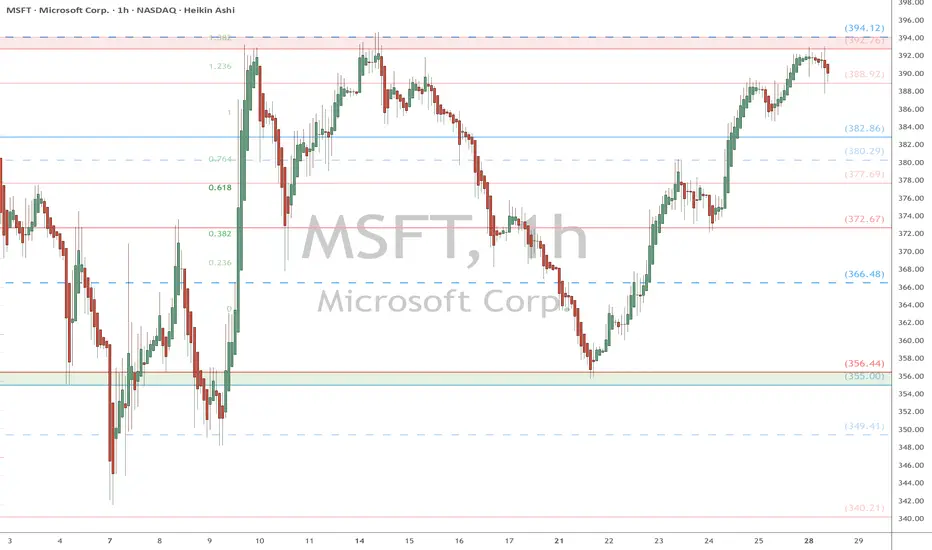
MSFT watch $392.76-394.12: Key Resistance to Tariff RecoveryMSFT testing a well proven Resistance zone $392.76-394.12
This zone rejected twice already, now may be ready to break?
Fib reactions have been precise, so look for Break-n-Retest
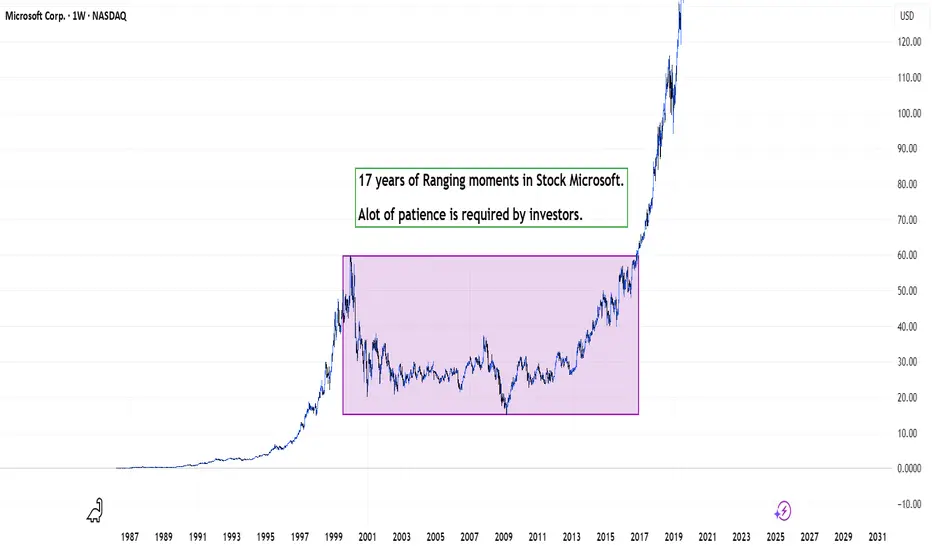
Microsoft from 2000 to 2017 - Ranging Moments - 13/07/2025A lot of patience is required by Investors.
Stakeholders' Trust and good faith are required in company products & services. Also Board of Directors and Company Management play a big role in growing the company.
An amazing point I can notice,
During this period, Steve Ballmer was from 2000 to 2014.
The CEO plays a crucial role in determining the company's hard pocket returns for investors or the highest risk for investors.
After Stever Ballmer left his position, Microsoft did 10X in stock price.
From approx $50 to $500 within the period of 8 years only.
So What made Microsoft in ranging price points for that period?
Innovation?
Bad Choices of Acquisition?
If you have any good points to connect, comment down on this post?
Happy trading.
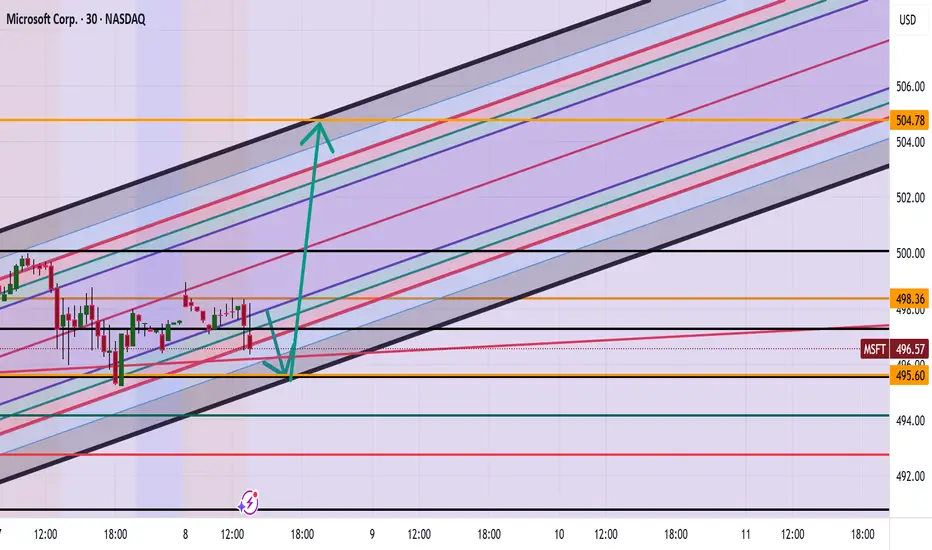
MSFT Correction then to 504?Morning everyone
Currently we are seeing a possible correction to the 495 zone with a possible break to the upside to 504 is what we are currently seeing.
Trade Smarter Live Better
Kris/Mindbloome Exchange
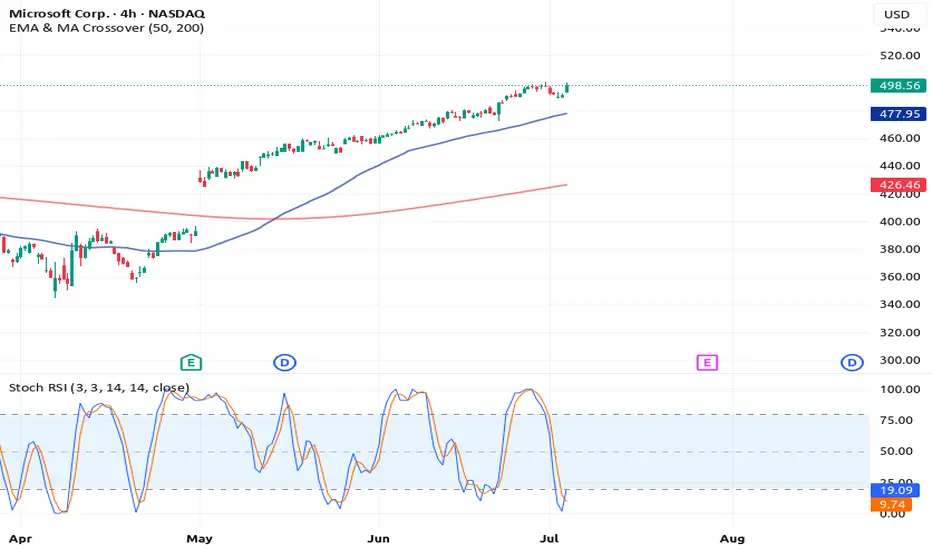
Microsoft (MSFT) 4H Buy Signal – Rocket Booster Strategy🚀 Microsoft (MSFT) 4H Buy Signal – Rocket Booster Strategy Activates on Gap-Up, Volume Spike, and Stoch RSI Reversal 📈
-
Microsoft (MSFT) has just triggered a compelling buy signal on the 4-hour chart, with multiple layers of confluence aligning to
-
support a bullish continuation. This setup fits perfectly into what I call the Rocket Booster Strategy — a system built to catch strong
-
upside moves right before they ignite.
-
Here’s what’s happening on the chart:
-
1. High Volume on the 4H Entry Candle
We’re seeing an above-average volume spike on the recent bullish 4H candle,
-
which tells me there’s strong participation behind the move — possibly institutional activity. High volume at key price levels
-
often acts as the first stage of a breakout acceleration.
-
2. Stochastic RSI Reversal from Oversold
-
The Stochastic RSI has curled back up from below the 20 line, printing a clear buy signal.
-
This reversal suggests that upward momentum is returning just as price confirms strength — a powerful combination.
-
3. Price Trading Above Both the 50 EMA and 200 EMA
-
MSFT is now well above the 50 EMA and 200 EMA on the 4-hour chart.
-
This alignment confirms a strong underlying trend. When price is supported by both short- and long-term moving averages,
-
it's a green light for trend-following strategies.
-
4. Bullish Gap-Up
-
The session began with a bullish gap-up, which acts like a "booster rocket" for momentum.
-
Gaps on tech stocks like Microsoft often attract short squeezes and breakout buyers
-
— this one could be the start of a new leg higher.
Strategy Context: Why This Setup Matters
-
The Rocket Booster Strategy works best when these four elements align:
-
Volume spike
Momentum reversal
EMA trend structure
Gap-up catalyst
-
With Microsoft showing all four in perfect sync, this becomes a high-probability continuation entry.
-
Trade Idea (Not Financial Advice)
-
Entry: Current 4H candle close or next retracement
Stop Loss: Just below the gap or the 50 EMA
Target: Previous swing high and extended target based on Fibonacci expansion
-
Final Thoughts
-
Microsoft rarely gives such clean setups, and when it does, it pays to watch closely. If momentum continues, this could set the tone for the rest of the week.
-
Always manage risk — no rocket launches without backup systems.
-
Let me know if you’re trading this setup too or have your own spin on the strategy. Feedback and chart ideas welcome!
Rocket booster engaged for MSFT? 🔥
Rocket Boost This Content To Learn More
Disclaimer:
This analysis is for educational and informational purposes only. It does not constitute financial advice or a recommendation to buy or sell any security.
Always do your own research and consult a licensed financial advisor before making any trading decisions. Trade at your own risk.
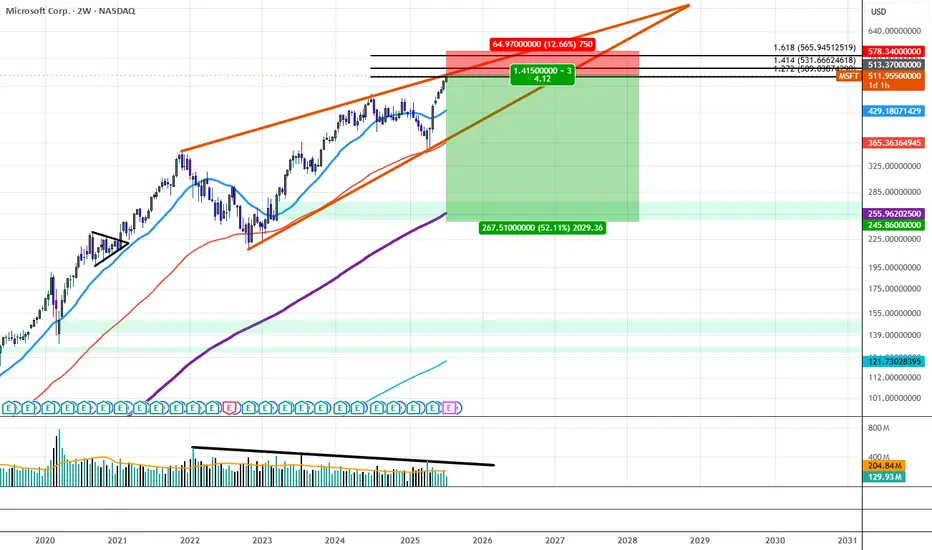
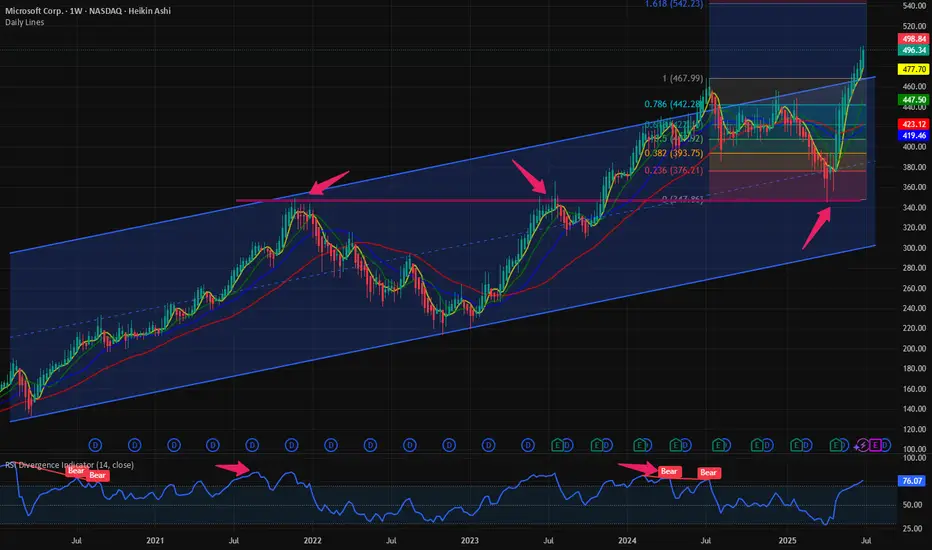
$MSFT: A Teflon stock turning hot, will it catch fire? Before you wonder why we call it a Teflon stock please check my blog on 27 April 2025.
NASDAQ:MSFT : A 'Teflon' stock refusing to budge under pressure for NASDAQ:MSFT by RabishankarBiswal
I pointed out the reason why this stock refused to go down below critical levels and held onto some impressive gains. And since then, we have rallied 33% from the lows of 360 and reached an ATH of 480 $. The buying pressure on the stock has pushed it above our upward sloping parallel channel which we have been following for more than 2 quarters. We always argued that the stock has support around 350 $ and is unlikely to break the support. We bounced back exactly 350 $ with 25 RSI indicating oversold conditions.
Currently with stock price above 480 $ the RSI looks over bought at 73. But in my opinion the bull run can continue for some more time unless we see a double top in the RSI just like in 2022 and 2024. Double tops usually result in breakdown. But until then there is a lot of runway ahead of us. If we plot the Fib extension levels from the top before Liberation Day to the bottom after the liberation day, then we see that the next level on the chart is 1.612 Fib level with a price of 542 $. NASDAQ:MSFT is a Teflon stock which is hot but might not catch fire and go to the moon. 😊
Verdict: More potential upside in $MSFT. Near term target 542 $.
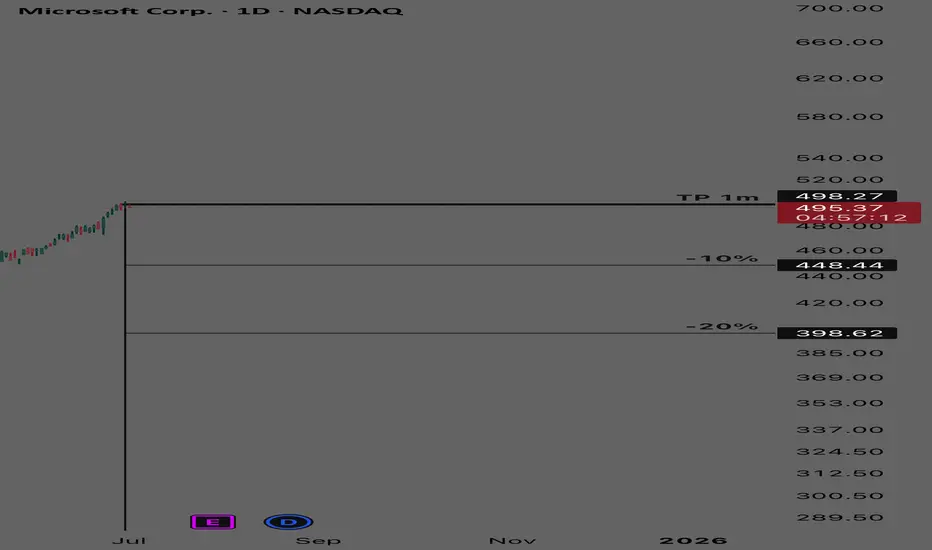
MSFT - Negative Bubble (Short term Buy Cycle) MSFT
Short Term Buy Cycle
TP@498.27
% bubble ratio
Currently in a short term buy cycle with fair value at 498.27
Spot trading plan:
Start to buy from (-10%) bubble ratio and below