NIO: Potencial moveLet me write in my profile that my English is bad, read exclusively with gritting my teeth =)
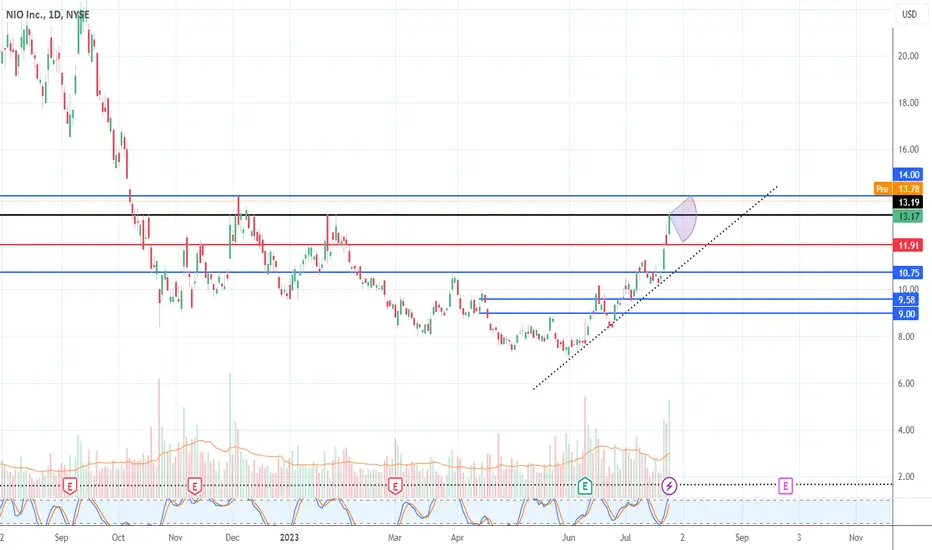
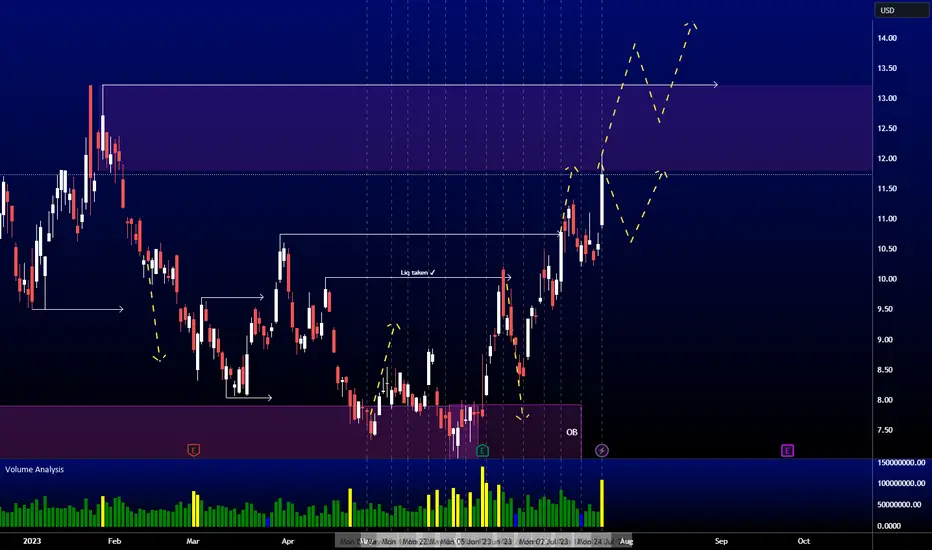
Let's look at another Chinese electric car manufacturer. Nio has a fairly wide consolidation channel, which you can see on the chart, even after breaking through the downtrend line, we should not talk about imminent big movements for this company. We may well consolidate at these levels for a sufficient amount of time. Now I propose to consider the option of going to the upper border of the channel, to the area of $14. A very important point will be the development of ema200, from which we can slightly correct.
This idea is not an investment recommendation. All cool deals and profits✅ Do not forget to subscribe and like, so I will understand that my "beautiful" English is extremely necessary for you =)
N3IA trade ideas

NIO can correct slightly when hitting the $14 resistanceNIO is on a decent run and will now face some resistance around $14.
Price might correct to $11.90-$12 region, in line with the trend line (dotted) I drafted, if we don't surpass the resistance level with a bull run.
I'm long on NIO. Entered $7.58 and $9.08.
NIO: $4.10 | reminds me of Pagani & Bentley | Target $100++the potential is great... and the beauty is it is organically growing to a huge market
for now we accumulate below $8.00
AMAZON is to BABA
TESLA is to NIO
everybody wins at the bottom towards $500bn $1Trillion cap

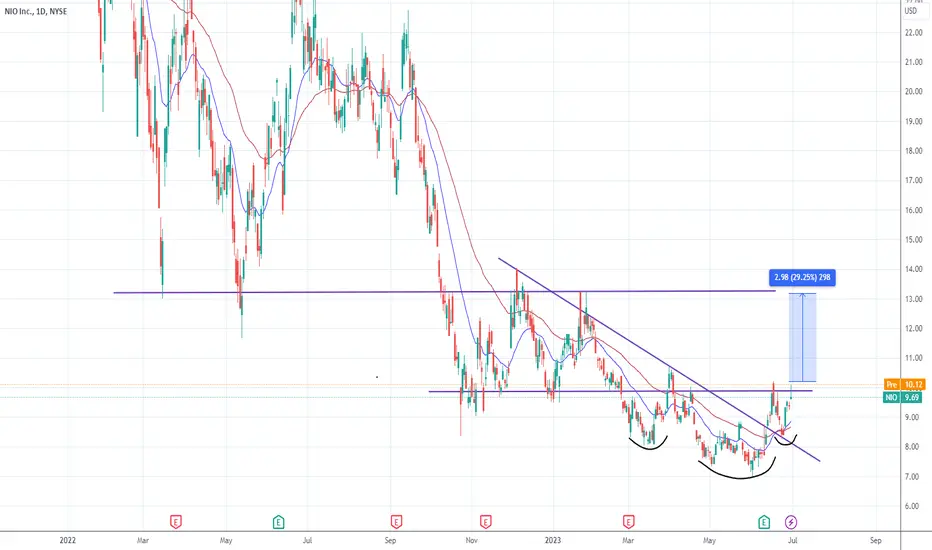
NIO quick longNIO stock is forming a reversal head and shoulders like structure, breaking above a major resistance level today, in premarket. Quick long trade for a ~30% gain
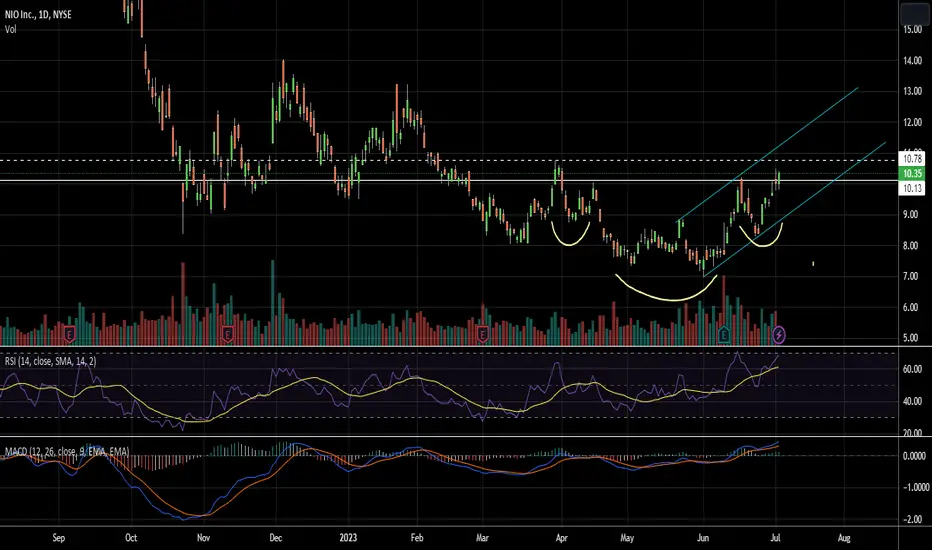
NIO Wedge Breakout ContinuesNIO continues to move higher after breaking out of of the falling wedge pattern and topping the 200-day moving average, currently up a little over 10% today and +20% from my entry of $10.77 on 7/13.
The current price candle is yellow which indicates extreme bullish momentum behind price; yellow candles tend to indicate that price is becoming overbought and approaching a short-term top. With this push higher I've moved my stop-loss up to $11.71, just below the yesterdays yellow daily candle and into profit so the trade is guaranteed to pay out now if price reverses. For those with a lower entry price than mine and can afford some volatility and still remain in the green, stop-loss 2 is recommended as that was the the last higher low(HL) made in price before NIO made a new local higher high(HH). As price makes new higher highs on a chart I move my stop-loss to just below the most recent higher low as those are the last levels of support by buyers. If those higher lows are violated to the downside it likely means that sellers are in control of price going forward. Stair steps up: move your stop-loss to just below the last step price was on before it progressed to the next higher step.
My strategy with yellow candles is to move my stop loss to just below each yellow candle as price moves higher since price tends to continue to drift lower once the bottom of a yellow candle is breached on a pullback, reference previous yellow candles on the chart for historic moves after yellow candles form. For now I'm using yesterdays yellow candle as my stop-loss level since todays yellow candle is still live. Once the market closes today I will move my stop-loss to just below todays yellow candle.
The PPO is still showing positive short-term momentum with the green PPO line rising above the purple signal line. Both lines being above the 0 level indicate intermediate to long-term positive momentum.
The TDI indicator shows the green RSI line above the 60 level which indicates a short-term bullish trend. The green RSI line is trending between the 40-80 level which indicates an intermediate to long-term bullish trend. The RSI line is approaching the 80 level though which indicates short-term overbought conditions; price tends to reverse after the 80 level is tagged in the RSI. The RSI is also above the upper white Bollinger Band which also is a sign of extreme bullish momentum and tend to indicate a pullback in price is likely once the RSI moves back below the upper BBand. However, you generally want to stay long as long as the RSI remains above the upper band, and stay short when the RSI is below the lower BBand.
The TDI indicator is the one that is painting my price candles and giving me the yellow overbought conditions. Candles turn yellow when the green RSI line is above the upper Bband. You can find my TDI indicator here and add it to your own chart template:

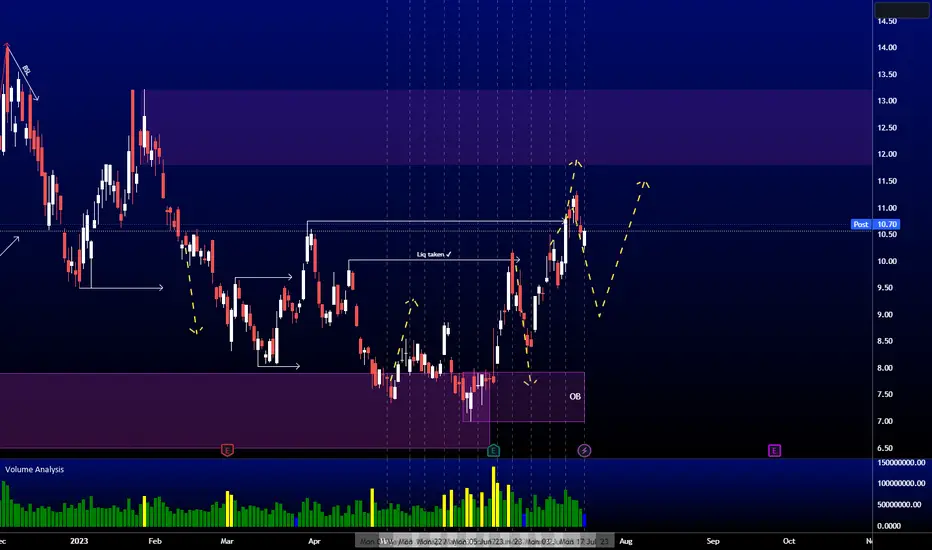
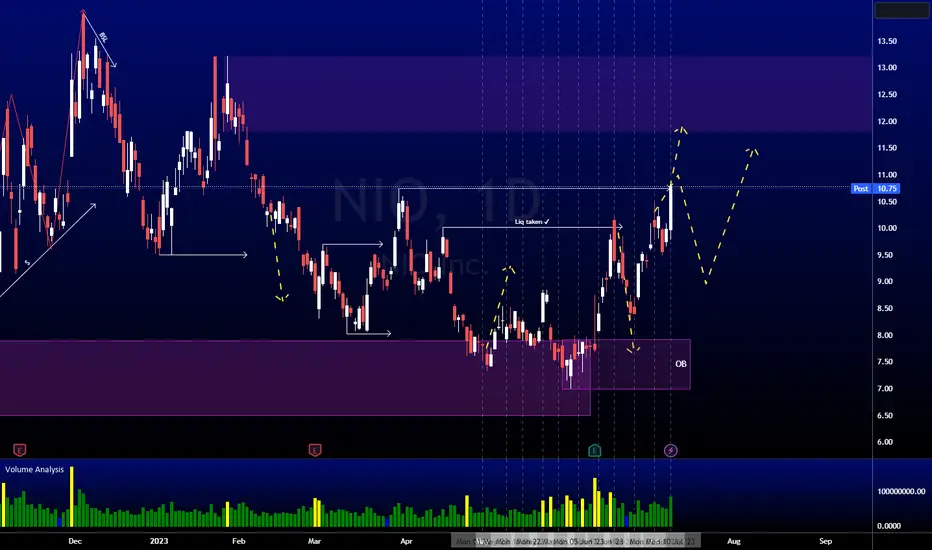
Update on NioIf everything i drew completes , we have a confirmation of a major reversal on Nio.
Which is normal, since i called this to happen...
Stay tuned for updates on Nio.
I still think there are higher levels to come.

NIONIO is creating inverse head and shoulders pattern
now breaking above neckline
confirmation above 10.8$
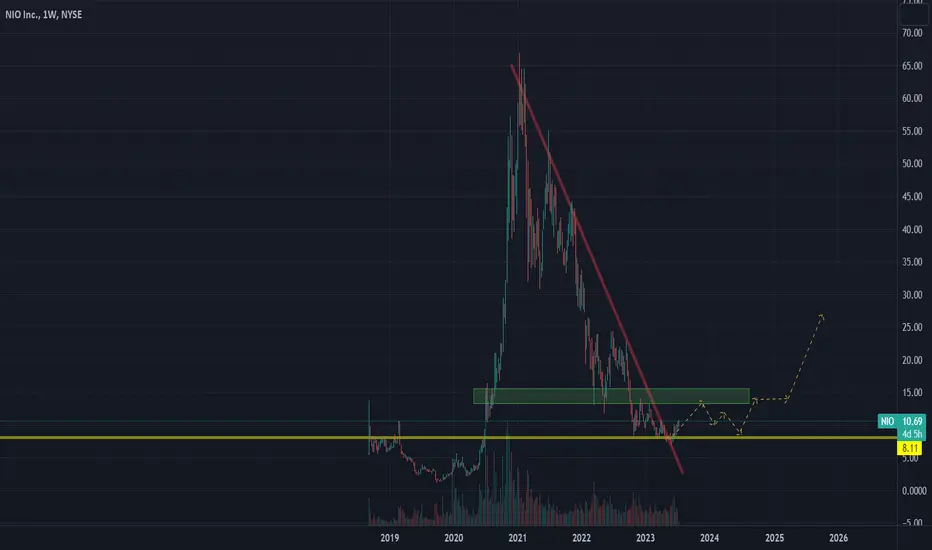
Nio change trendNio change trend heading towards new highs, the trend line breaks on both weekly & daily chart

$NIO long iswaI like NIO long after a re-test to this trendline. Ideally for a target at 15 for a swing with 2 weeks time. Any idea I publish is usually 4 days plus of a hold.
NIO AnalysisPrice played out nicely as analyzed last week, giving us a 14.11% move to the upside. Price finally mitigated the final target for this uptrend. I will be expecting a bearish retracement from this bearish POI next. If price wants to go higher, I want to see price taking out the clean highs at 13.22 next.
NIO: LIKELY TO PUSH HIGHER AND RETEST $11.17 RESISTANCE NIO appears to have found a bottom and now moving upwards on both weekly and monthly timeframes. The 20 EMA is on path to crossover the 50 EMA this signals strength to me. Once Pass the weekly resistance $10.55 the next resistance will be the 200 EMA
$11.32 (TP 1)
$12.10 ( TP 2)

Stage 2 Breakout in NIONIO is basically a Chinese Tesla. They are an electric vehicle manufacturer with seven models in production and have so far delivered around 350,000 units.
I don’t typically like Chinese stocks, but this one looks poised for a breakout higher.
The chart above shows my stage analysis for NIO stock on a weekly chart covering the last four years. As you can see, NIO is setting up for a new potential Stage 2 rally.
The first breakout into a new Stage 2 uptrend is, without question, the best place you can buy a stock.
If you drill down to a daily chart, you will see that NIO finally broke through its 200-day SMA which has acted as resistance for the entire downtrend.
If NIO can hold above its 200-day moving average and breakout higher, this could be a near perfect entry on this growth stock.

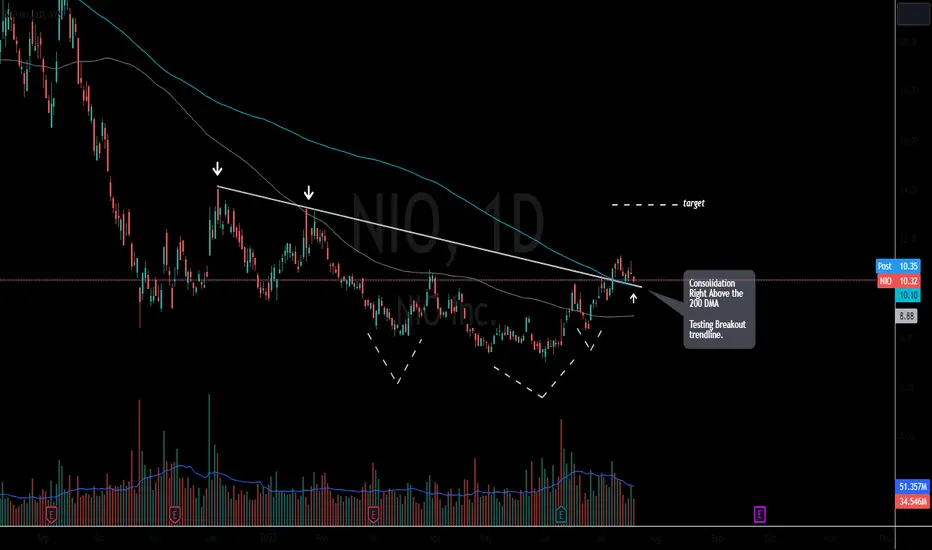
NIO Long?Nio has held up extremely well considering how hard of a selloff Tesla got hit with.
This Bullish pattern is retesting the breakout trendline and holding right above a key Moving Average.
An inverse Head & Shoulders pattern has broken out.
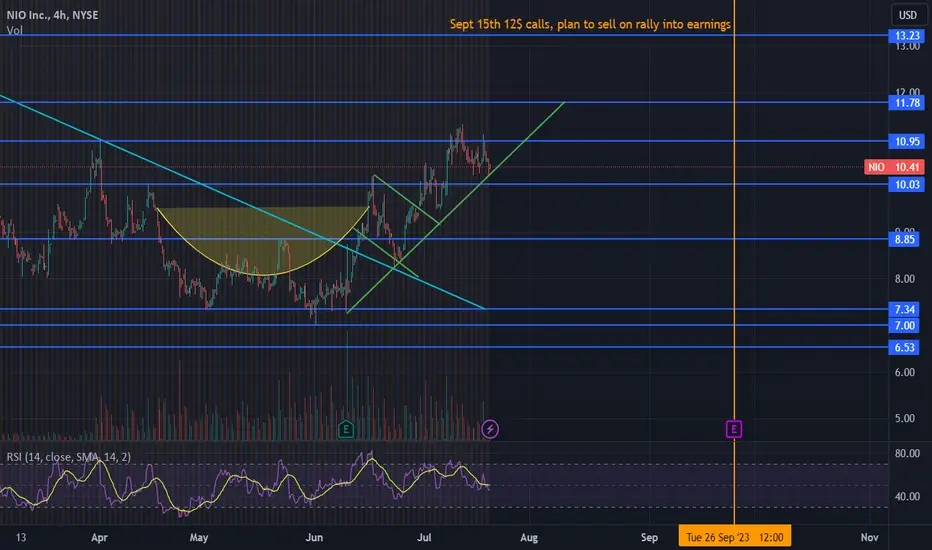
Nio continuation after pullbackThis is another nio setup, as you can see we have 3 touchpoints on the red line after Nio broke out of cup/flag setup. Great day to average back in in my eyes, eyeing sept calls 12$ strikes.
NIO AnalysisPrice playing out nicely as analyzed last week. Price filled the fair value gap and is now showing bullish sign. I'm expecting price to continue higher into the bearish POI at 13.22 next.
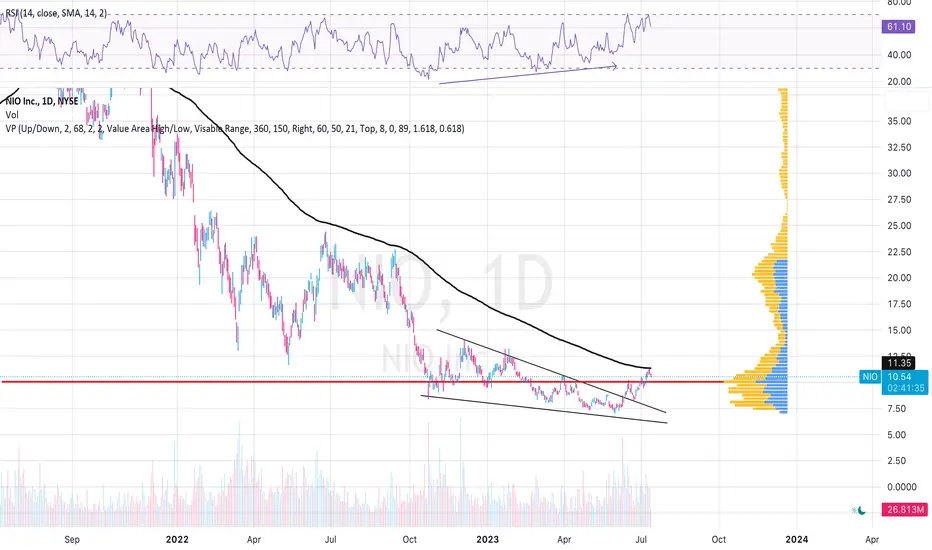
$NIO is turn to stage 2 ?NYSE:NIO is nearly turn to stage 2
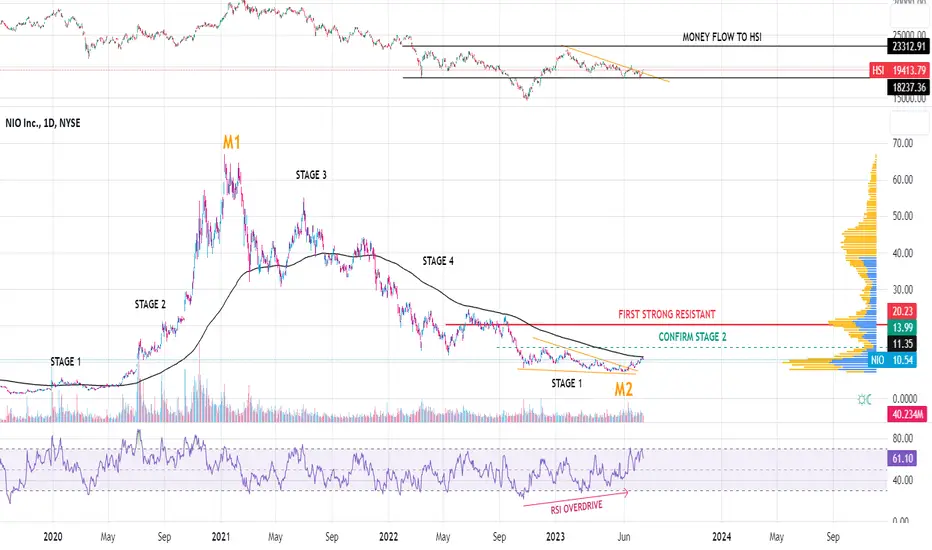
Technical Analysis Big picture:
1) NYSE:NIO is going on down trend for a year and 3 month ago just have low volatility and low volume
2) Make Sideway down and forming wedge shape with RSI overdrive up. Possibility highly to make U-turn
3) HSI index make pattern H&S. If complete price break upper resistant it's time of chinese stock rally
4) Now it has 2 resistant to confirm stage 2 is breaking EMA200 and Breaking base of wedge shape to confirm
Technical Analysis Small picture:
- NYSE:NIO break the wedge and make lower high forming picture Cup and Handle
Hope NYSE:NIO get well soon
Good Luck
NIO test to change trendNIO breakout of POC and test the ema200
if it break ema200 is a good sign to test new resistant at 20$
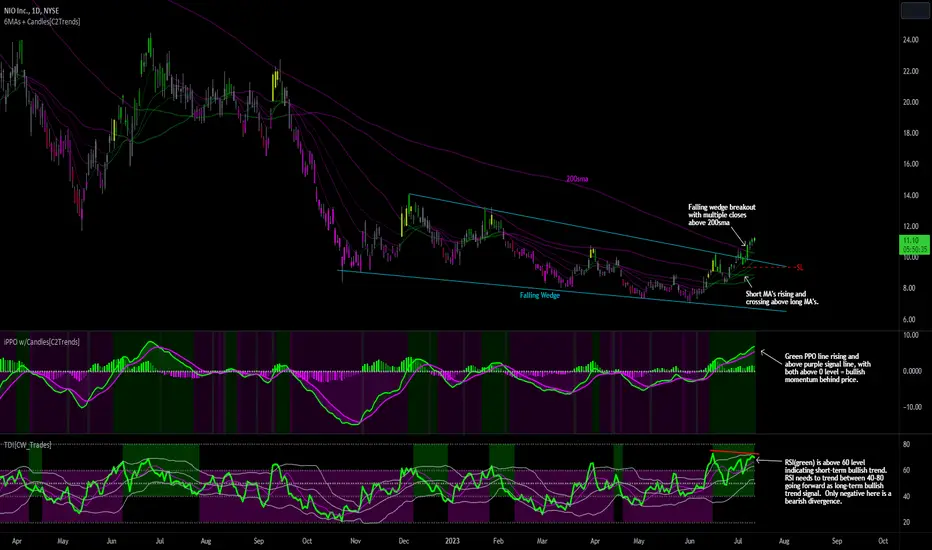
NIO Wedge Breakout + 200sma BeatNIO has been benefiting from the recent rise in EV stocks with price breaking up and out of a falling wedge pattern while simultaneously crossing up through the 200sma with multiple closes above it. The last time NIO closed above the 200sma prior to this recent move higher was back in November of 2021.
Looking at the moving averages(8,21,34,50,100,200) we can see that the shorter averages are rising and crossing up and above the longer averages indicating a short-term bullish trend in price. The 100ma is leveling out, the 200ma is still declining. We want to see price continue to rise going forward and for the two longest MA's to turn up to strengthen the bull case in NIO.
The PPO indicator show the green PPO line rising and trending above a rising purple signal line which indicates short-term bullish momentum in price. Both lines trending above the 0 level indicates an intermediate to long-term bullish momentum in price.
The TDI indicator shows the green RSI line trending above the 60 level which indicates a short-term bullish trend in price. The RSI line is also above its purple signal line and in the upper half of the Bollinger Bands indicating a bullish trend. Going forward we want to see the green RSI line continue to trend between the 40-60 levels as a sign of an intermediate to long-term bullish trend. The only negative here is the RSI line putting in a lower high compared to price which is a bearish divergence and could lead to a short-term pullback.
Assuming that the stock market and EV sector specifically continue to hold it together, NIO should benefit.
Buy price for me was $10.77.
Stop loss for me is currently at $9.37.
No upper price target for now, will continue to raise my stop-loss as price sets higher lows on an anticipated continued move higher.
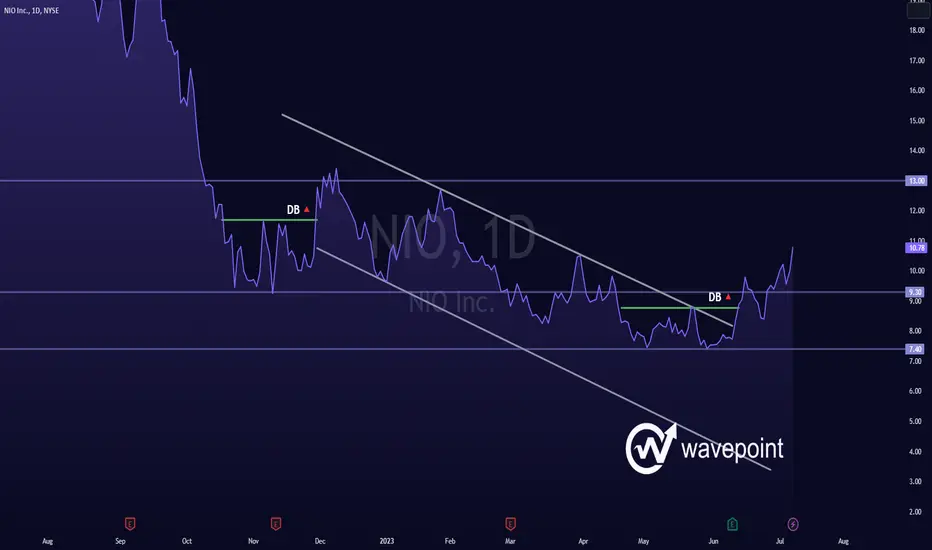
NIO - Falling Trend Channel [MID -TERM]🔹Breakout the ceiling of falling trend channel in the medium long term.
🔹Breakout resistance at 8.79 in double bottom formation.
🔹Supports at 9.3 and resistance at 13.
🔹Short-term momentum is positive with RSI above 70.
🔹Technically POSITIVE for the medium long term.
Chart Pattern;
🔹DT - Double Top | BEARISH | 🔴
🔹DB - Double Bottom | BULLISH | 🟢
🔹HNS - Head & Shoulder | BEARISH | 🔴
🔹REC - Rectangle | 🔵
🔹iHNS - inverse head & Shoulder | BULLISH | 🟢
Verify it first and believe later.
WavePoint ❤️
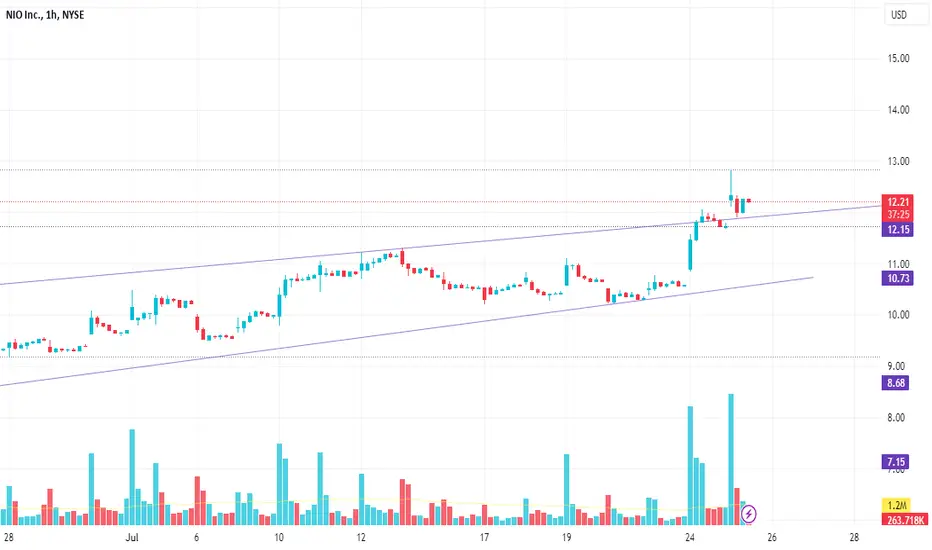
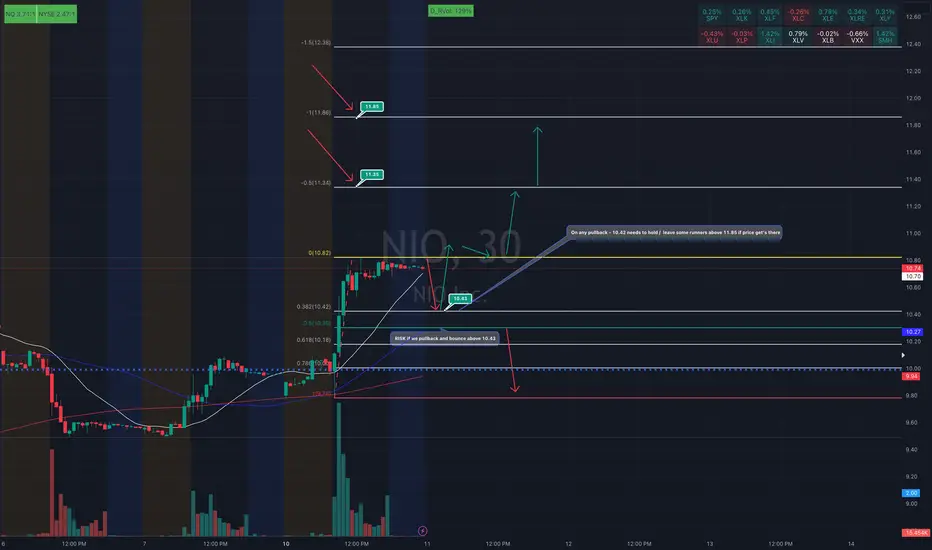
$NIO - Long ! Continuation Play! If we pullback and bounce above 10.43
Will risk 10.30 Area
leave some runners above 11.85 if price get's there
Buying Any Break above Hod if it rips above 10.82
On Retest bounce!
NIO AnalysisPrice played out nicely as analyzed last week, giving us a 7.93% rally, meeting the bullish target. Right now, price could make a bearish retracement, or continue higher following the strong bullish momentum into the bearish POI at 13.22 next.
NIO BROKE the downtrendgreat,
so no we just need to accumulate and wait. Not so soon for an uptrend.
$12-$13 has a huge resistance gap.
if we can break that, up up and away.
currently looking and buying more as it goes down
Culminating Weekly Divergence! NIO1. Weekly bullish divergence
2. Trying to break the downward channel. (trading near resistance line)
3. WT_LB indicates trading at oversold band
4. MA is not yet confirmed and I am going to wait until I see a change to green line (potentially will happen at earnings release date)
5. Both gaps were filled based on previous analysis.
There are risks. Do your own research. it is just my thoughts.
