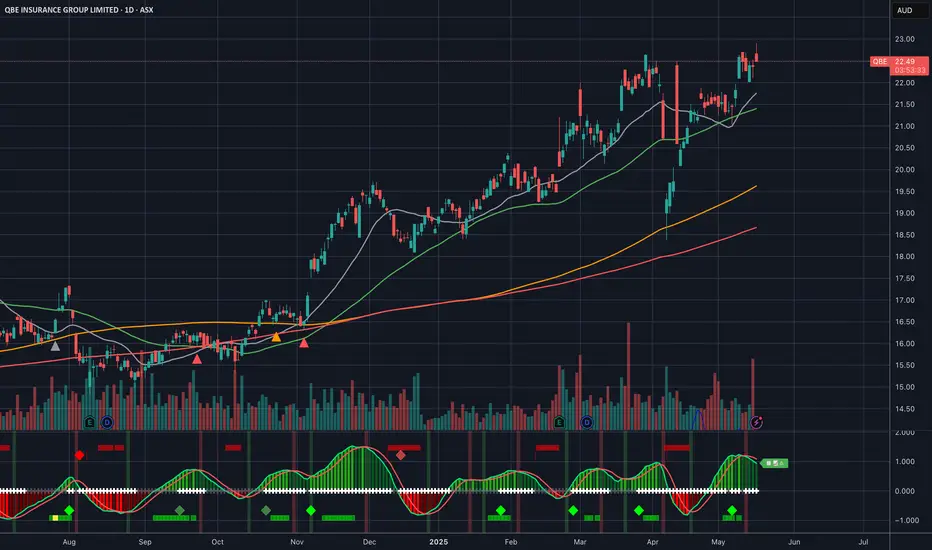
Trade Idea: QBE.AX – Breakout Swing SetupEntry Trigger:
🔹 Buy stop @ AUD 22.71 — breakout above recent highs with volume confirmation.
Thesis:
QBE has built a multi-week consolidation just under the key resistance level of 22.70–22.75. A breakout above this zone could trigger a bullish continuation, supported by improving capital metrics,
Next report date
—
Report period
—
EPS estimate
—
Revenue estimate
—
1.04 EUR
1.61 B EUR
20.68 B EUR
1.51 B
About QBE INSURANCE GROUP LIMITED
Sector
Industry
CEO
David Andrew Horton
Website
Headquarters
Sydney
Founded
1886
ISIN
AU000000QBE9
FIGI
BBG00FGWGGW0
QBE Insurance Group Ltd. engages in providing underwriting general insurance and reinsurance risks. It operates through the following geographical segments: North America, International, Australia Pacific, and Corporate and Other. The North America segment writes general insurance, re7insurance, and crop business in the United States. The International segment offers general insurance business in the United Kingdom, Europ, and Canada. The Australia Pacific segment underwrites general insurance risks throughout Australia, New Zealand, and the Pacific region. The Corporate and Other segment is involved in non-operating holding companies that do not form part pf the group’s insurance operations. The company was founded in October 1888 is headquartered in Sydney, Australia.
Related stocks
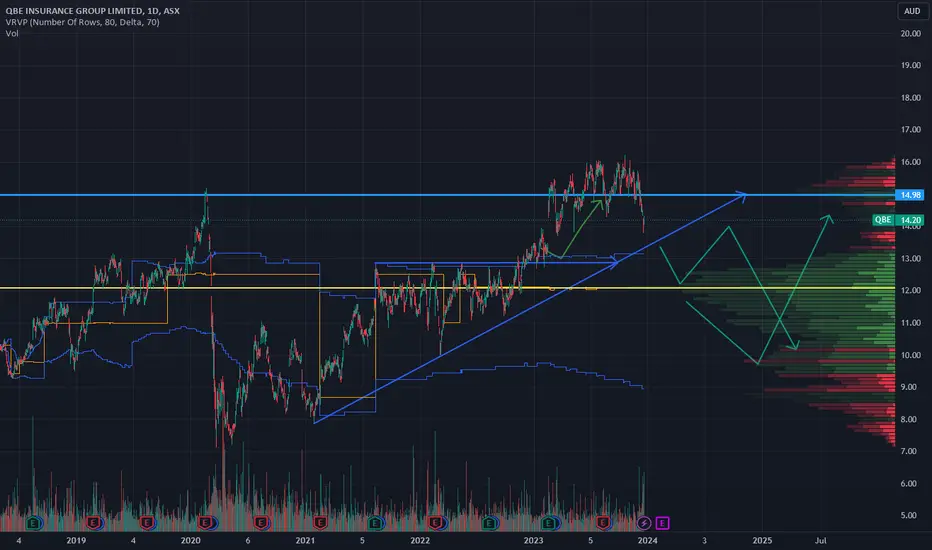
QBE falling to value areathe last run up to 16 seems to have failed and looking to see it fall back to 12.. I might try buy in around this level down to 10 looks pretty cheap.
QBE Adjusted Entry/ Stop PlacementStop violated before entry so adjusting trade positioning
If stop loss violated before entry/ break above last bullish candle then trade invalidated...

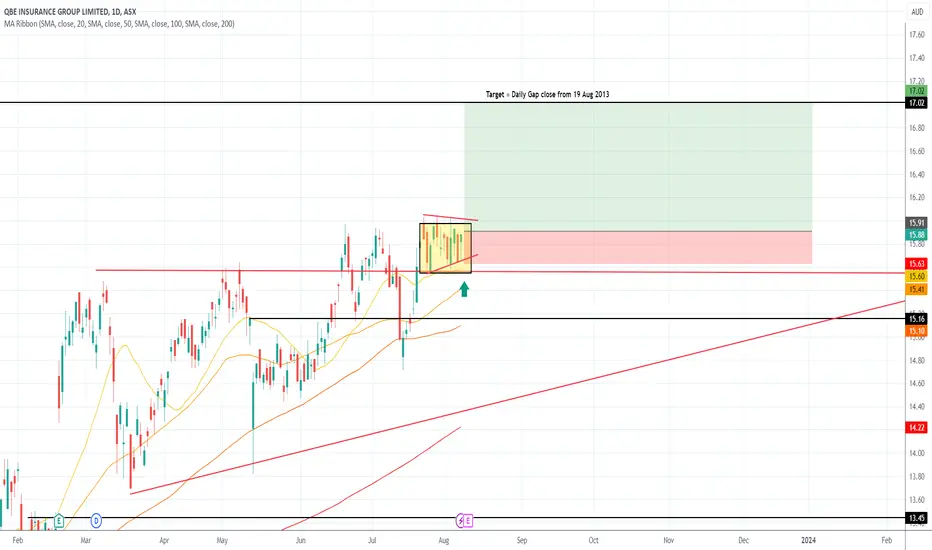
QBE ASX Stock possible daily breakout into 2013 gap level Full disclosure I own this stock and been a long term investor for years, as per previous posts
Noticed there may be a short term breakout unfolding now with a target that coincides with a 2013 gap close level
Not going to buy it personally as I have 3 lots in this already but thought I would point
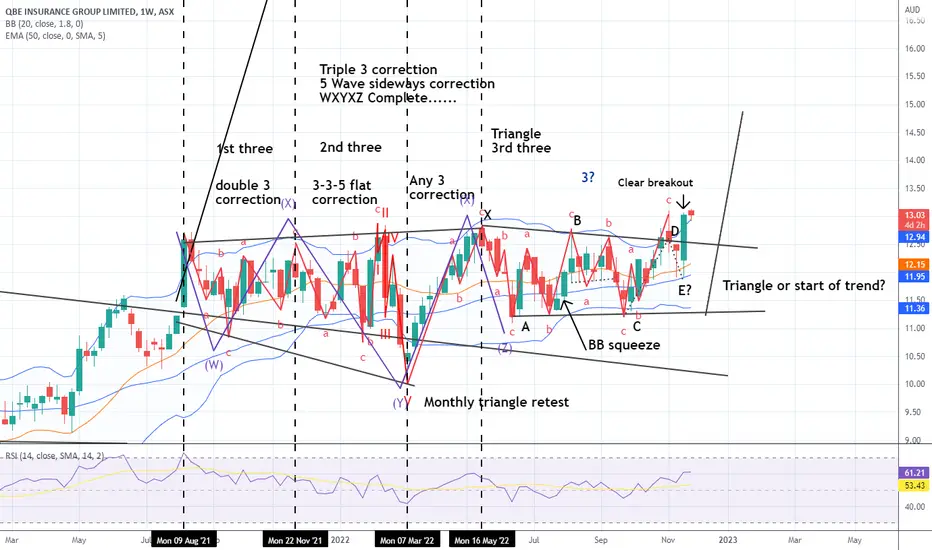
QBE Weekly Divergence possible bollinger band reversalQBE weekly divergence
Its important to maintain some level of impartiality when looking at charts... i.e. what's happening right now
I've held this as a long term position play but it looks like there are some crack appearing which may signal a few months of consolidation
Typically divergence lead
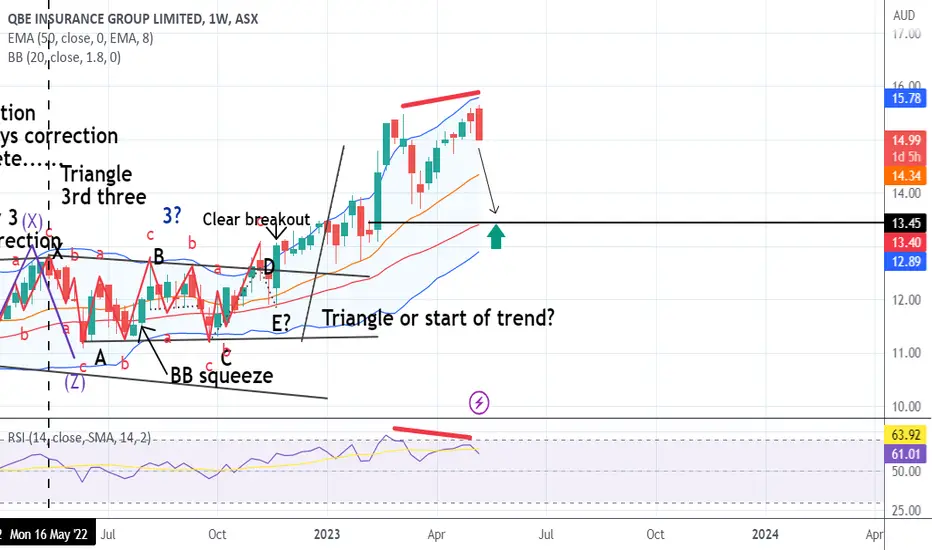
QBE Weekly breakoutQBE, no idea why this is breaking out now but it's a clear bullish breakout
Hopefully triggers a trend in the next 6months
QBE: Analysis: Two situationsOn QBE we have two situations. After the breakout with force the resistance line by a big green candle with a large green volume it's mean that we will have a big probability to have an uptrend.But, in other hand we will have a downtrend if only if we have the breakout with force the vwap indicator
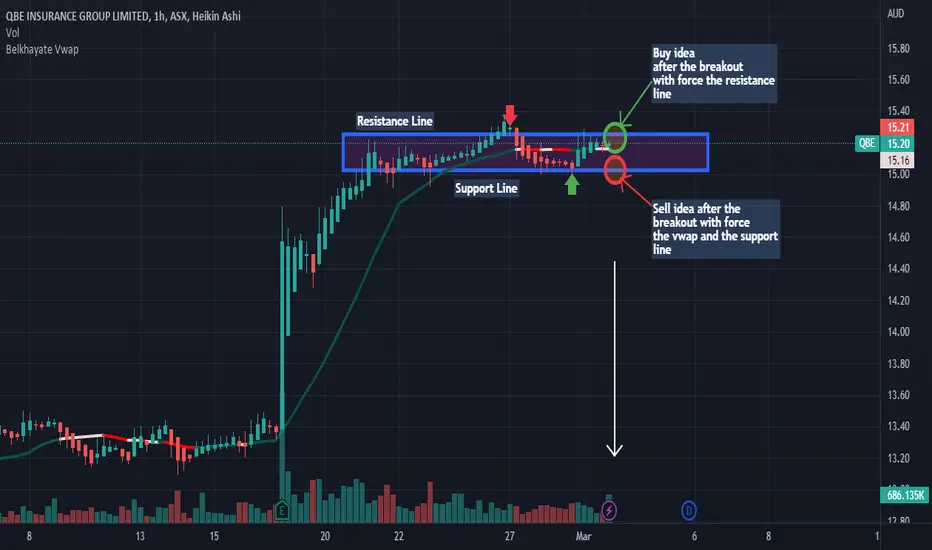
AnalysisAs you see on the chart we will have a big probability of an uptrend after the breakout with force the resistance line by a big green candle with a large green volume so at the next green candle we can buy. In other hand, we could have also a big probability of a downtrend if we have the breakout wi


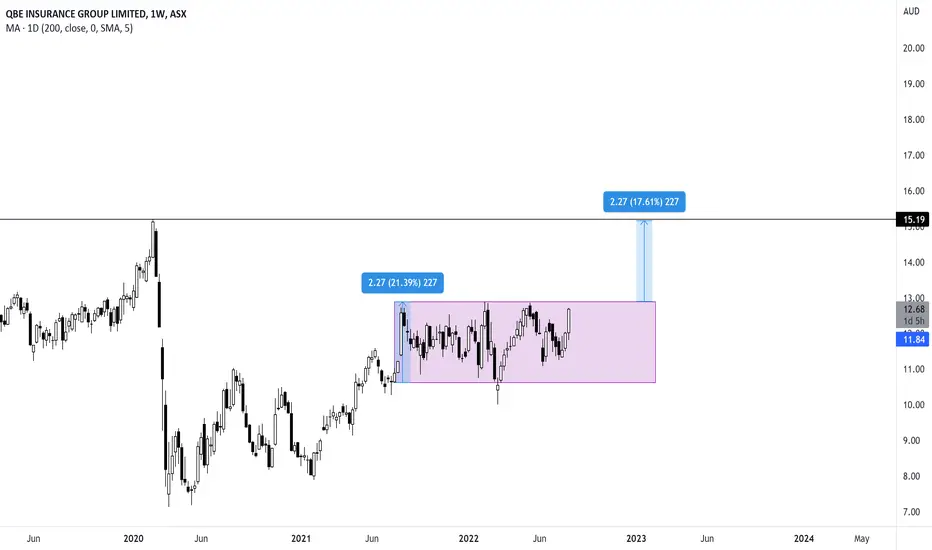
QBE Breakout to $15After a long period of consolidation, QBE looks set to breakout of this range.
Measured target $15 ( 2020 highs)
See all ideas
Summarizing what the indicators are suggesting.
Neutral
SellBuy
Strong sellStrong buy
Strong sellSellNeutralBuyStrong buy
Neutral
SellBuy
Strong sellStrong buy
Strong sellSellNeutralBuyStrong buy
Neutral
SellBuy
Strong sellStrong buy
Strong sellSellNeutralBuyStrong buy
An aggregate view of professional's ratings.
Neutral
SellBuy
Strong sellStrong buy
Strong sellSellNeutralBuyStrong buy
Neutral
SellBuy
Strong sellStrong buy
Strong sellSellNeutralBuyStrong buy
Neutral
SellBuy
Strong sellStrong buy
Strong sellSellNeutralBuyStrong buy
Displays a symbol's price movements over previous years to identify recurring trends.
AU3FN005548
QBE INS.GRP 20/36 FLR MTNYield to maturity
6.32%
Maturity date
Aug 25, 2036
QBGP4450973
QBE Insurance Group Limited 5.875% 17-JUN-2046Yield to maturity
5.83%
Maturity date
Jun 17, 2046
AU3CB032183
QBE INS.GRP 25/36 FLRMTNYield to maturity
5.58%
Maturity date
May 21, 2036
XS303594876
QBE INS.GRP 25/35 FLR MTNYield to maturity
5.42%
Maturity date
Oct 3, 2035
XS238428955
QBE INS.GRP 21/38 FLR MTNYield to maturity
3.40%
Maturity date
Sep 13, 2038
See all QBE bonds
Frequently Asked Questions
The current price of QBE is 13.00 EUR — it hasn't changed in the past 24 hours. Watch QBE INSURANCE GROUP LTD stock price performance more closely on the chart.
Depending on the exchange, the stock ticker may vary. For instance, on GETTEX exchange QBE INSURANCE GROUP LTD stocks are traded under the ticker QBE.
QBE stock has fallen by −1.52% compared to the previous week, the month change is a 4.84% rise, over the last year QBE INSURANCE GROUP LTD has showed a 31.98% increase.
We've gathered analysts' opinions on QBE INSURANCE GROUP LTD future price: according to them, QBE price has a max estimate of 14.68 EUR and a min estimate of 11.82 EUR. Watch QBE chart and read a more detailed QBE INSURANCE GROUP LTD stock forecast: see what analysts think of QBE INSURANCE GROUP LTD and suggest that you do with its stocks.
QBE stock is 0.78% volatile and has beta coefficient of 0.87. Track QBE INSURANCE GROUP LTD stock price on the chart and check out the list of the most volatile stocks — is QBE INSURANCE GROUP LTD there?
Today QBE INSURANCE GROUP LTD has the market capitalization of 19.34 B, it has decreased by −1.29% over the last week.
Yes, you can track QBE INSURANCE GROUP LTD financials in yearly and quarterly reports right on TradingView.
QBE INSURANCE GROUP LTD is going to release the next earnings report on Aug 8, 2025. Keep track of upcoming events with our Earnings Calendar.
QBE earnings for the last half-year are 0.61 EUR per share, whereas the estimation was 0.56 EUR, resulting in a 8.89% surprise. The estimated earnings for the next half-year are 0.47 EUR per share. See more details about QBE INSURANCE GROUP LTD earnings.
QBE INSURANCE GROUP LTD revenue for the last half-year amounts to 8.98 B EUR, despite the estimated figure of 8.64 B EUR. In the next half-year revenue is expected to reach 7.63 B EUR.
QBE net income for the last half-year is 883.30 M EUR, while the previous report showed 758.36 M EUR of net income which accounts for 16.47% change. Track more QBE INSURANCE GROUP LTD financial stats to get the full picture.
QBE INSURANCE GROUP LTD dividend yield was 4.53% in 2024, and payout ratio reached 49.82%. The year before the numbers were 4.19% and 46.99% correspondingly. See high-dividend stocks and find more opportunities for your portfolio.
As of Aug 7, 2025, the company has 13.48 K employees. See our rating of the largest employees — is QBE INSURANCE GROUP LTD on this list?
Like other stocks, QBE shares are traded on stock exchanges, e.g. Nasdaq, Nyse, Euronext, and the easiest way to buy them is through an online stock broker. To do this, you need to open an account and follow a broker's procedures, then start trading. You can trade QBE INSURANCE GROUP LTD stock right from TradingView charts — choose your broker and connect to your account.
Investing in stocks requires a comprehensive research: you should carefully study all the available data, e.g. company's financials, related news, and its technical analysis. So QBE INSURANCE GROUP LTD technincal analysis shows the strong buy rating today, and its 1 week rating is buy. Since market conditions are prone to changes, it's worth looking a bit further into the future — according to the 1 month rating QBE INSURANCE GROUP LTD stock shows the buy signal. See more of QBE INSURANCE GROUP LTD technicals for a more comprehensive analysis.
If you're still not sure, try looking for inspiration in our curated watchlists.
If you're still not sure, try looking for inspiration in our curated watchlists.