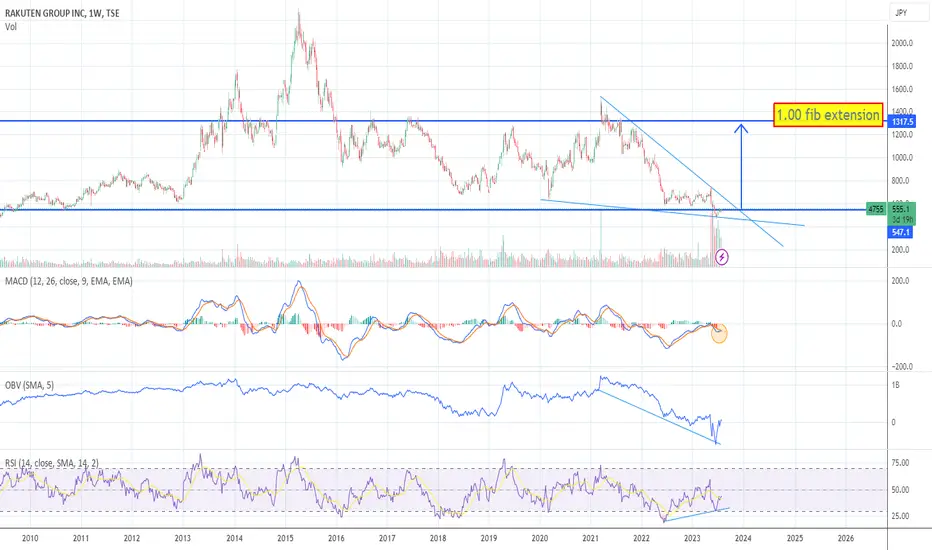
Crazy Rakuten bullish ideaWhat is Rakuten?
Rakuten Group, Inc. provides services in e-commerce, fintech, digital content, and communications to various users in Japan and internationally. The company operates through three segments: Internet Services, FinTech, and Mobile.
Rakuten has 4 bullish factors even though it has
Next report date
—
Report period
—
EPS estimate
—
Revenue estimate
—
−0.55 EUR
−997.98 M EUR
14.00 B EUR
1.43 B
About RAKUTEN GROUP INC
Sector
Industry
CEO
Hiroshi Mikitani
Website
Headquarters
Tokyo
Founded
2006
ISIN
JP3967200001
FIGI
BBG000CNXSH9
Rakuten Group, Inc. engages in the business of Internet services. It operates through the following segments: Internet Services, FinTech, and Mobile. The Internet Services segment manages e-commerce (EC), online cash-back, travel booking, and portal and digital content sites. The FinTech segment provides services over the Internet related to banking and securities, credit cards, life insurance, and electronic money. The Mobile segment manages messaging and communication services and sale of mobile devices. The company was founded by Hiroshi Mikitani on February 7, 1997 and is headquartered in Tokyo, Japan.
Related stocks

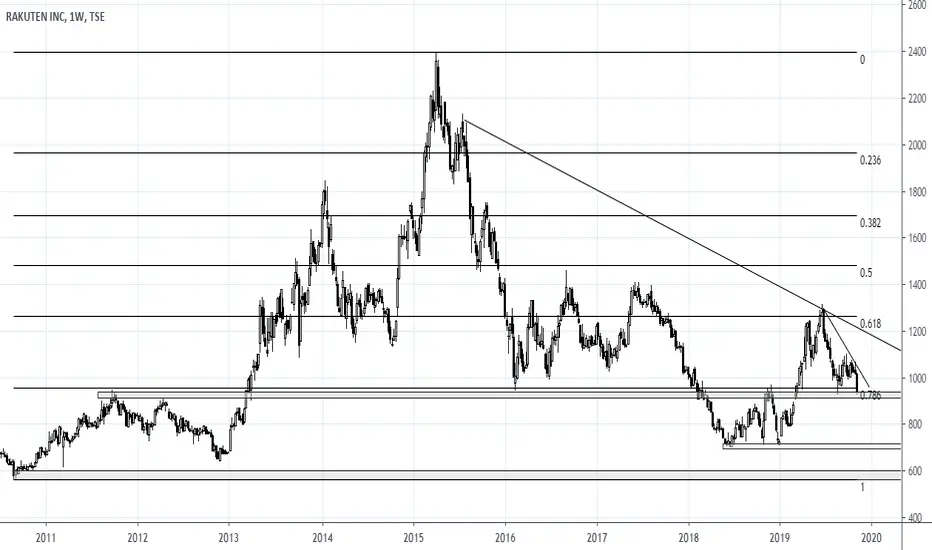
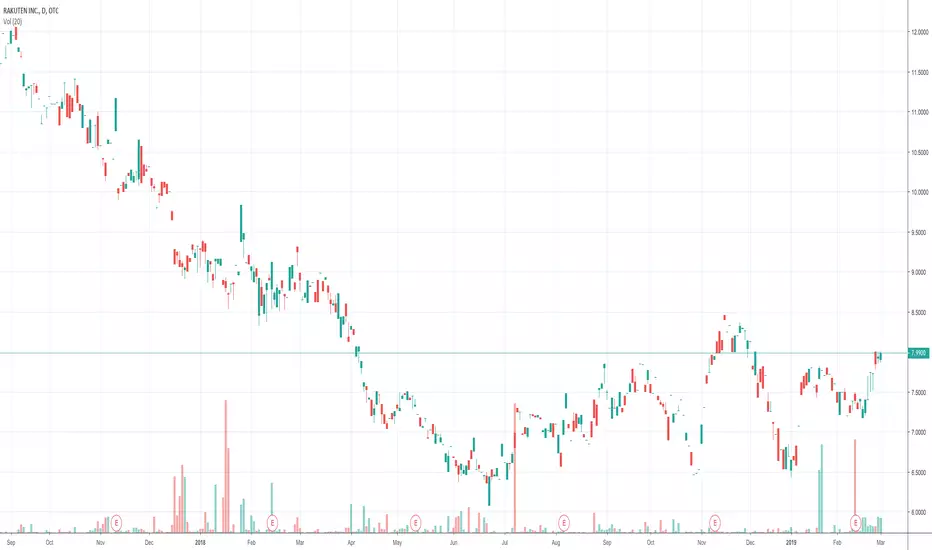
Major Areas of Supportdaily
RSI not yet oversold for a bounce play
weekly
closed just below 0.786 fibonacci level
currently residing just above the area pattern support
the candlestick close of next week will determine where the direction of this stock will go
RKUNY Breakout?Rakuten just announced they are going to accept crypto. Falling wedge pattern detected.
I want to know if anyone else sees a breakout in the near future and a good buy point?
Recently added to robinhood...
Join Robinhood trade for free use my code chrisk1448 for a free stock
share.robinhood.com

RAKUTEN - JPY amazon type co. -CryptoRakuten - JPY amazon type company, accepted crypto when this thing was at $7.75 USD....It has broken out now and shoudl head to $10.50 USD easily on the reverse HS, IMO. Other things going for it is that JPY is a crypto friendly country (by far) and now people can pay in crypto on this site. More

RKUNF LongLargest shareholder in LYFT. Post IPO the stock could see a 30%-40% pop as their $300m investment reaches over $3.2B. Company also expanding in the US Logistics and distribution business.
See all ideas
Summarizing what the indicators are suggesting.
Neutral
SellBuy
Strong sellStrong buy
Strong sellSellNeutralBuyStrong buy
Neutral
SellBuy
Strong sellStrong buy
Strong sellSellNeutralBuyStrong buy
Neutral
SellBuy
Strong sellStrong buy
Strong sellSellNeutralBuyStrong buy
An aggregate view of professional's ratings.
Neutral
SellBuy
Strong sellStrong buy
Strong sellSellNeutralBuyStrong buy
Neutral
SellBuy
Strong sellStrong buy
Strong sellSellNeutralBuyStrong buy
Neutral
SellBuy
Strong sellStrong buy
Strong sellSellNeutralBuyStrong buy
Displays a symbol's price movements over previous years to identify recurring trends.
RKUNF5785984
Rakuten Group, Inc. 9.75% 15-APR-2029Yield to maturity
9.57%
Maturity date
Apr 15, 2029
RKUNF5744796
Rakuten Group, Inc. 11.25% 15-FEB-2027Yield to maturity
8.59%
Maturity date
Feb 15, 2027
USJ64264AK0
RAKUTEN GRP 24/29 REGSYield to maturity
6.77%
Maturity date
Apr 15, 2029
USJ64264AG9
RAKUTEN GRP 24/27 REGSYield to maturity
5.70%
Maturity date
Feb 15, 2027
RKUNF5955470
Rakuten Group, Inc. 8.125% PERPYield to maturity
—
Maturity date
—
RKUNF5167786
Rakuten Group, Inc. 5.125% PERPYield to maturity
—
Maturity date
—
XS233288977
RAKUTEN GRP 21/UND. REGSYield to maturity
—
Maturity date
—
RKUNF5167788
Rakuten Group, Inc. 6.25% PERPYield to maturity
—
Maturity date
—
See all RAK bonds
Curated watchlists where RAK is featured.

Frequently Asked Questions
The current price of RAK is 4.54 EUR — it has decreased by −0.34% in the past 24 hours. Watch RAKUTEN GROUP, INC. stock price performance more closely on the chart.
Depending on the exchange, the stock ticker may vary. For instance, on GETTEX exchange RAKUTEN GROUP, INC. stocks are traded under the ticker RAK.
RAK stock has fallen by −1.96% compared to the previous week, the month change is a −7.07% fall, over the last year RAKUTEN GROUP, INC. has showed a −11.32% decrease.
We've gathered analysts' opinions on RAKUTEN GROUP, INC. future price: according to them, RAK price has a max estimate of 7.44 EUR and a min estimate of 3.01 EUR. Watch RAK chart and read a more detailed RAKUTEN GROUP, INC. stock forecast: see what analysts think of RAKUTEN GROUP, INC. and suggest that you do with its stocks.
RAK stock is 2.28% volatile and has beta coefficient of 1.07. Track RAKUTEN GROUP, INC. stock price on the chart and check out the list of the most volatile stocks — is RAKUTEN GROUP, INC. there?
Today RAKUTEN GROUP, INC. has the market capitalization of 9.83 B, it has increased by 0.07% over the last week.
Yes, you can track RAKUTEN GROUP, INC. financials in yearly and quarterly reports right on TradingView.
RAKUTEN GROUP, INC. is going to release the next earnings report on Aug 7, 2025. Keep track of upcoming events with our Earnings Calendar.
RAK earnings for the last quarter are −0.21 EUR per share, whereas the estimation was −0.09 EUR resulting in a −146.31% surprise. The estimated earnings for the next quarter are 0.03 EUR per share. See more details about RAKUTEN GROUP, INC. earnings.
RAKUTEN GROUP, INC. revenue for the last quarter amounts to 3.47 B EUR, despite the estimated figure of 3.49 B EUR. In the next quarter, revenue is expected to reach 3.48 B EUR.
RAK net income for the last quarter is −452.70 M EUR, while the quarter before that showed −74.24 M EUR of net income which accounts for −509.79% change. Track more RAKUTEN GROUP, INC. financial stats to get the full picture.
As of Jul 7, 2025, the company has 29.33 K employees. See our rating of the largest employees — is RAKUTEN GROUP, INC. on this list?
EBITDA measures a company's operating performance, its growth signifies an improvement in the efficiency of a company. RAKUTEN GROUP, INC. EBITDA is 2.05 B EUR, and current EBITDA margin is 13.46%. See more stats in RAKUTEN GROUP, INC. financial statements.
Like other stocks, RAK shares are traded on stock exchanges, e.g. Nasdaq, Nyse, Euronext, and the easiest way to buy them is through an online stock broker. To do this, you need to open an account and follow a broker's procedures, then start trading. You can trade RAKUTEN GROUP, INC. stock right from TradingView charts — choose your broker and connect to your account.
Investing in stocks requires a comprehensive research: you should carefully study all the available data, e.g. company's financials, related news, and its technical analysis. So RAKUTEN GROUP, INC. technincal analysis shows the sell today, and its 1 week rating is strong sell. Since market conditions are prone to changes, it's worth looking a bit further into the future — according to the 1 month rating RAKUTEN GROUP, INC. stock shows the sell signal. See more of RAKUTEN GROUP, INC. technicals for a more comprehensive analysis.
If you're still not sure, try looking for inspiration in our curated watchlists.
If you're still not sure, try looking for inspiration in our curated watchlists.