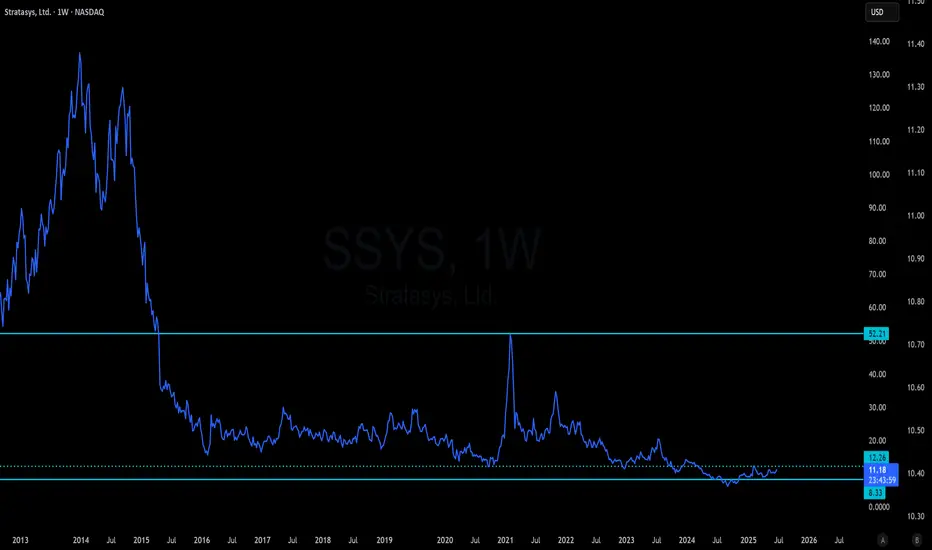
SSYS to 50A victim of the 2013 bubble has finally bottomed out and remains a leader in the 3D printing industry. As robotics and advanced materials advance, 3D printing will become the standard in manufacturing.
A very beaten down stock for almost 10 years can go back to 50 and possibly higher. Has governmen
Next report date
—
Report period
—
EPS estimate
—
Revenue estimate
—
−1.39 EUR
−116.19 M EUR
554.23 M EUR
52.73 M
About Stratasys, Ltd.
Sector
Industry
CEO
Yoav Zeif
Website
Headquarters
Eden Prairie
Founded
1998
ISIN
IL0011267213
FIGI
BBG003P9Y6L2
Stratasys Ltd. engages in the development of industrial grade additive solutions. It offers three-dimensional (3D) printer and parts, materials, and software. The company was founded on March 3, 1998 and is headquartered in Eden Prairie, MN.
Related stocks
SSYS: Bottom confirmed and successful backtest, what's next?SSYS: Bottom confirmed and successful backtest, what's next?
-Quasimodo pattern.
-ABCD pattern.
-Bottom confirmed and successful backtest with low supply volumes- good signals for reversals here.
-Demand zone support.
-Key level support.
-Fibo retracement at golden zone.
.
Let's go!

Are 3D Printing Stocks About To Make an Epic Comeback?Ladies and gentlemen, traders of all ages, today I am sharing an idea about 3D printing stocks trading at remarkably low levels considering the following points:
1. They've been through several "hype cycles" already.
2. They've been improving the tech for 10+ years now.
3. But most importantly, gen

Intuition pick SSYS to $15On Sunday I was getting some "s"s in my intuition and kind of picked up on SSYS. I checked with dowsing if this was accurate and got a "yes". I didn't see when earnings were, but I think they just had them as I just spotted it was up 8% today.
In my intuition I got the number 18, which normally I wo

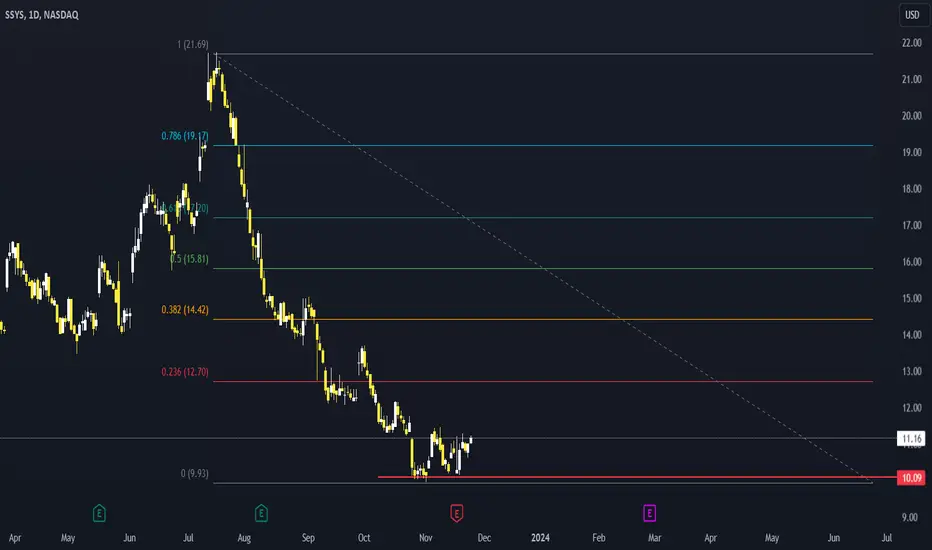
SSYS Price Action AnalysisSSYS is an industrial 3D printing company.
Price action is suggesting we have formed a bottom around 10.
If we have a nice close bullish close, above 11.37 in the next couple of day, then the bottom should be in for now.
Stop can be placed below 10.55 and first target is 23.6% Fib at 12.70 (there
SSYS Monthly bullish divergence on the RSIHere we have a log scale monthly chart of SSYS. The 1.618 level at about 14,30$ will be a key level. If price can break above that and backtest it as support, there is a very high probability we see a large move to the upside. Just look at this bullish divergence from the low of January 2016, monthl

Entering major bullish support level Looking at the monthly chart for SSYS I noticed that every major pump started on the level we are currently at.
I'm expecting a 150% move back up to new local highs above 60 in the next year.

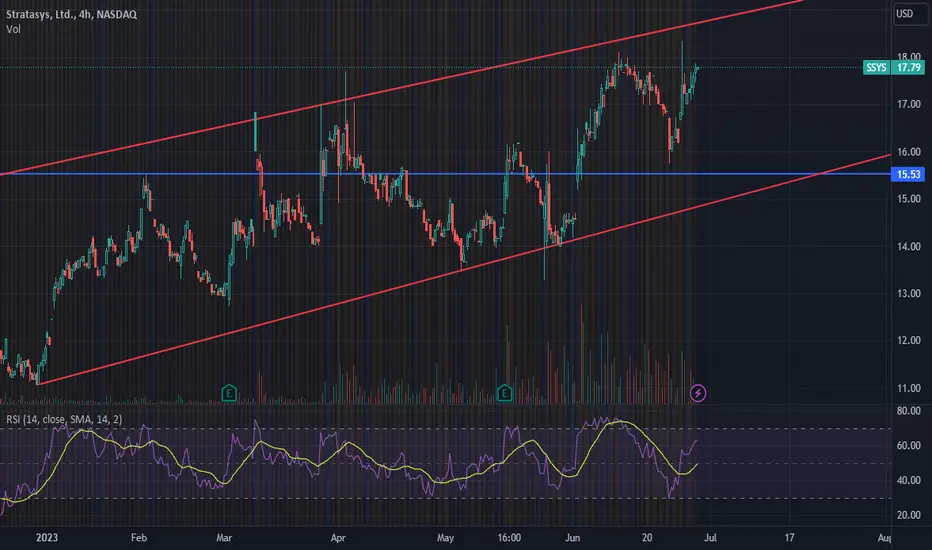
SSYS ascending channel looking for an entryI am looking for an entry for a call setup for SSYS, if it manages to come back to the bottom range of the channel that would be a decent entry point. I would then look 45-60 days out for a strike price as designated by the channel along with horizontal supports.
Inverted head and shoulder.Seems that an inverted head and shoulders has formed.
Fundamental analysts also have a buy rating on this.
But above all, read the news - on the right side when displaying the watch list, just below the price.

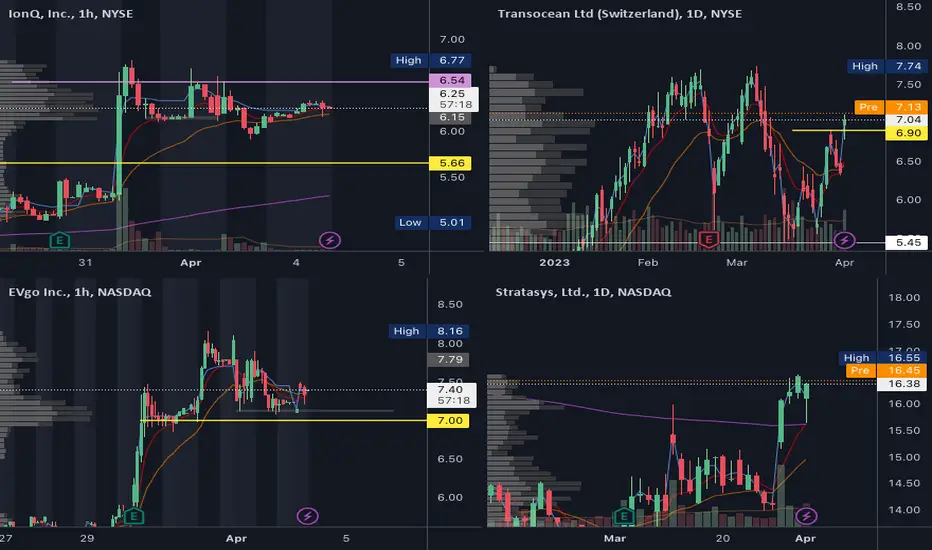
Watchlist 2023-04-04 $SPY $RIG $SYSS $EVGO $IONQ SPY - the grind higher continues as SPY approaches the all-important Jan 30 pivot of 418. Over the last week SPY has either held the PM support or PD high. Looking for either of those levels to hold to potentially expect higher prices later on as we haven't needed the $ADD pinned near +\-2000 and $V
See all ideas
Summarizing what the indicators are suggesting.
Neutral
SellBuy
Strong sellStrong buy
Strong sellSellNeutralBuyStrong buy
Neutral
SellBuy
Strong sellStrong buy
Strong sellSellNeutralBuyStrong buy
Neutral
SellBuy
Strong sellStrong buy
Strong sellSellNeutralBuyStrong buy
An aggregate view of professional's ratings.
Neutral
SellBuy
Strong sellStrong buy
Strong sellSellNeutralBuyStrong buy
Neutral
SellBuy
Strong sellStrong buy
Strong sellSellNeutralBuyStrong buy
Neutral
SellBuy
Strong sellStrong buy
Strong sellSellNeutralBuyStrong buy
Displays a symbol's price movements over previous years to identify recurring trends.
Frequently Asked Questions
The current price of SCY is 9.80 EUR — it has decreased by −1.80% in the past 24 hours. Watch STRATASYS LTD stock price performance more closely on the chart.
Depending on the exchange, the stock ticker may vary. For instance, on GETTEX exchange STRATASYS LTD stocks are traded under the ticker SCY.
SCY stock has risen by 3.22% compared to the previous week, the month change is a 7.86% rise, over the last year STRATASYS LTD has showed a 22.38% increase.
We've gathered analysts' opinions on STRATASYS LTD future price: according to them, SCY price has a max estimate of 15.12 EUR and a min estimate of 12.45 EUR. Watch SCY chart and read a more detailed STRATASYS LTD stock forecast: see what analysts think of STRATASYS LTD and suggest that you do with its stocks.
SCY stock is 1.84% volatile and has beta coefficient of 1.12. Track STRATASYS LTD stock price on the chart and check out the list of the most volatile stocks — is STRATASYS LTD there?
Today STRATASYS LTD has the market capitalization of 836.35 M, it has decreased by −0.37% over the last week.
Yes, you can track STRATASYS LTD financials in yearly and quarterly reports right on TradingView.
STRATASYS LTD is going to release the next earnings report on Aug 6, 2025. Keep track of upcoming events with our Earnings Calendar.
SCY earnings for the last quarter are 0.04 EUR per share, whereas the estimation was 0.01 EUR resulting in a 166.67% surprise. The estimated earnings for the next quarter are 0.02 EUR per share. See more details about STRATASYS LTD earnings.
STRATASYS LTD revenue for the last quarter amounts to 125.75 M EUR, despite the estimated figure of 123.96 M EUR. In the next quarter, revenue is expected to reach 116.43 M EUR.
SCY net income for the last quarter is −12.07 M EUR, while the quarter before that showed −40.52 M EUR of net income which accounts for 70.22% change. Track more STRATASYS LTD financial stats to get the full picture.
No, SCY doesn't pay any dividends to its shareholders. But don't worry, we've prepared a list of high-dividend stocks for you.
As of Jul 6, 2025, the company has 1.78 K employees. See our rating of the largest employees — is STRATASYS LTD on this list?
Like other stocks, SCY shares are traded on stock exchanges, e.g. Nasdaq, Nyse, Euronext, and the easiest way to buy them is through an online stock broker. To do this, you need to open an account and follow a broker's procedures, then start trading. You can trade STRATASYS LTD stock right from TradingView charts — choose your broker and connect to your account.
Investing in stocks requires a comprehensive research: you should carefully study all the available data, e.g. company's financials, related news, and its technical analysis. So STRATASYS LTD technincal analysis shows the buy rating today, and its 1 week rating is buy. Since market conditions are prone to changes, it's worth looking a bit further into the future — according to the 1 month rating STRATASYS LTD stock shows the neutral signal. See more of STRATASYS LTD technicals for a more comprehensive analysis.
If you're still not sure, try looking for inspiration in our curated watchlists.
If you're still not sure, try looking for inspiration in our curated watchlists.