Buzzi Unicem | Chart & Forecast SummaryKey Indicators On Trade Set Up In General
1. Push Set Up
2. Range Set up
3. Break & Retest Set Up
Notes On Session
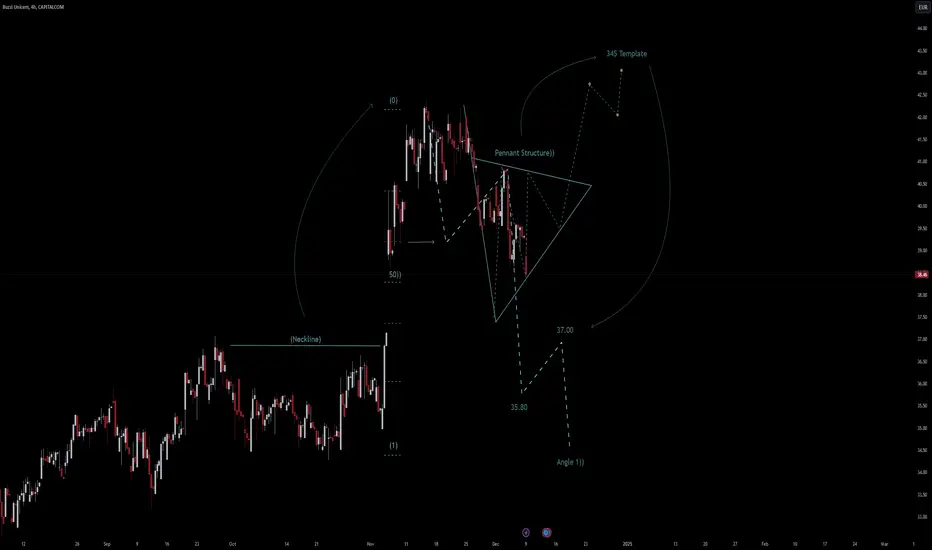
# Buzzi Unicem
- Double Formation
* Neckline At 36.50 EUR
* Retracement 1, 0.5 & 0 | Resistance Area At 42.25 EUR | Subdivision 1
- Triple Formation
* Pennant Structure | Short Continu
Next report date
—
Report period
—
EPS estimate
—
Revenue estimate
—
5.14 EUR
942.32 M EUR
4.31 B EUR
74.14 M
About BUZZI
Sector
Industry
CEO
Pietro Buzzi
Website
Headquarters
Casale Monferrato
Founded
1907
ISIN
IT0001347308
FIGI
BBG000C2K4Q2
Buzzi SpA engages in the production and sale of cement, ready-mix concrete, and natural aggregates. It operates through the following geographical segments: Italy, United States of America, Central Europe, Eastern Europe, and Brazil. The Central Europe segment consists of Germany, Luxembourg, and the Netherlands. The Eastern Europe segment covers Poland, the Czech Republic, Slovakia, Ukraine, and Russia. The company was founded in 1907 and is headquartered in Casale Monferrato, Italy.
Related stocks
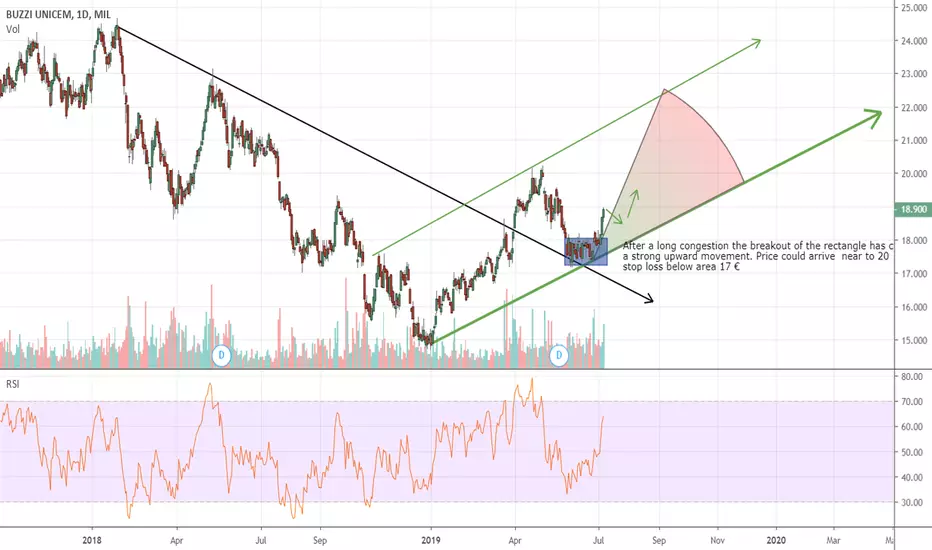
BUZZI UNICEM LONG TERM OPPORTUNITY Buzzi Unicem S.p.A. is an Italian multinational specialized in the production of cement, active in Europe, the United States and South America. In Italy it is the second largest operator in the country with a market share of 16%. It is listed on the FTSE MIB index of the Milan Stock Exchange.
A sec

See all ideas
Summarizing what the indicators are suggesting.
Neutral
SellBuy
Strong sellStrong buy
Strong sellSellNeutralBuyStrong buy
Neutral
SellBuy
Strong sellStrong buy
Strong sellSellNeutralBuyStrong buy
Neutral
SellBuy
Strong sellStrong buy
Strong sellSellNeutralBuyStrong buy
An aggregate view of professional's ratings.
Neutral
SellBuy
Strong sellStrong buy
Strong sellSellNeutralBuyStrong buy
Neutral
SellBuy
Strong sellStrong buy
Strong sellSellNeutralBuyStrong buy
Neutral
SellBuy
Strong sellStrong buy
Strong sellSellNeutralBuyStrong buy
Displays a symbol's price movements over previous years to identify recurring trends.
Frequently Asked Questions
The current price of UCM is 46.46 EUR — it has decreased by −1.16% in the past 24 hours. Watch BUZZI SPA stock price performance more closely on the chart.
Depending on the exchange, the stock ticker may vary. For instance, on GETTEX exchange BUZZI SPA stocks are traded under the ticker UCM.
UCM stock has fallen by −9.73% compared to the previous week, the month change is a 3.47% rise, over the last year BUZZI SPA has showed a 24.89% increase.
We've gathered analysts' opinions on BUZZI SPA future price: according to them, UCM price has a max estimate of 58.00 EUR and a min estimate of 26.00 EUR. Watch UCM chart and read a more detailed BUZZI SPA stock forecast: see what analysts think of BUZZI SPA and suggest that you do with its stocks.
UCM stock is 1.87% volatile and has beta coefficient of 0.75. Track BUZZI SPA stock price on the chart and check out the list of the most volatile stocks — is BUZZI SPA there?
Today BUZZI SPA has the market capitalization of 8.34 B, it has decreased by −10.39% over the last week.
Yes, you can track BUZZI SPA financials in yearly and quarterly reports right on TradingView.
BUZZI SPA is going to release the next earnings report on Aug 5, 2025. Keep track of upcoming events with our Earnings Calendar.
UCM net income for the last half-year is 520.57 M EUR, while the previous report showed 421.75 M EUR of net income which accounts for 23.43% change. Track more BUZZI SPA financial stats to get the full picture.
Yes, UCM dividends are paid annually. The last dividend per share was 0.70 EUR. As of today, Dividend Yield (TTM)% is 1.52%. Tracking BUZZI SPA dividends might help you take more informed decisions.
BUZZI SPA dividend yield was 1.97% in 2024, and payout ratio reached 13.62%. The year before the numbers were 2.18% and 11.49% correspondingly. See high-dividend stocks and find more opportunities for your portfolio.
As of Jul 21, 2025, the company has 10.06 K employees. See our rating of the largest employees — is BUZZI SPA on this list?
EBITDA measures a company's operating performance, its growth signifies an improvement in the efficiency of a company. BUZZI SPA EBITDA is 1.23 B EUR, and current EBITDA margin is 28.44%. See more stats in BUZZI SPA financial statements.
Like other stocks, UCM shares are traded on stock exchanges, e.g. Nasdaq, Nyse, Euronext, and the easiest way to buy them is through an online stock broker. To do this, you need to open an account and follow a broker's procedures, then start trading. You can trade BUZZI SPA stock right from TradingView charts — choose your broker and connect to your account.
Investing in stocks requires a comprehensive research: you should carefully study all the available data, e.g. company's financials, related news, and its technical analysis. So BUZZI SPA technincal analysis shows the sell today, and its 1 week rating is buy. Since market conditions are prone to changes, it's worth looking a bit further into the future — according to the 1 month rating BUZZI SPA stock shows the buy signal. See more of BUZZI SPA technicals for a more comprehensive analysis.
If you're still not sure, try looking for inspiration in our curated watchlists.
If you're still not sure, try looking for inspiration in our curated watchlists.