UZC trade ideas
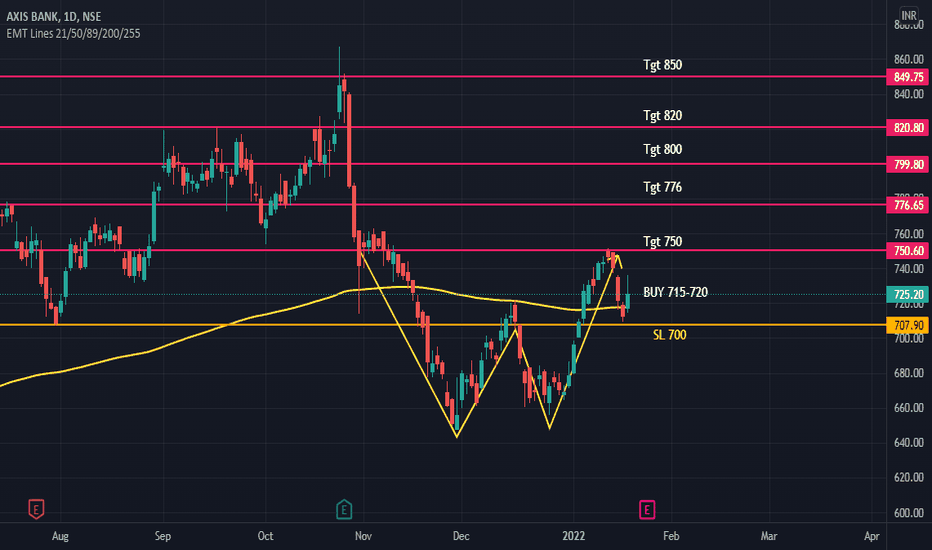
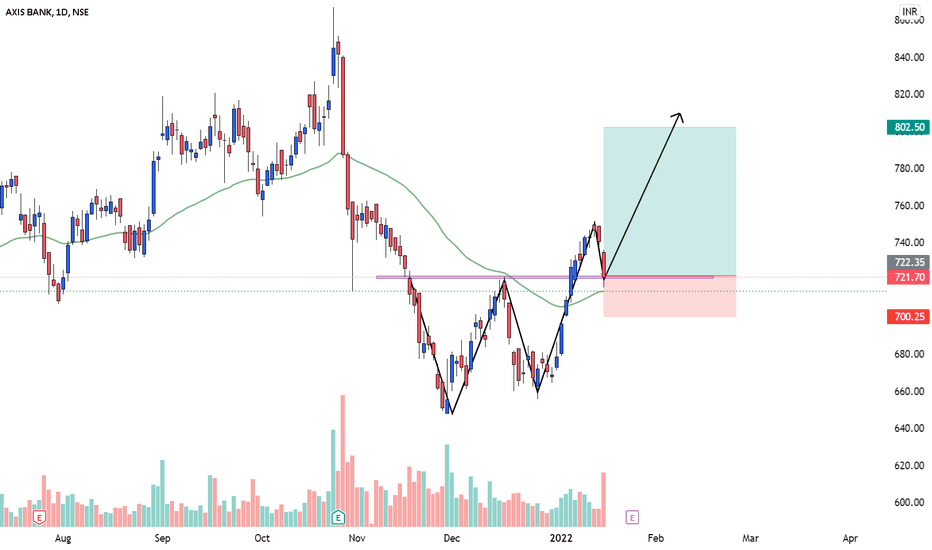
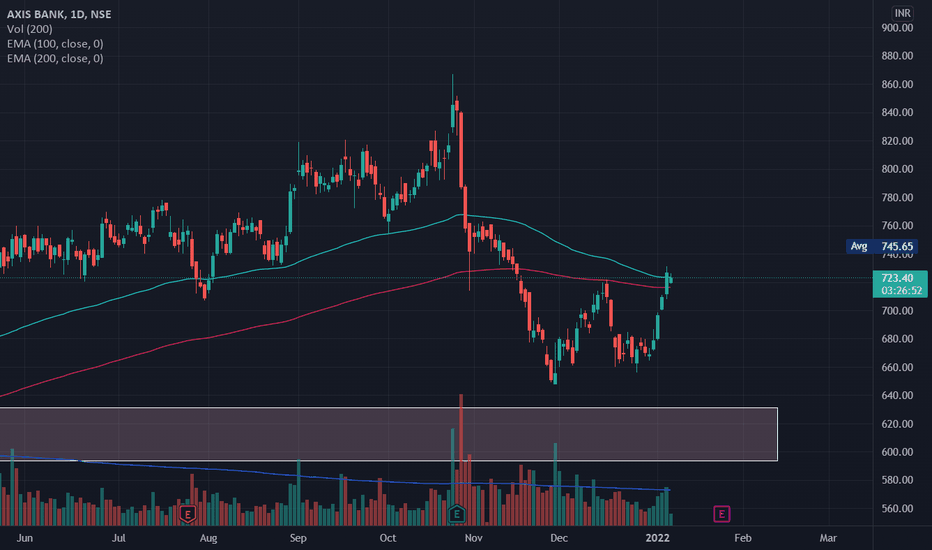
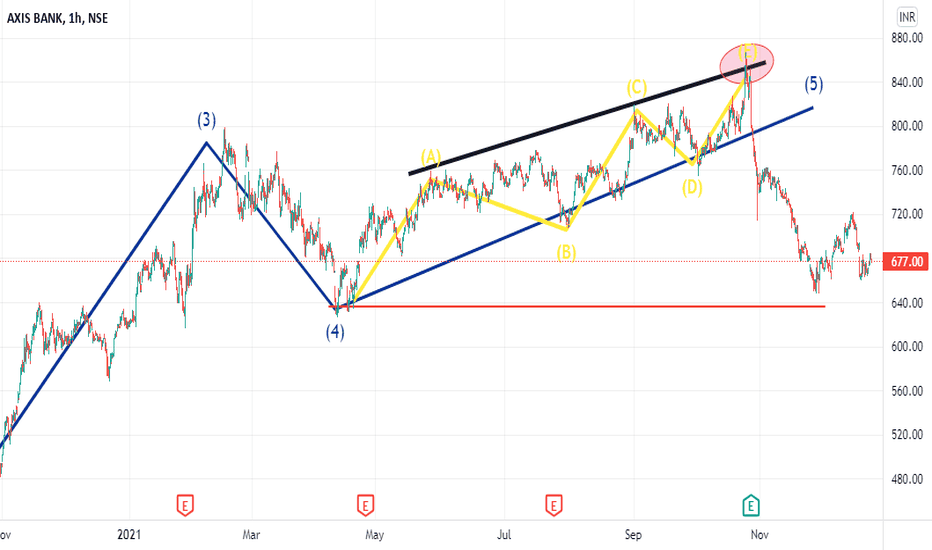
Axis Bank (Long)Axis bank Good volume seen
Broken and trading above 200 EMA on daily chart
Double bottom made (W pattern)
took support near 700
Buy near 715 - 720
TGT 750 -776 - 800 - 820 - 850
SL 700
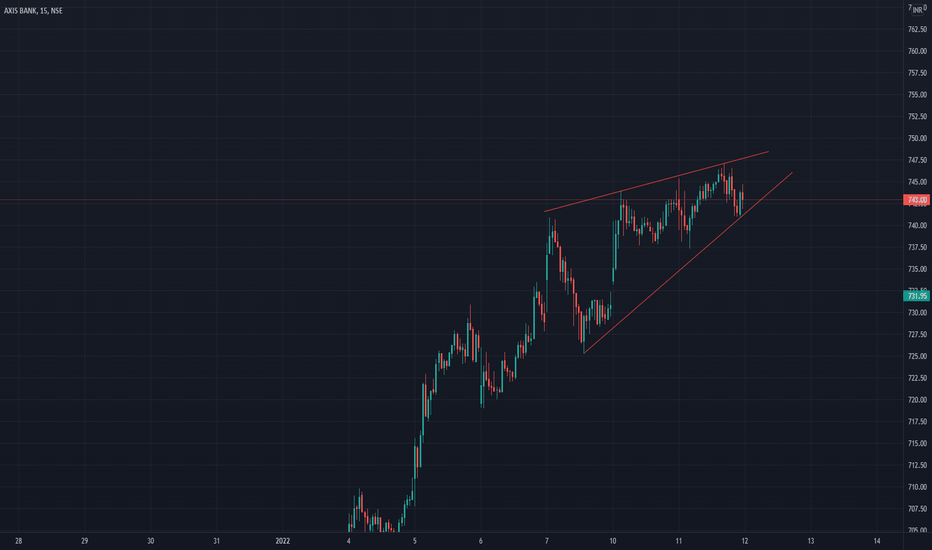
BO above 750 .... which will take it to 850+
Please do correlate by yourself also on charts. This is for paper trading and educational purpose only. Must consult your Financial advisor before investing.
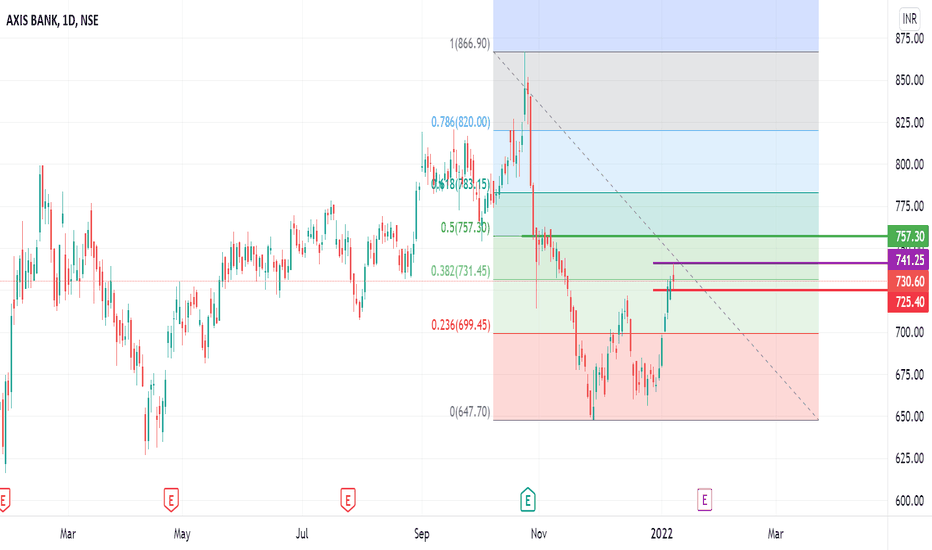
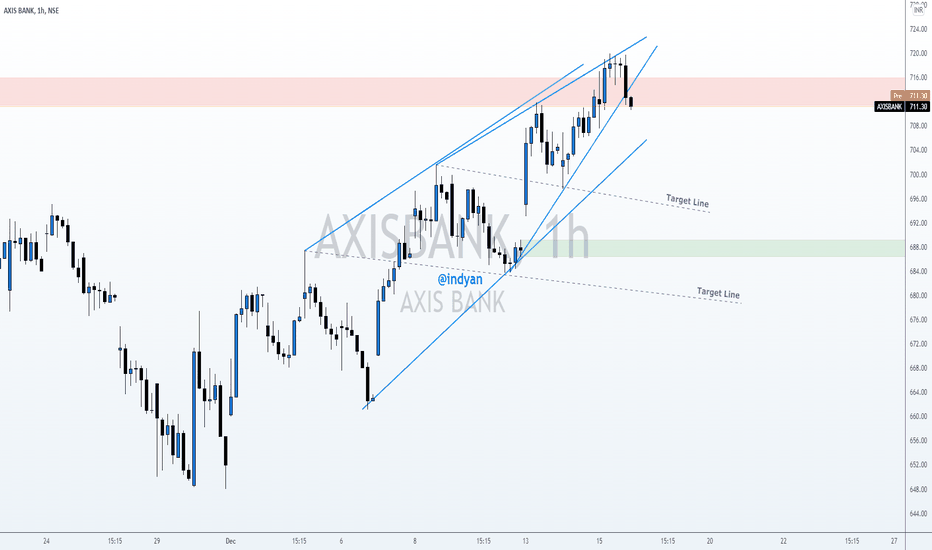
Axis Bank - When to enter?Axis Bank
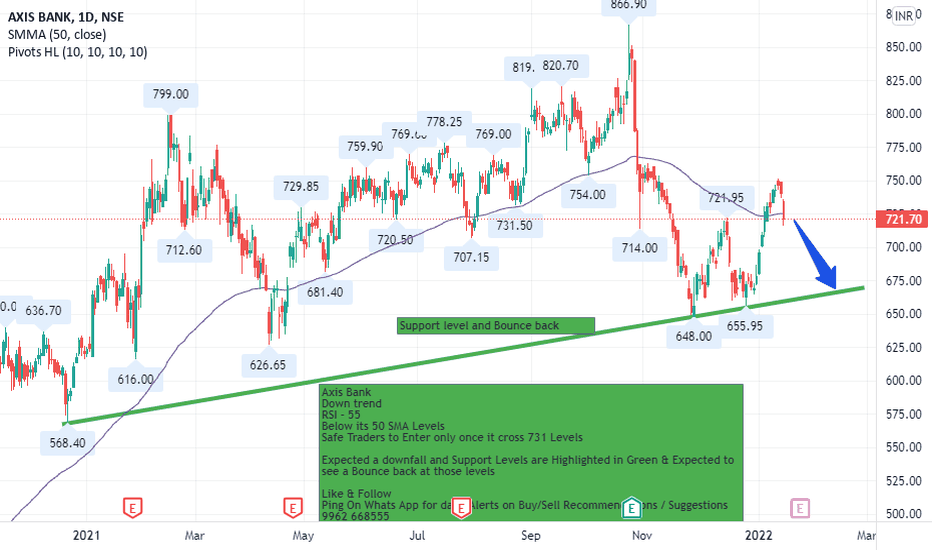
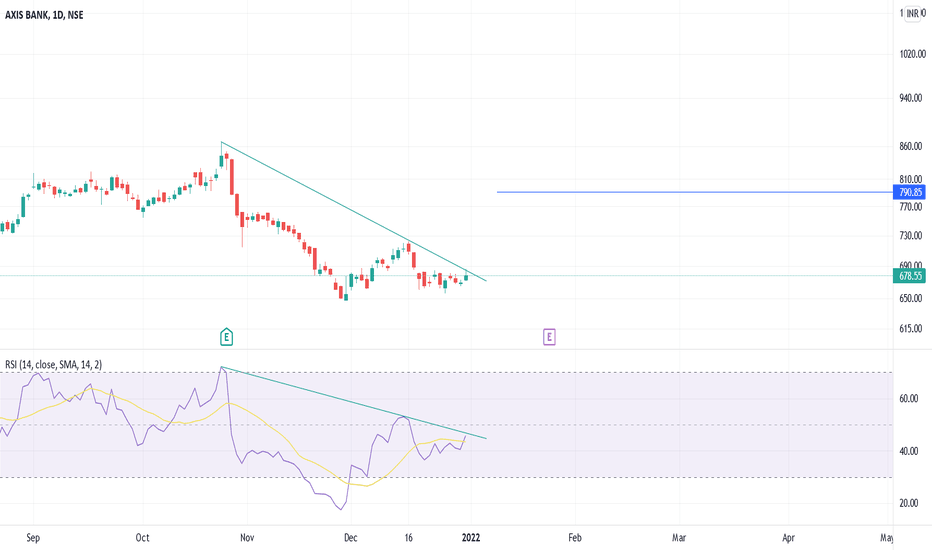
Down trend
RSI - 55
Below its 50 SMA Levels
Safe Traders to Enter only once it cross 731 Levels
Expected a downfall and Support Levels are Highlighted in Green & Expected to see a Bounce back at those levels
Like & Follow
Ping On Whats App for daily Alerts on Buy/Sell Recommendations / Suggestions
9962 668555
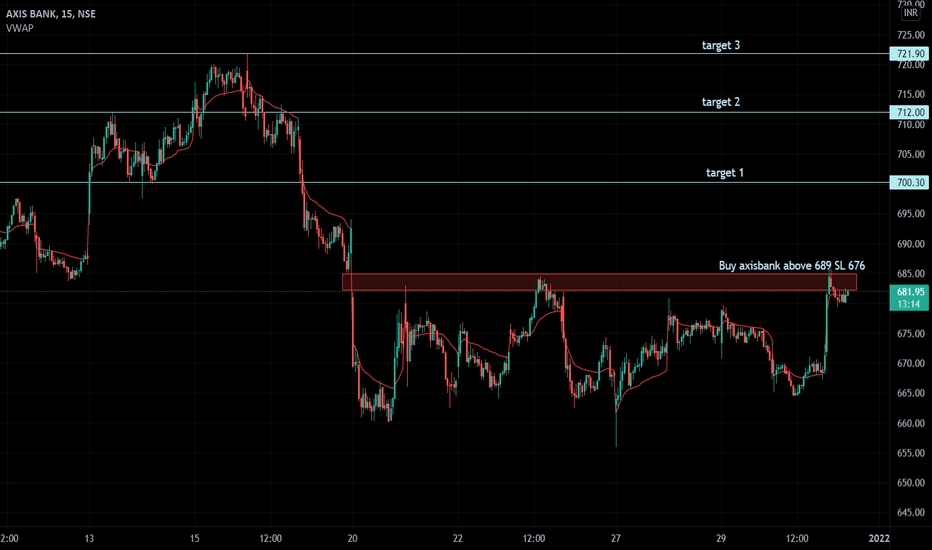
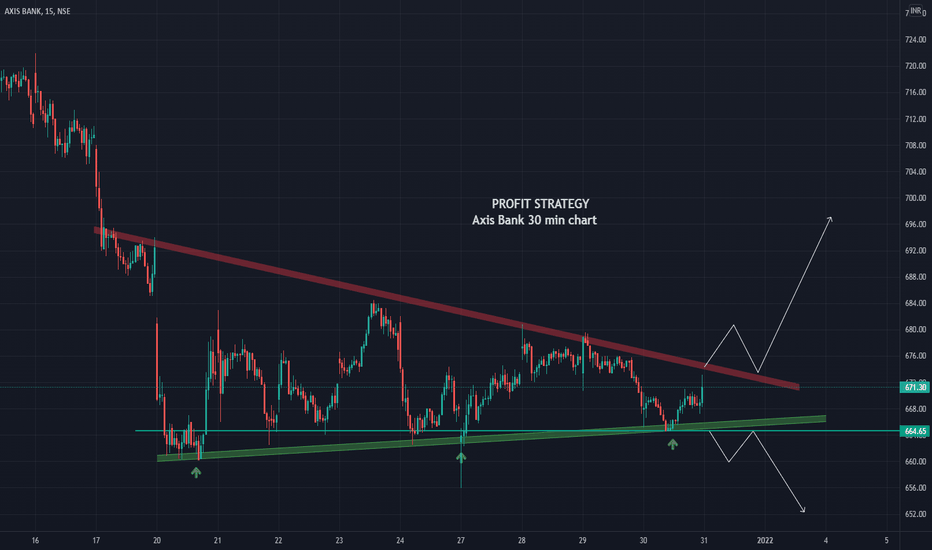
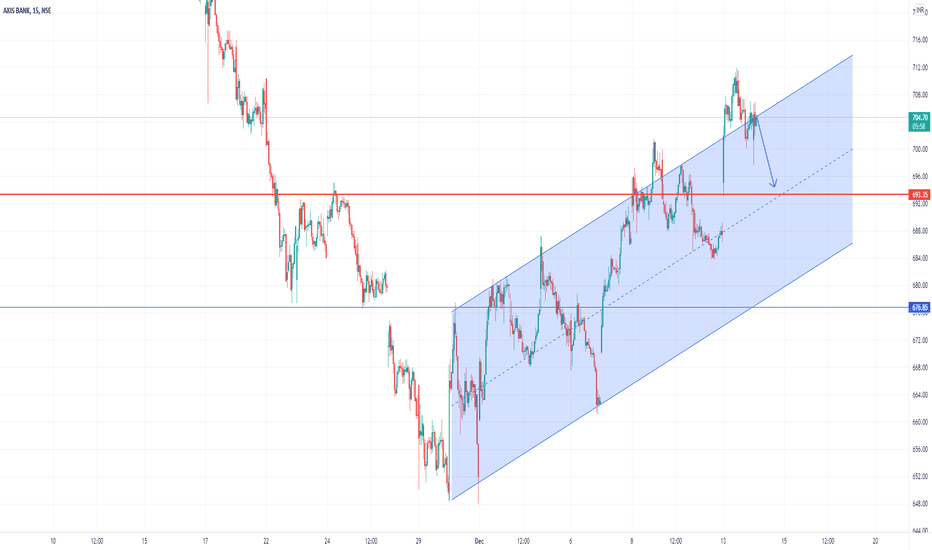
AXISBANK B @ 683 & TARGET @ 690Dear Traders,
AXISBANK B @ 683 & TARGET @ 690
Many people made huge profits last week and as per my predictions , the market was running same direction and entry and exit strategies where bang on target.
Dear traders kindly follow our signals for maximum profits,
our signals are based on analytics, algorithms, mathematical derivatives.
Always be a responsible trader, kindly trade only when you have maximum opportunity in the market with minimum risk and with keynotes like data, analysis and proper strategies.
Kindly message us for strategies and analysis.
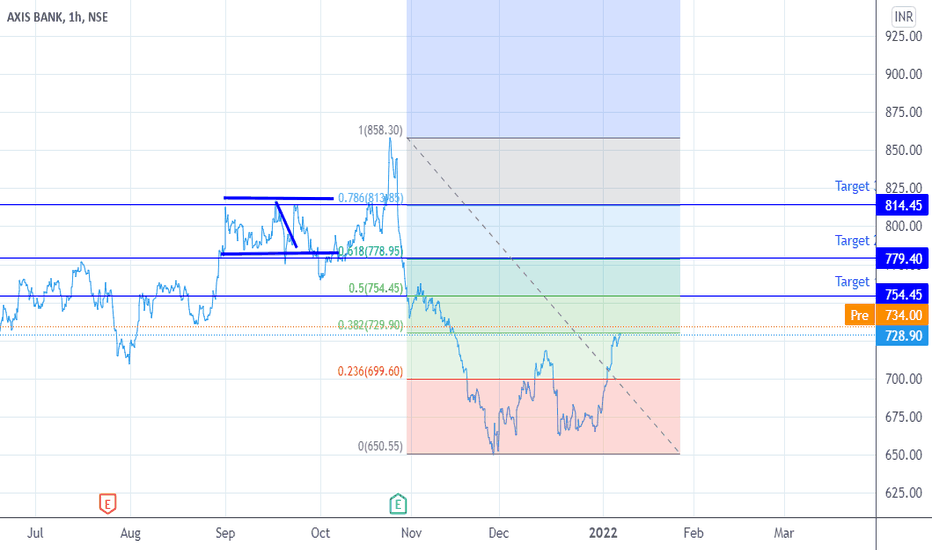
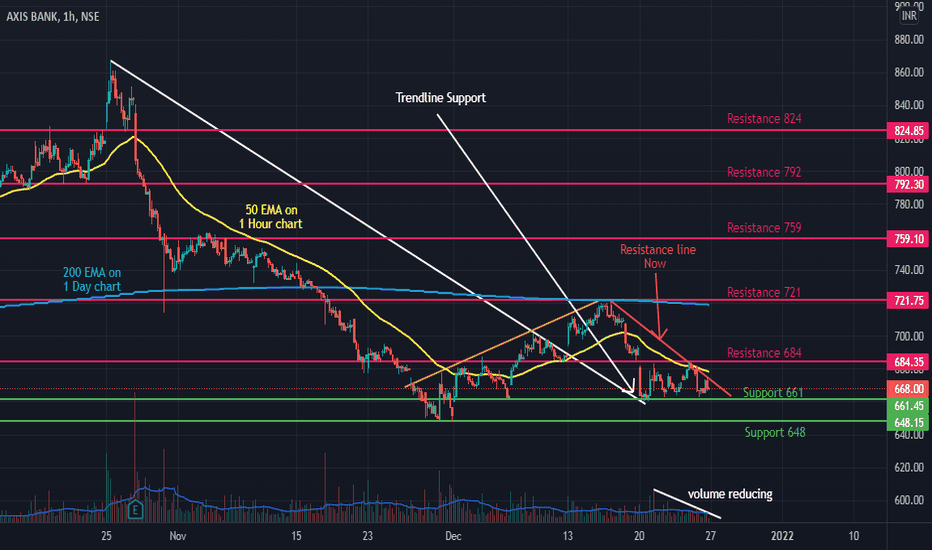
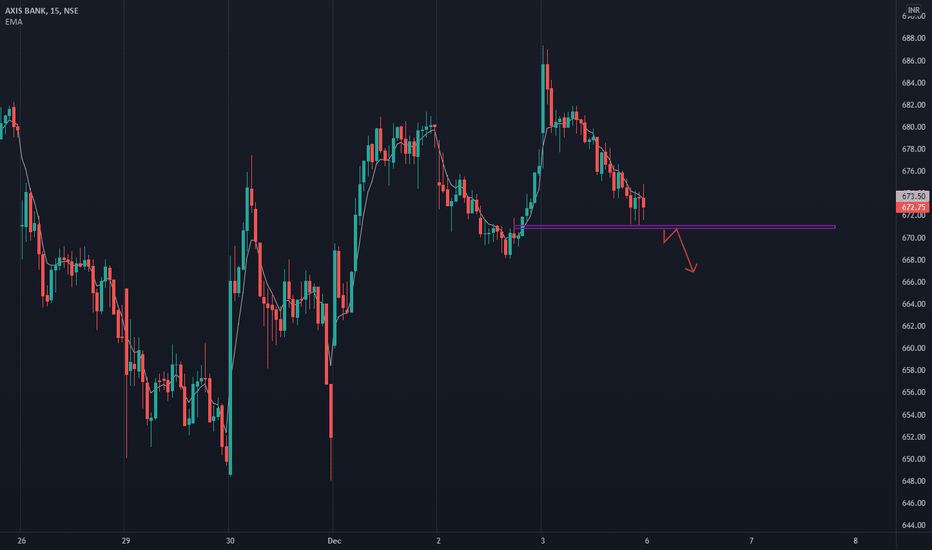
AXIS BANK (Long)AXIS Bank Trading Below 200 EMA on Daily chart.
facing Resistance fro 50 EMA on Hourly chart.
fresh resistance line marked in red colour.
Volume is reducing continuously.
Resistance Levels are 684 - 721 - 759 - 792 - 824
Support at 661 - 648
Risky Traders can buy @ 661 keeping Targets as 684 - 721 - 759 - 792 - 824 with SL @ 648
Safe traders to make position only above 721 when retested once, which is also 200 EMA on daily chart.
This is for Educational and paper trading purpose only. Must consult your financial advisor before investing or taking any position in the market. please correlate by yourself also on charts.
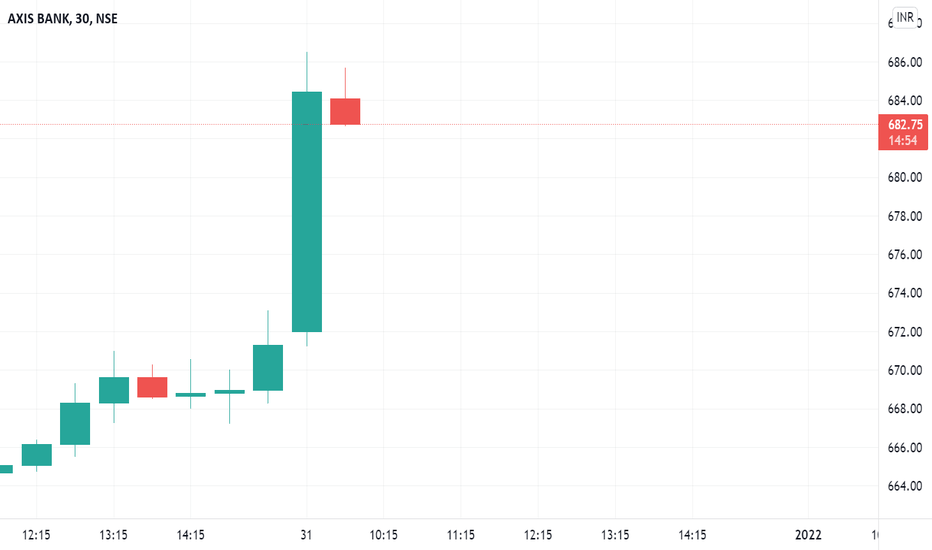
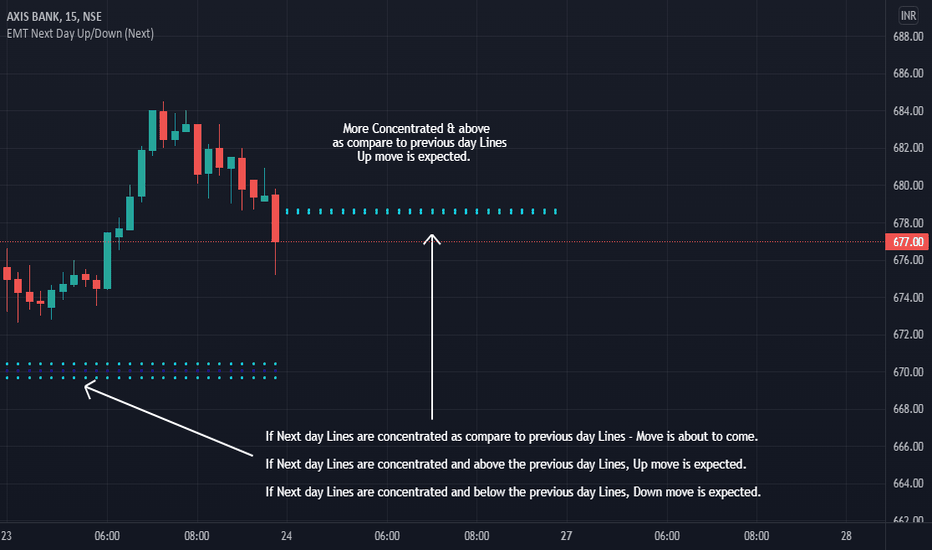
EMT Next Day Up/Down on Axis BankSimple Indicator
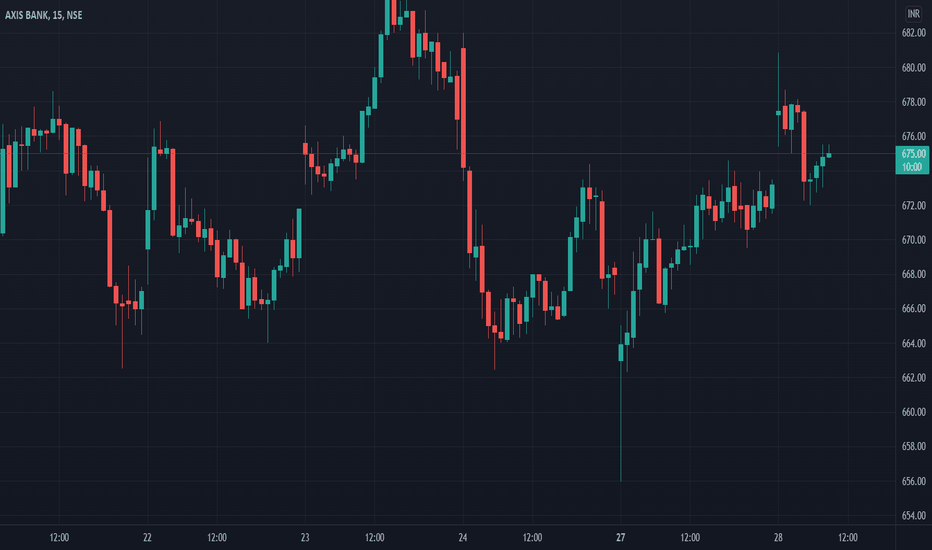
If Next day Lines are concentrated as compare to previous day Lines - Move is about to come.
If Next day Lines are concentrated and above the previous day Lines, Up move is expected.
If Next day Lines are concentrated and below the previous day Lines, Down move is expected.
After this you can correlate with chart patterns for its correctness.
This is for Educational and paper trading purpose only. Must consult your financial advisor before investing or taking any position in the market. please correlate by yourself also on charts.
