UZC trade ideas
Buy axis bank Buy axis bank @630 target price is 840
📈 or if you want to earn huge money then buy call option 630 ce is now at 7.5 rupee.

AXISBANK Daily Bullish GARTLEY + Bottom Reversal-two bar Sign Of Strength. first bar is widespread down bar closing on/off the low with high volume demand swamping supply or low volume no supply. The low and the close of first bar are lower than the previous few bars. The second bar is widespread up bar closing on/off the high on higher or lower volume than the first bar.
As second bar close & high are higher than the first bar high and volume on second bar is higher than the first bar volume, it shows effort to rise is successful AS second bar low is lower than the first bar low it shows additional strength. It shows immediate strength (Effort vs Result) & can be traded immediately on first No Supply / Test.
BUY
price need to follow Green Trend line & hit target
If price Breaks Red Trend line is where EXIT before SL hit

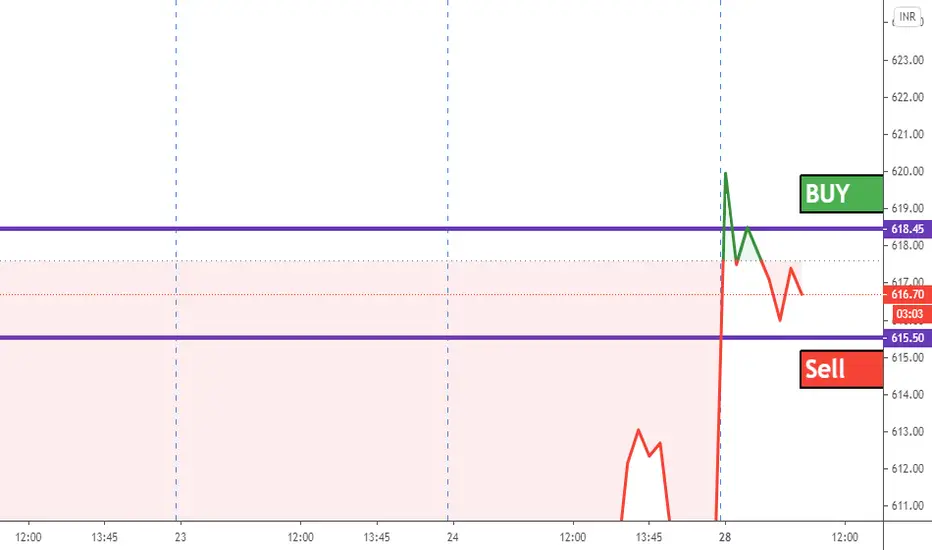
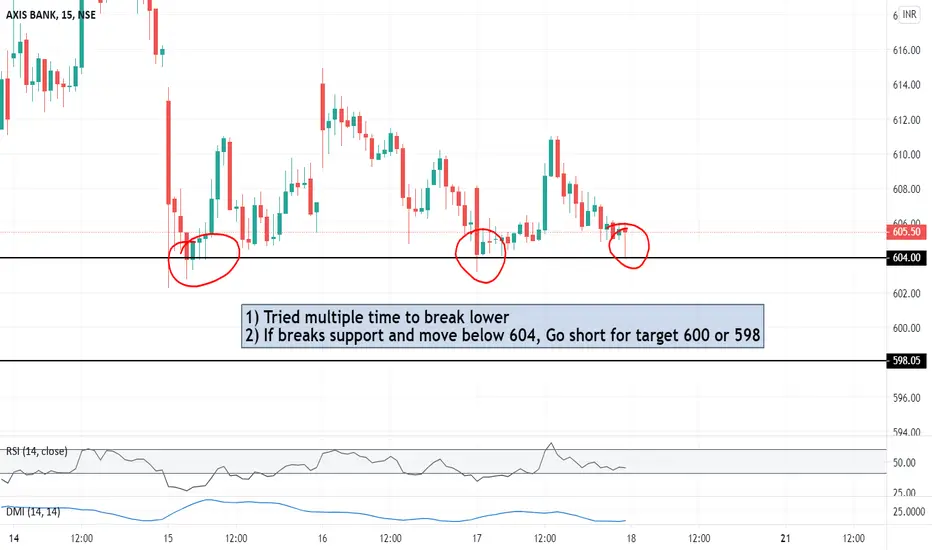
Intraday analysis of Axis Bank for intraday #Banknifty 28/12/20Intraday analysis of Axis Bank for intraday #Banknifty 28/12/20
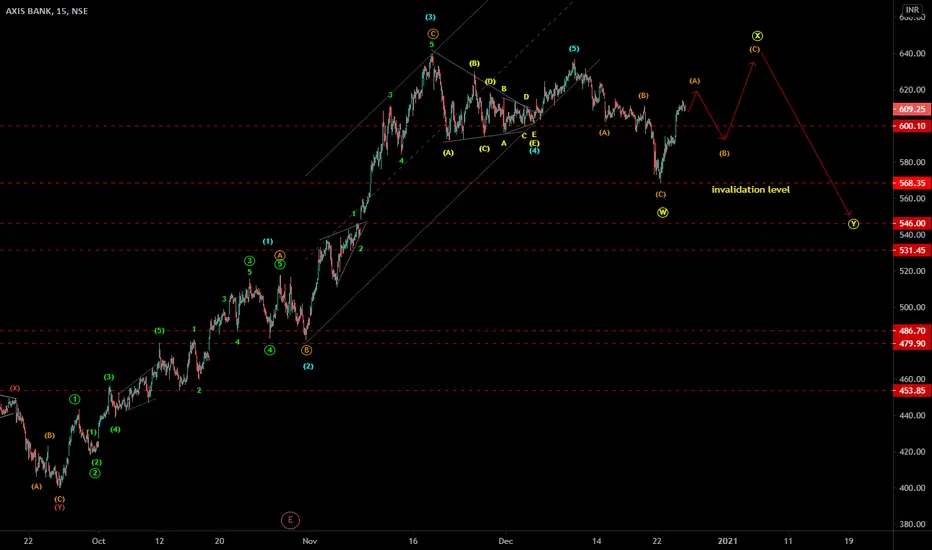
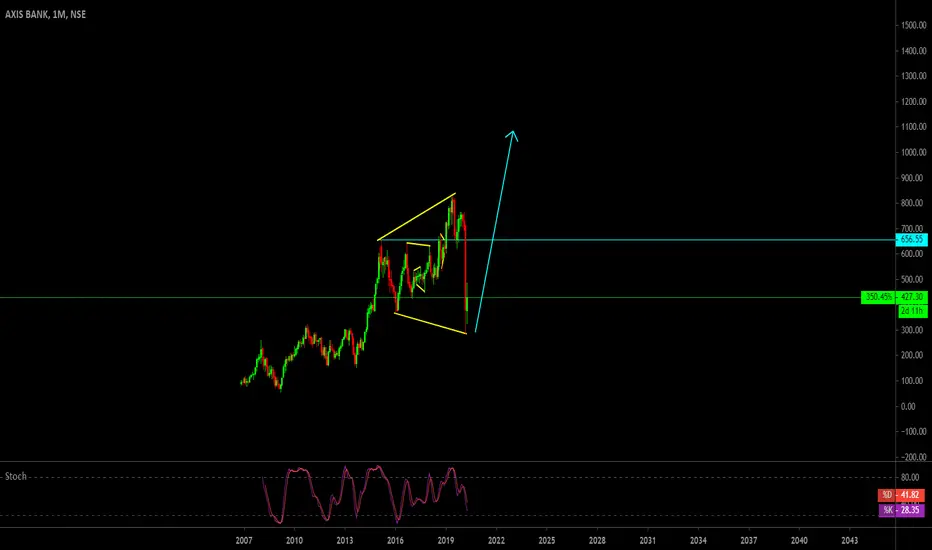
Axisbank - EW analysis - corrective cycle Axisbank is in corrective cycle, where X wave up is in progress as abc up move. Go long in pull back for c wave up.

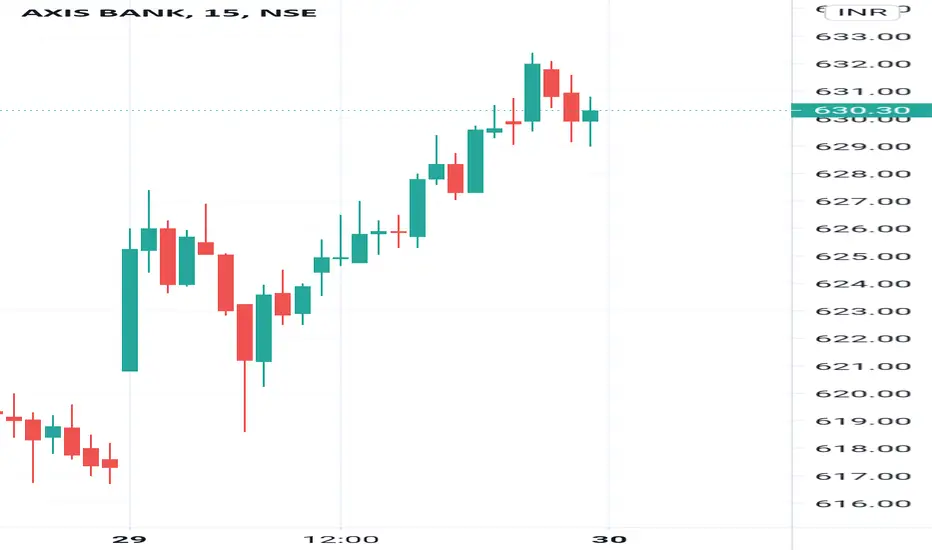
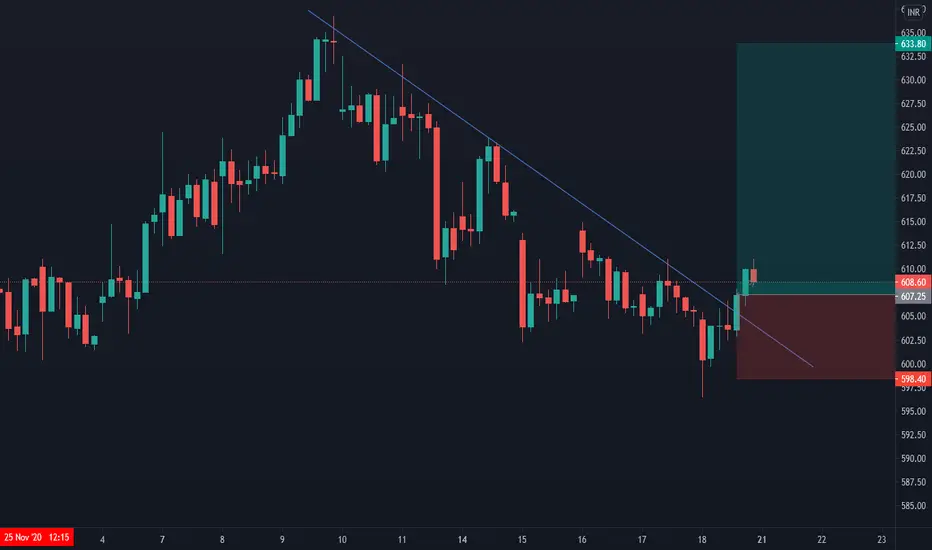
BREAK OUT OF A TREND LINEstock has been forming lowers lows and highs,dow trend line breakout happened.
one can go long at the close of the breakout candle
SL at 1 ATR below the low of the breakout candle
Targets 616,625,633.80
Go short if open flat or almost flat and cross level Go short if open flat or almost flat and cross level
Axis Bank - Breakout AwaitedThe stock is currently in a range from and the breakout confirms the trend and mostly bearish breakdown expected...

AXIS BANK POTENTIAL LONG TRADEHi TV people, Nice buying setup is in formation in axis bank, corrective pattern seems like a expanding flat. in my previous idea i had posted about short opportunity, i hope someone who found that useful made some profit in it. this long setup is very major in terms of r:r. so look for long setups in lower time frame for entries.
Thanks!
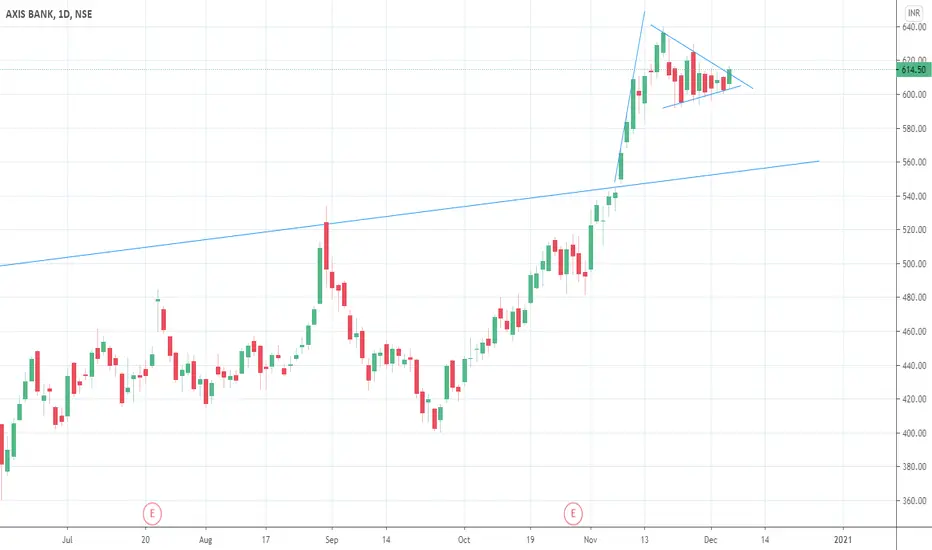
AXIS BANK DAILY FLAG BREAKOUT LONGOn Daily Time Frame Flag Breakout is happening and also in Hourly TIME Frame Triangle Breakout, Can Look for Long from Levels of 610

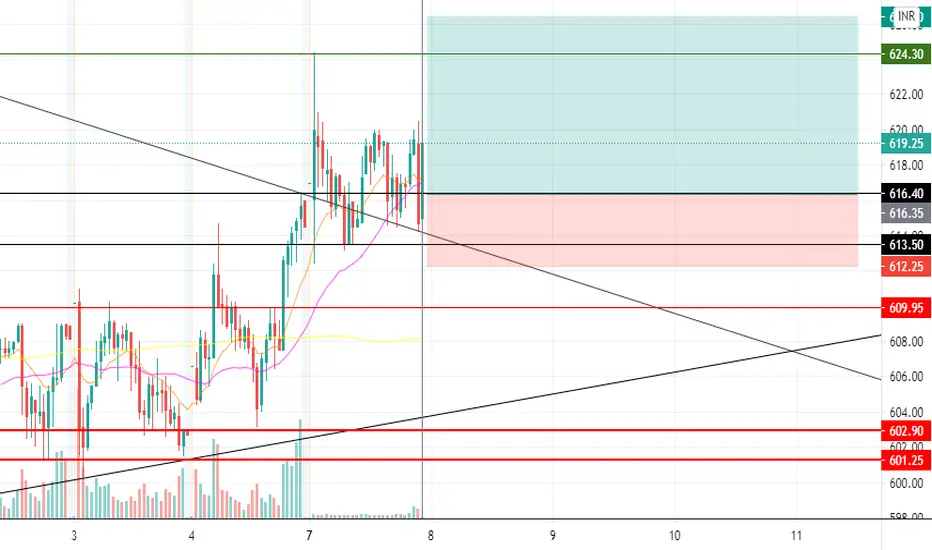
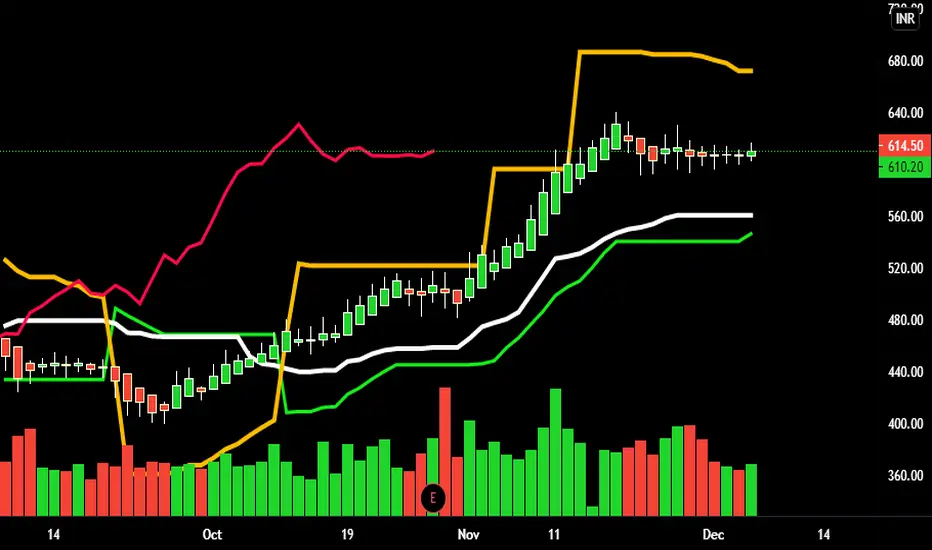
Axisbank swing Target 1 is the first green line the second target is even higher
The range between the black line is no trade zone
the red line indicates resistance if at all it's broken the trend is broken too.
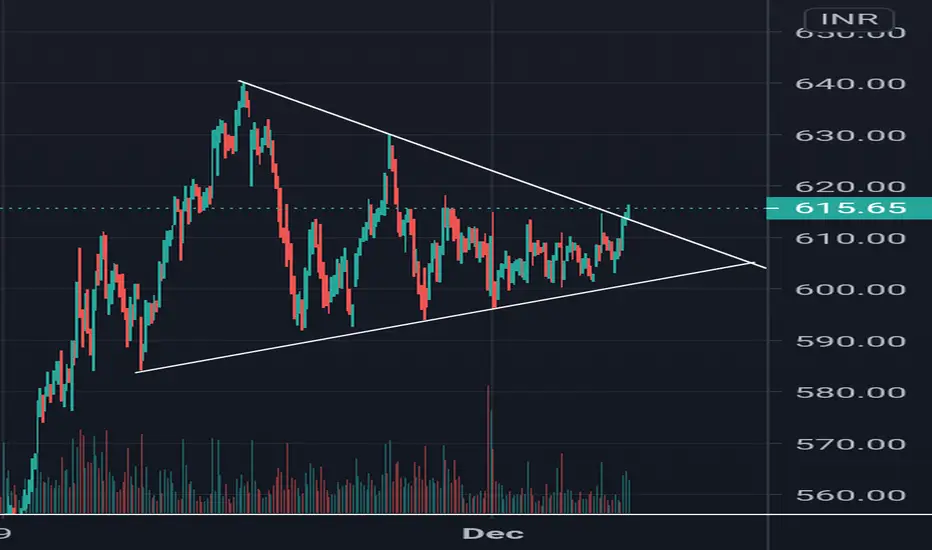
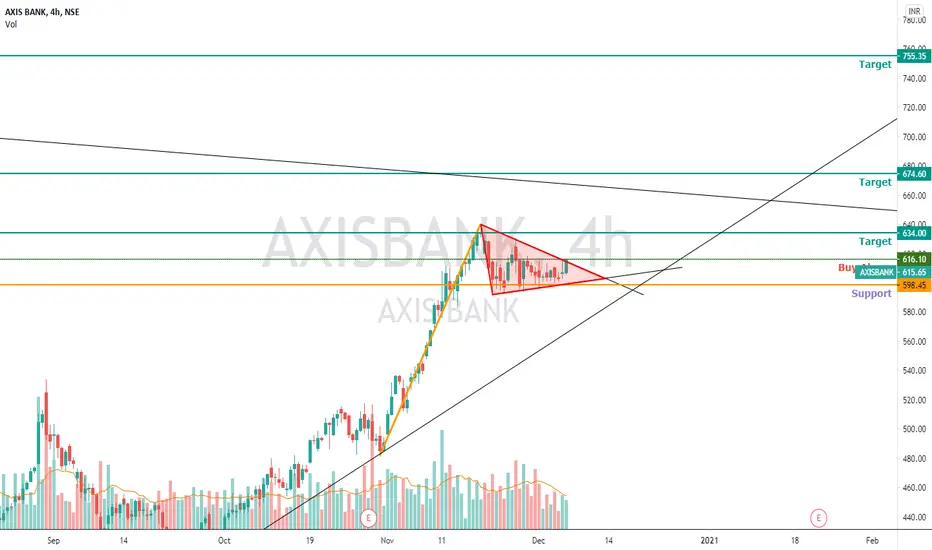
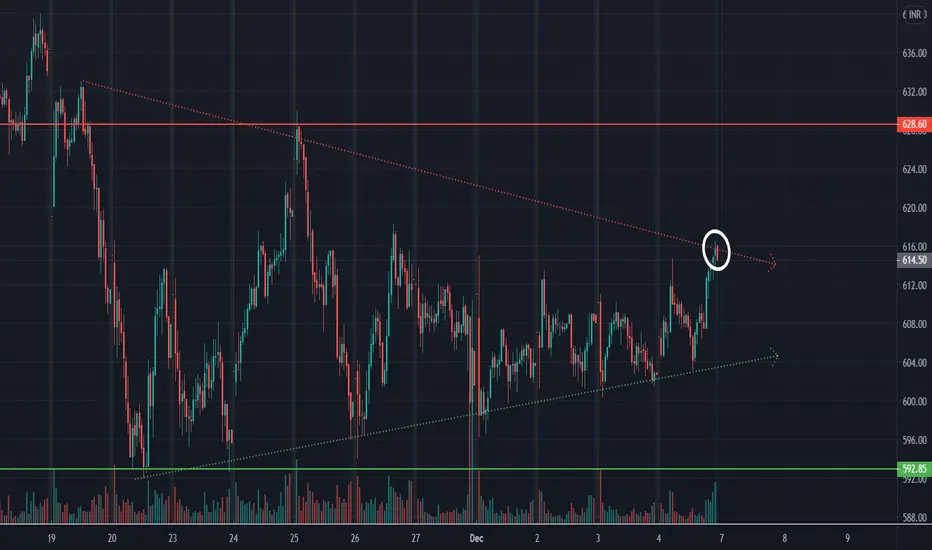
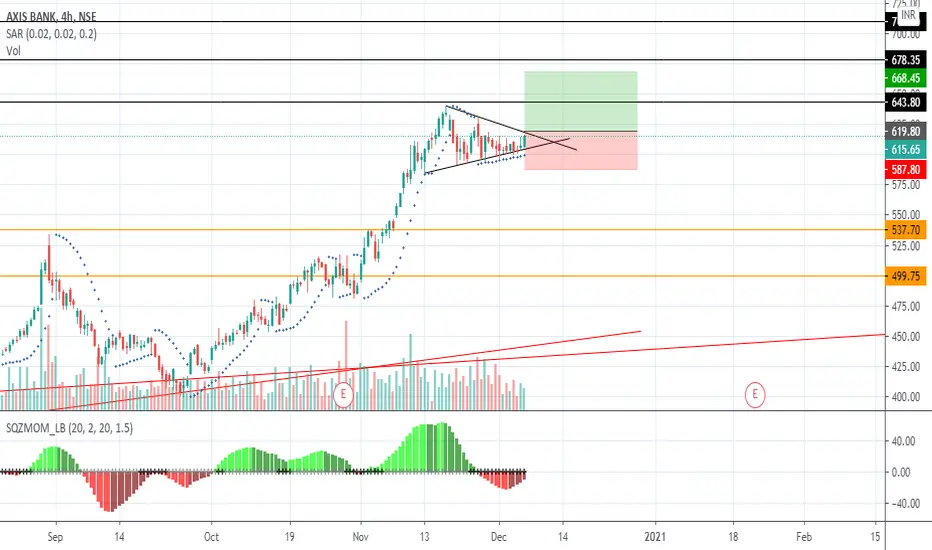
Axis Bank Forecasting Pls refer the chart.
Script is trading in a pennant pattern range ,& you can zoom out the chart to understand it better that pole is also plotted there and now it is available at resistance encircled so if you want to trade this on upcoming session then you can trade according to your risk reward ratio.
if it give breakout in up side then 628 is the tgt and if it breakedown then 592 is the tgt .
If any suggestion or query pls comment or ask in to chat.
If You agree with my idea then pls hit the like button ,follow me & share my ideas to other needy.
Disclaimer:
Markets are Supreme ,If I am proven wrong,i will accept it & learn.
I am not SEBI Registered ,This is just my own view.
If any data having any typing error then pls correct it for your analysis & drop a line to me in chat.
AXIS BANK CHART 4/12/2020AXIS BANK CHART Daily Chart till to- 04/12/2020
What You See In This Chart?
How to take Trade?
Which Type Take Entry (Long / Short)?
Which Price For StopLoss?
Which Price For Target?
Please Comment What You Think About Axis Bank Trade!!!!!
Disclaimer :- This Chart For Only Educational Purpose, We Can't Give Any Buy Sell Tips or Call, Learn first before take any trade....
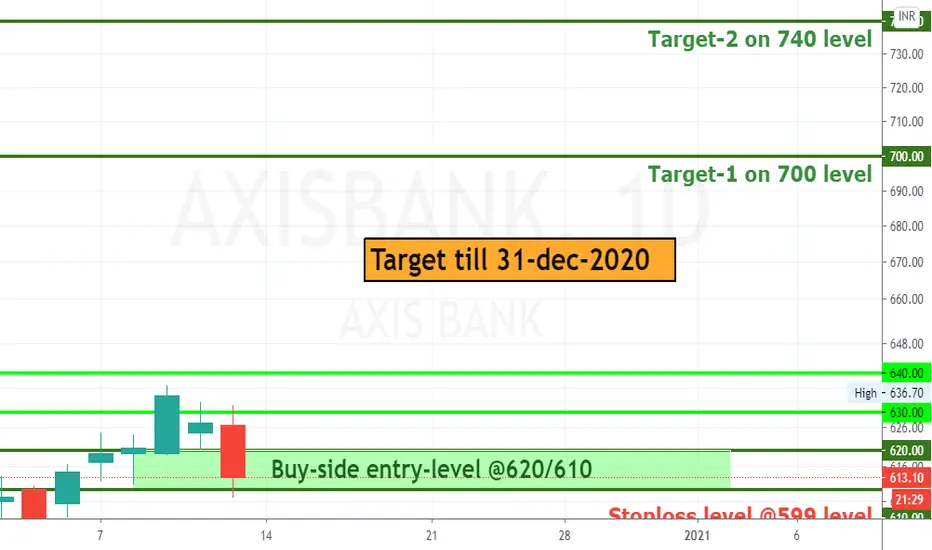
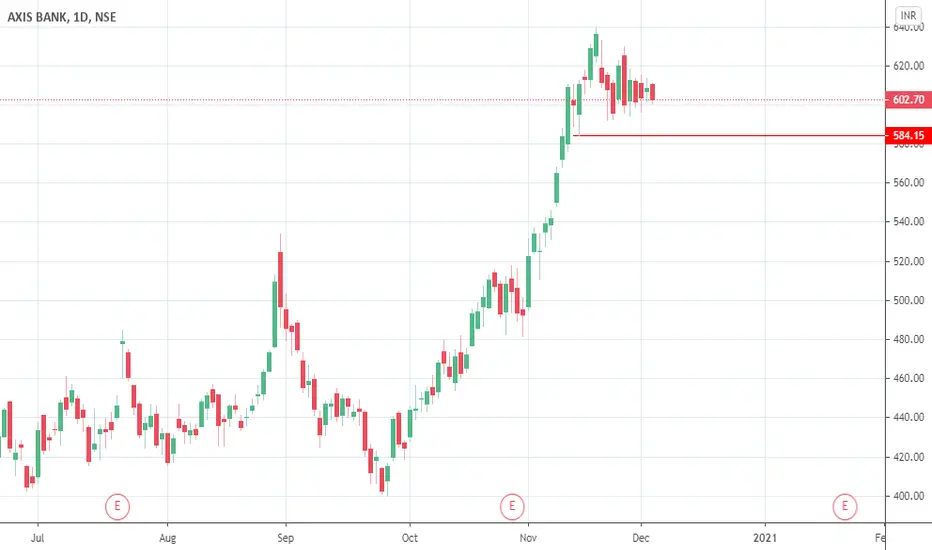
Axis Bank Long As you can see the daily chart of Axis Bank you can see the bullish flag pattern and it's breakout level above 620.
One can buy Axis Bank above 620 with SL at 590 and Target should be 675-700.
SL on closing basis.


AXISBANK - Bull Flag - Breakout awaited - SwingThis analysis is done purely on basis of price action and chart patterns
Analysis is done on Daily TF hence it may take few days to few weeks for price to reach the given target
Stock is at good consolidation phase and it can be accumulated with small SL below 590.
Stock is fundamentally strong.
This is not a trade recommendation. Do your own study before entering into any trade.
Trade with your own risk & money management.
Feel Free to comment for any query or suggestion.
Do check similar pattern in LT. Link is shared below
