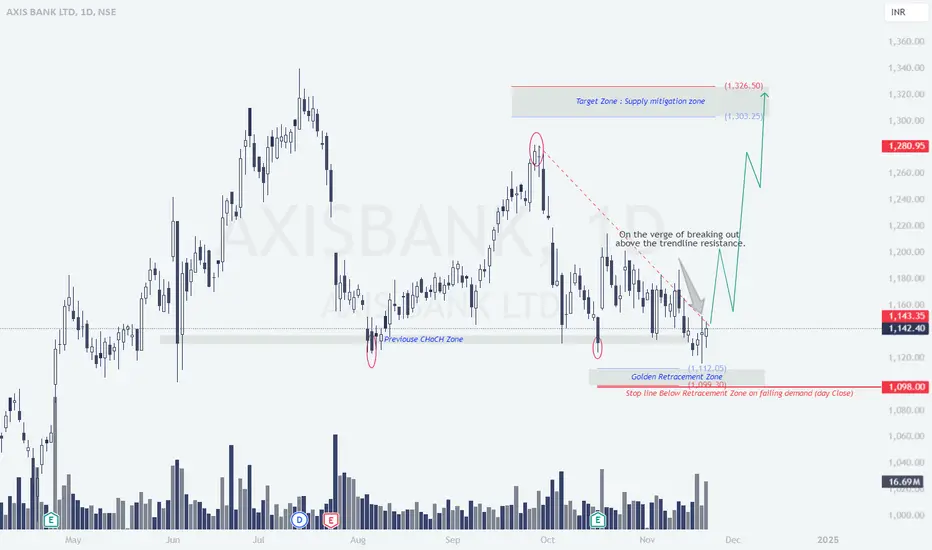
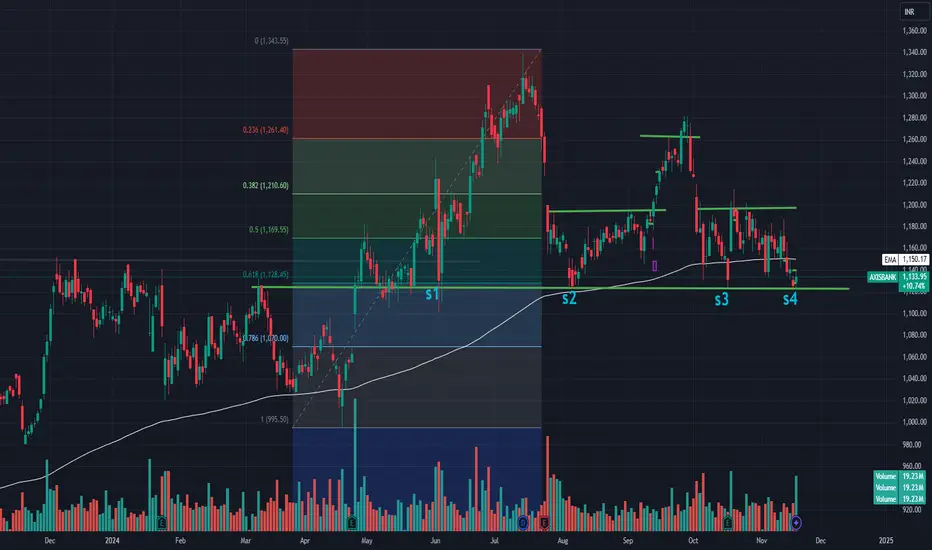
Axis Bank: Preparing to Break Resistance – A Rally in the MakingCurrent Price: ₹1,142.40 (+0.29%)
Axis Bank is consolidating near its Golden Retracement Zone (₹1,098 - ₹1,112) after breaking out of its Previous CHoCH Zone (Change of Character). It is also testing a trendline resistance, with potential for a breakout rally toward supply mitigation levels.
Key Levels:
Buy Zone: ₹1,112 - ₹1,143 (Golden Retracement Zone)
Stop Loss: ₹1,098 (on a daily close below the retracement zone)
Target 1: ₹1,280
Target 2: ₹1,303 - ₹1,326 (Supply mitigation zone)
Key Observations:
Golden Retracement Zone: Acts as a strong support for a bounce.
Trendline Breakout: A successful breakout above the resistance line may lead to sustained upward momentum.
Supply Zone: ₹1,303 - ₹1,326 is the next key level to watch for profit booking.
Disclaimer:
This analysis is for educational purposes only and is not financial advice. I am not a SEBI-registered analyst. Please do your own research or consult a financial advisor before making any investment decisions.
UZC trade ideas
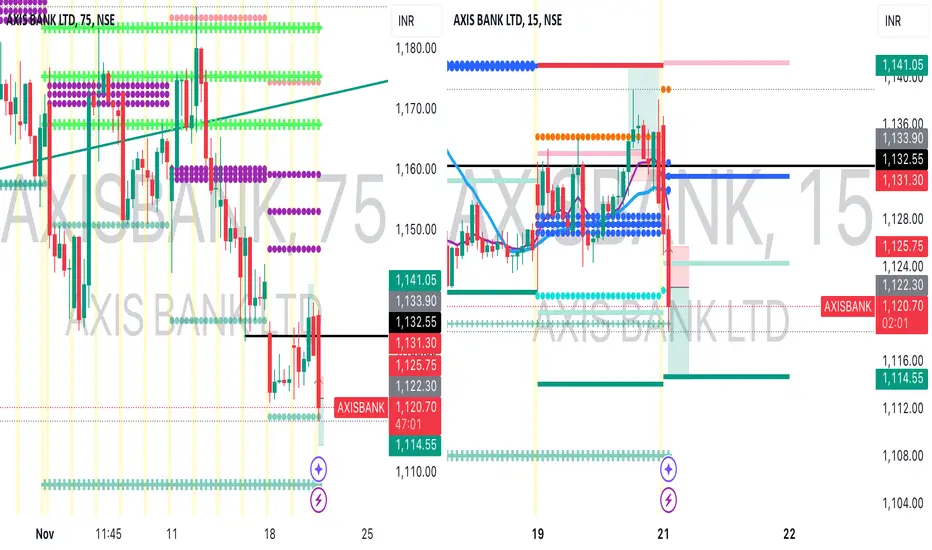
Axis Bank | Short | Intraday | Potential Swing HoldAxis Bank has witnessed a clear rejection from the Daily Pivot.
It's already trading below the Monthly Pivot and Weekly Pivot.
A short intraday trade has been initiated for Target till Daily S2 support zone at 1,114.8
If Axis Bank ends up forming an O=H candle by close of trading day today, then a swing short position can be initiated for this month's expiry.
Short target would be 1108 level.
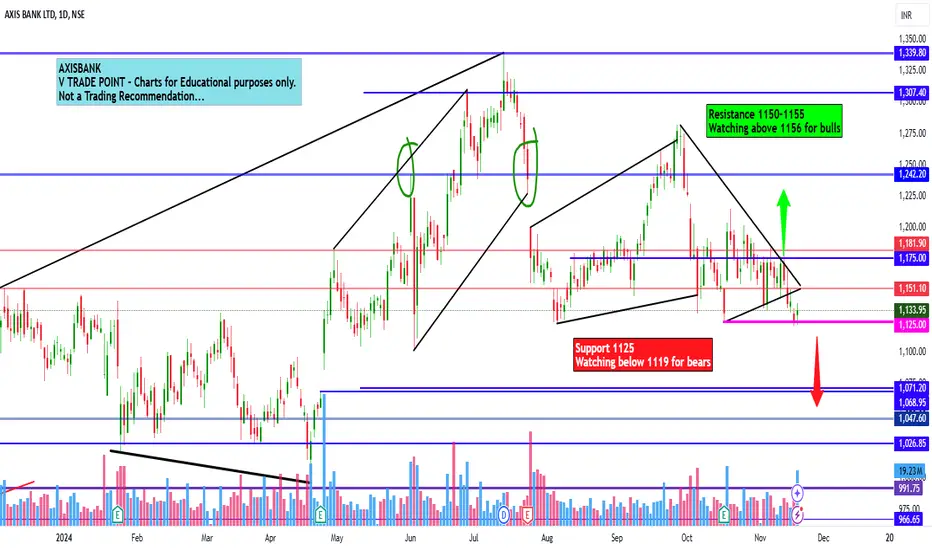
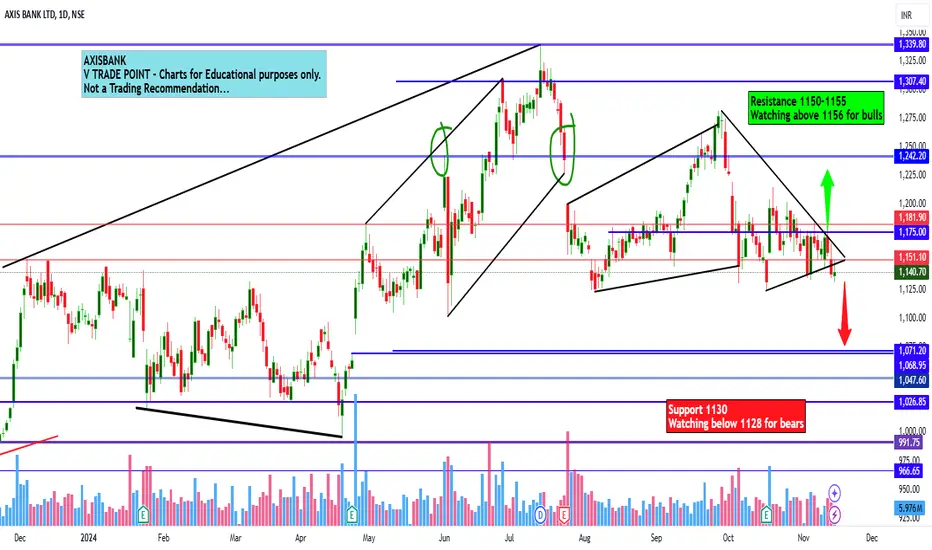
Axis Bank Ltd view for Intraday 21st Nov #AXISBANK Axis Bank Ltd view for Intraday 21st Nov #AXISBANK
Resistance 1150-1155. Watching above 1156 for upside movement...
Support area 1125 Below 1125-1130 ignoring upside momentum for intraday
Support 1125 Watching below 1119 for downside movement...
Resistance area 1150-1155
Above 1140 ignoring downside move for intraday
Charts for Educational purposes only.
Please follow strict stop loss and risk reward if you follow the level.
Thanks,
V Trade Point
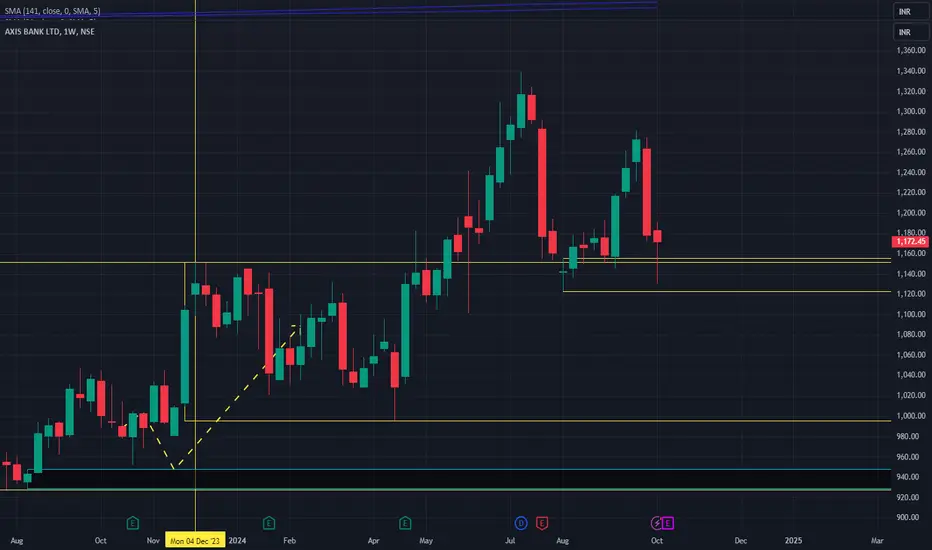
Axis Bank Technical Analysis: Cautious Outlook Near Key Support
Axis Bank is currently trading near a crucial support level at approximately ₹1120, significantly below its all-time high of ₹1340. Recent price action within a range of around ₹1133 indicates a period of consolidation.
Bearish Scenario: A decisive break below ₹1120 would be a bearish signal, potentially triggering a further decline towards ₹1080.
Market Context: It's vital to consider the broader market. Both Nifty and Bank Nifty indices are also trading near their support levels, suggesting a potential market-wide rebound. This adds a layer of uncertainty to the Axis Bank outlook.
Bullish Scenario: Conversely, a sustained move above the resistance level of ₹1200 would signal a significant shift in momentum, potentially initiating a rally.
Recommendation: Given the current market dynamics and Axis Bank's proximity to key support, we recommend a cautious approach. Investors should closely monitor price action and volume before making any significant trading decisions. A break above or below the key levels, accompanied by strong volume, would provide greater confirmation of the prevailing trend.
Axis Bank Ltd view for Intraday 18th Nov #AXISBANK Axis Bank Ltd view for Intraday 18th Nov #AXISBANK
Resistance 1150-1155. Watching above 11156 for upside movement...
Support area 1130. Below 1130 ignoring upside momentum for intraday
Support 1130 Watching below 1128 for downside movement...
Resistance area 150-1155
Above 1150 ignoring downside move for intraday
Charts for Educational purposes only.
Please follow strict stop loss and risk reward if you follow the level.
Thanks,
V Trade Point

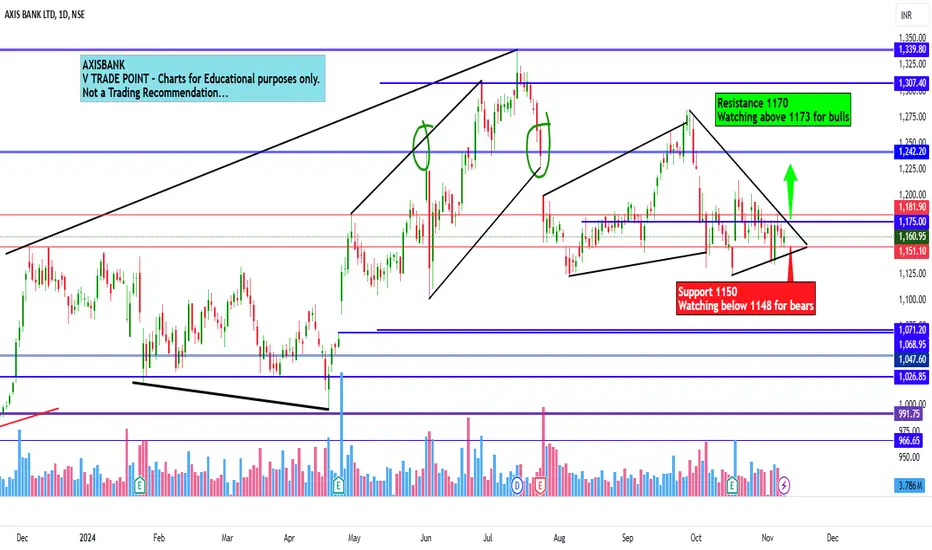
Axis Bank Ltd view for Intraday 11th Nov #AXISBANK Axis Bank Ltd view for Intraday 11th Nov #AXISBANK
Resistance 1170. Watching above 1173 for upside movement...
Support area 1150 Below 1150 ignoring upside momentum for intraday
Support 1150.Watching below 1147 for downside movement...
Resistance area 1170
Above 1170 ignoring downside move for intraday
Charts for Educational purposes only.
Please follow strict stop loss and risk reward if you follow the level.
Thanks,
V Trade Point
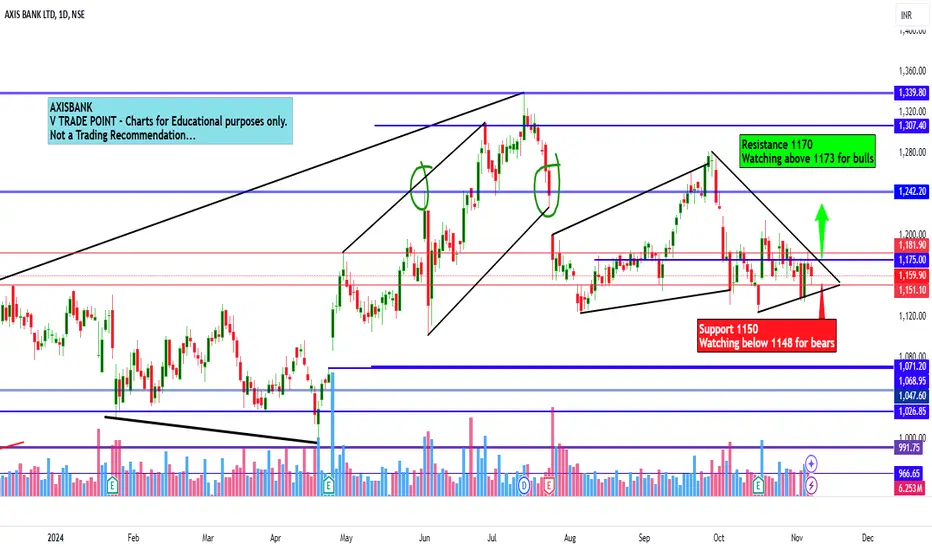
Axis Bank Ltd view for Intraday 8th Nov #AXISBANK Axis Bank Ltd view for Intraday 8th Nov #AXISBANK
Resistance 1170. Watching above 1173 for upside movement...
Support area 1150. Below 1150 ignoring upside momentum for intraday
Support 1150 .Watching below 1150 for downside movement...
Resistance area 1170
Above 1170 ignoring downside move for intraday
Charts for Educational purposes only.
Please follow strict stop loss and risk reward if you follow the level.
Thanks,
V Trade Point
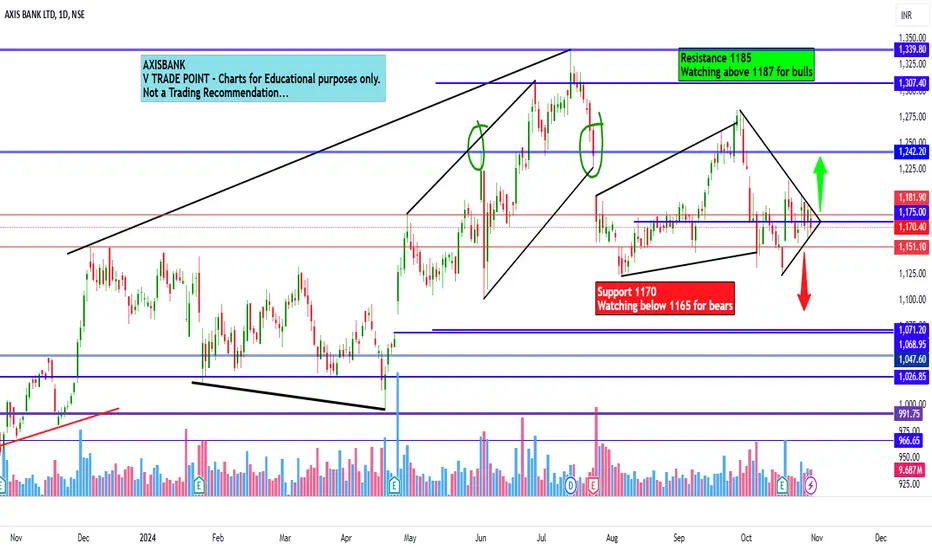
Axis Bank Ltd Ltd for Intraday 31st October #AXISBANK Axis Bank Ltd Ltd for Intraday 31st October #AXISBANK
Resistance 1185. Watching above 1187 for upside movement...
Support area 1170. Below 1170 ignoring upside momentum for intraday
Support 1170 .Watching below 1165 for downside movement...
Resistance area 1185
Above 1185 ignoring downside move for intraday
Charts for Educational purposes only.
Please follow strict stop loss and risk reward if you follow the level.
Thanks,
V Trade Point
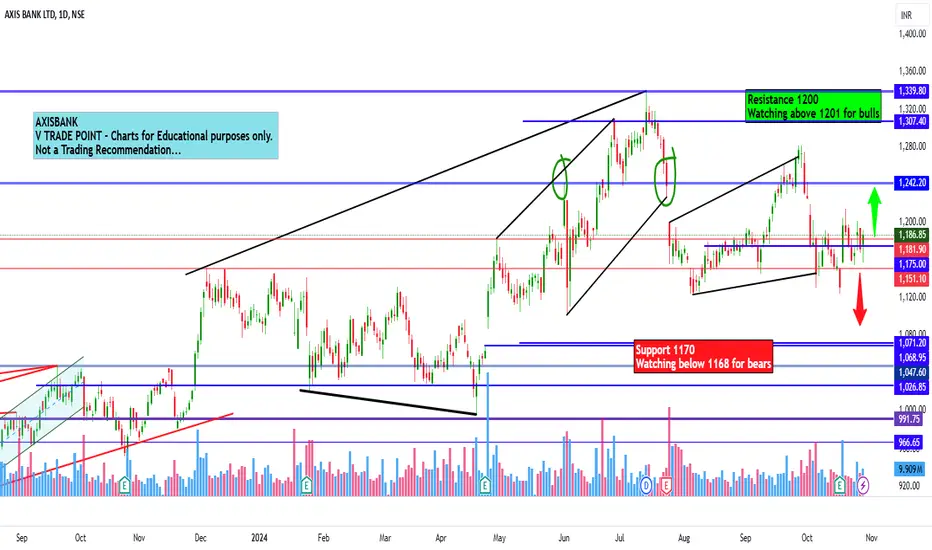
Axis Bank Ltd for Intraday 30th October #AXISBANK Axis Bank Ltd for Intraday 30th October #AXISBANK
Resistance 1200. Watching above 1201 for upside movement...
Support area 1170.. Below 1182 ignoring upside momentum for intraday
Support 1170.Watching below 1168 for downside movement...
Resistance area 1200
Above 1280 ignoring downside move for intraday
Charts for Educational purposes only.
Please follow strict stop loss and risk reward if you follow the level.
Thanks,
V Trade Point
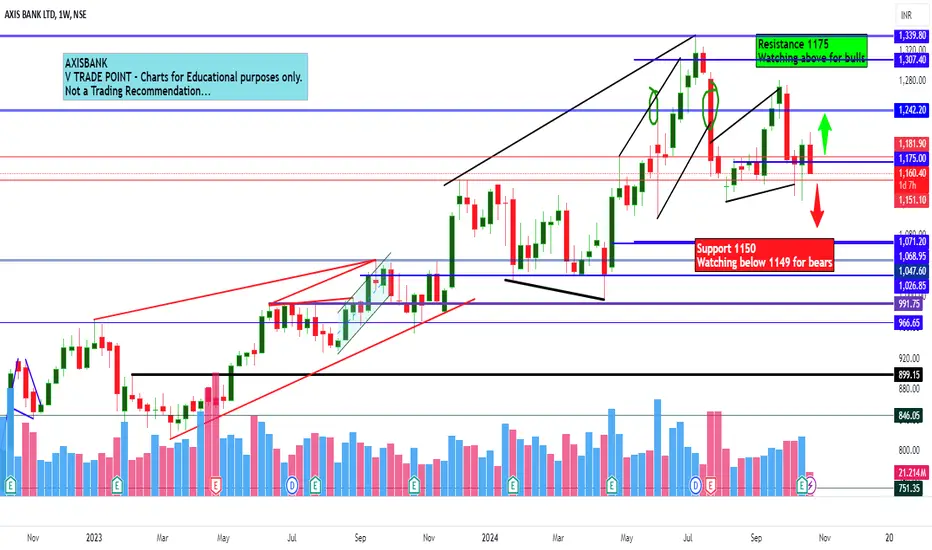
Axis Bank Ltd for Intraday 24th October #AXISBANK Axis Bank Ltd for Intraday 24th October #AXISBANK
Resistance 1175. Watching above 1176 for upside movement...
Support area 1150. Below ignoring upside momentum for intraday
Support 1150.Watching below 1149 for downside movement...
Resistance area 1175
Above ignoring downside move for intraday
Charts for Educational purposes only.
Please follow strict stop loss and risk reward if you follow the level.
Thanks,
V Trade Point

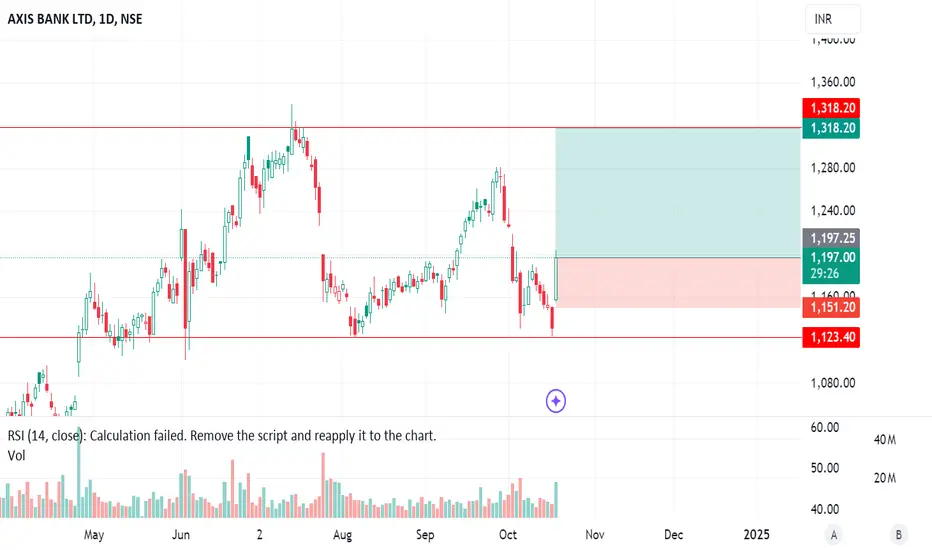
Axis Bank Positional SetupEntry: Consider entering around the current level of ₹1,197.50.
Target: Aim for the upside towards ₹1,318.20, aligning with recent resistance levels.
Stop Loss: Place a stop loss at ₹1,151.20 to manage risk effectively.
Rationale: The stock has shown strong momentum with a significant upward move of 5.80%, and it's approaching a critical resistance zone. A break above this zone could signal further bullish continuation.
Technical Indicators: RSI suggests a recovery, and volume spike indicates buying interest.
Axis Bank Set upAXIS Bank- Set ups
MTF Analysis
AXIS BankYearly Demand Beakout 959
AXIS Bank 6 Month Demand Breakout 1152
AXIS BankQtrly Demand 1152
AXIS BankMonthly Demand 1152
AXIS BankWeekly Demand DMIP 1156
AXIS BankWeekly Demand DMIP 1156
Time BNF Trade above 51200 Strong Confirmation Long
Weekly Demand Momentum Impulsive Patterns WDIMP
Daily Demand Momentum Impulsive Patterns DMIPS
ENTRY -1 1156
SL 1123
RISK 33
Taget as per Entry 1842
Points to Gain 343
Latest Last Swing High 1339
Latest Last Swing Low 996
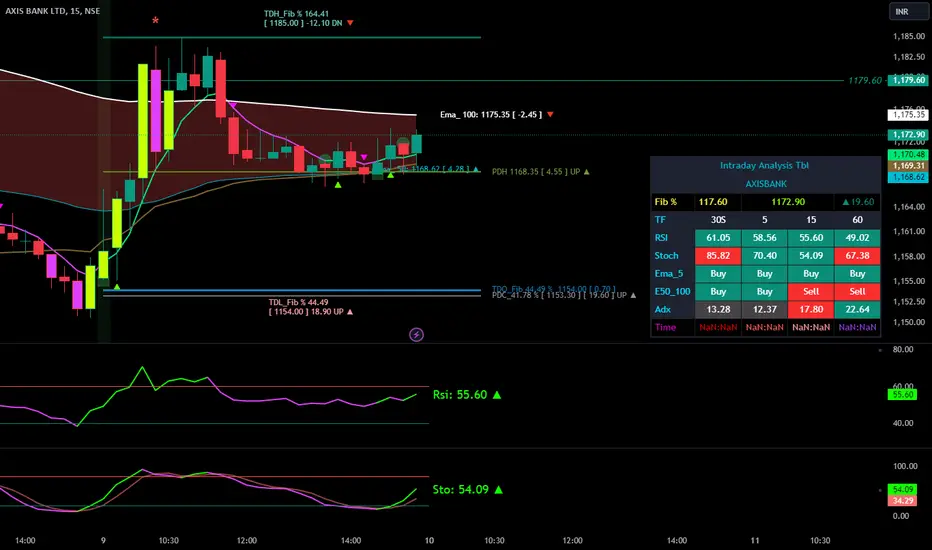
AXISBANK - Buy on DipNSE:AXISBANK
Axix Bank Looking Solid & Can Buy!
Today's Move Clearly Shown by Intraday Trend Analysis & Supported By RSI & Stochastic
It now Buy Buy Buy !
Buy On Dip
Today High & Low is Important to Maintain its uptrend
Any Dip Near Today's Low Can Be Good Opportunity to Go Long !
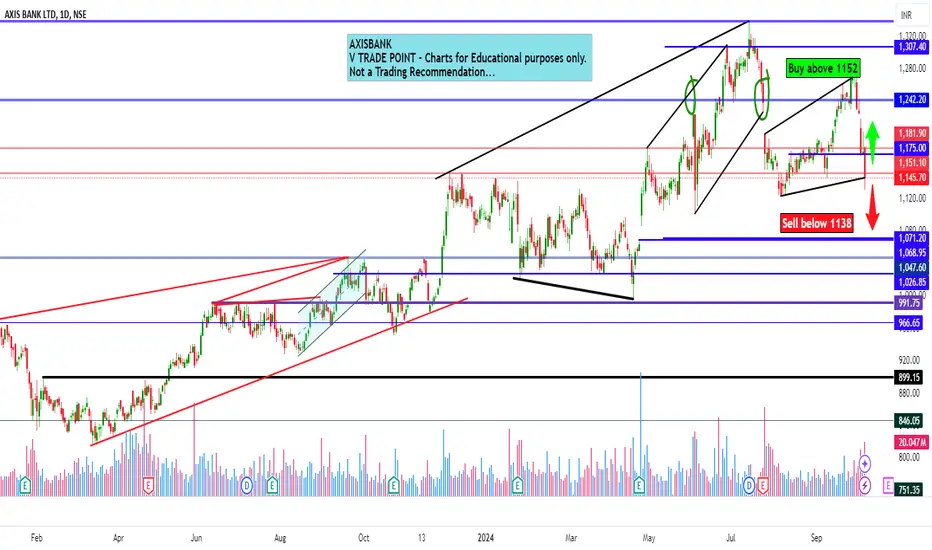
Axis Bank Ltd view for Intraday 8th October #AXISBANK Axis Bank Ltd view for Intraday 8th October #AXISBANK
Buying may witness above 1152
Support area 1138-1140. Below ignoring buying momentum for intraday
Selling may witness below 1138
Resistance area 1150-1152
Above ignoring selling momentum for intraday
Charts for Educational purposes only.
Please follow strict stop loss and risk reward if you follow the level.
Thanks,
V Trade Point
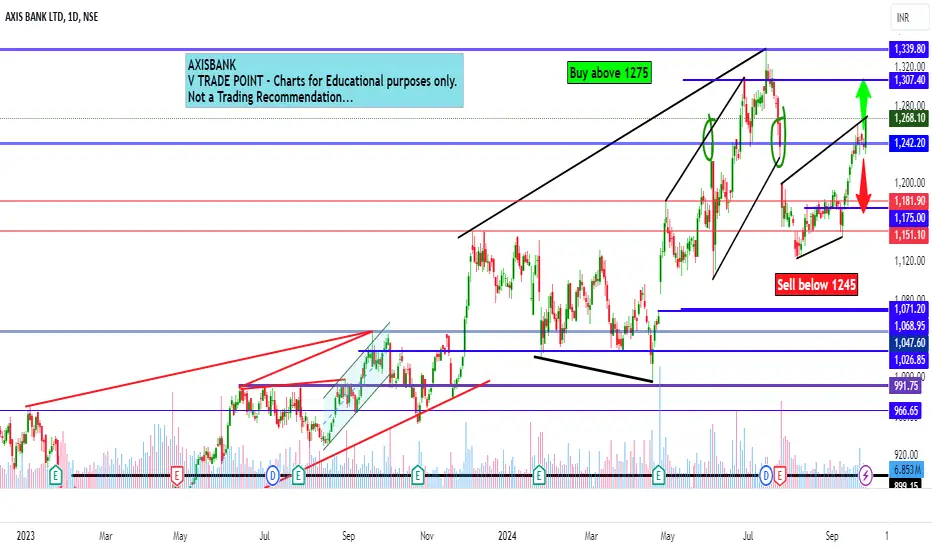
Axis Bank Ltd view for Intraday 26th September #AXISBANK Axis Bank Ltd view for Intraday 26th September #AXISBANK
Buying may witness above 1275
Support area 1260. Below ignoring buying momentum for intraday
Selling may witness below 1245
Resistance area 1260
Above ignoring selling momentum for intraday
Charts for Educational purposes only.
Please follow strict stop loss and risk reward if you follow the level.
Thanks,
V Trade Point
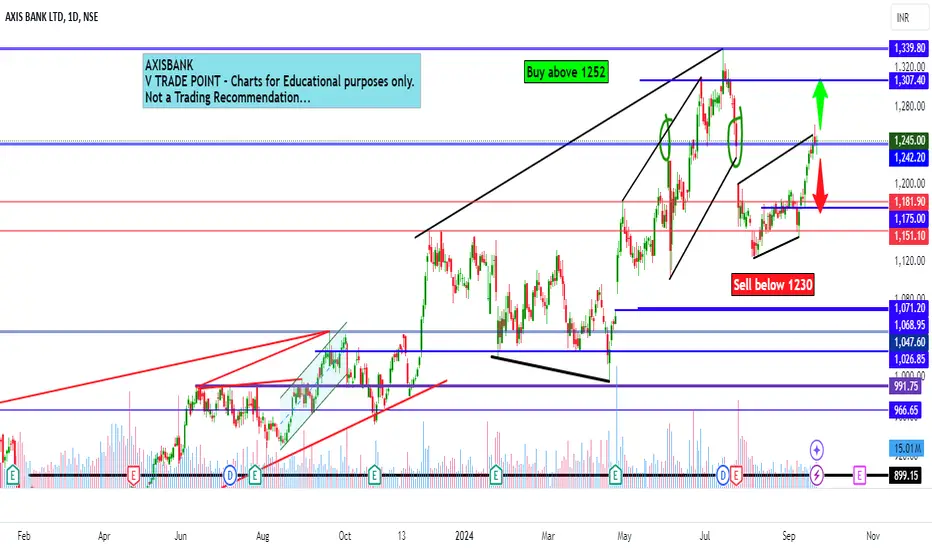
Axis Bank Ltd view for Intraday 23rd September #AXISBANK Axis Bank Ltd view for Intraday 23rd September #AXISBANK
Buying may witness above 1252
Support area 1230. Below ignoring buying momentum for intraday
Selling may witness below 1230
Resistance area 1250
Above ignoring selling momentum for intraday
Charts for Educational purposes only.
Please follow strict stop loss and risk reward if you follow the level.
Thanks,
V Trade Point
Axis Bank Next TargetAxis bank is showing bullish . But it's difficult to take trading decision now.

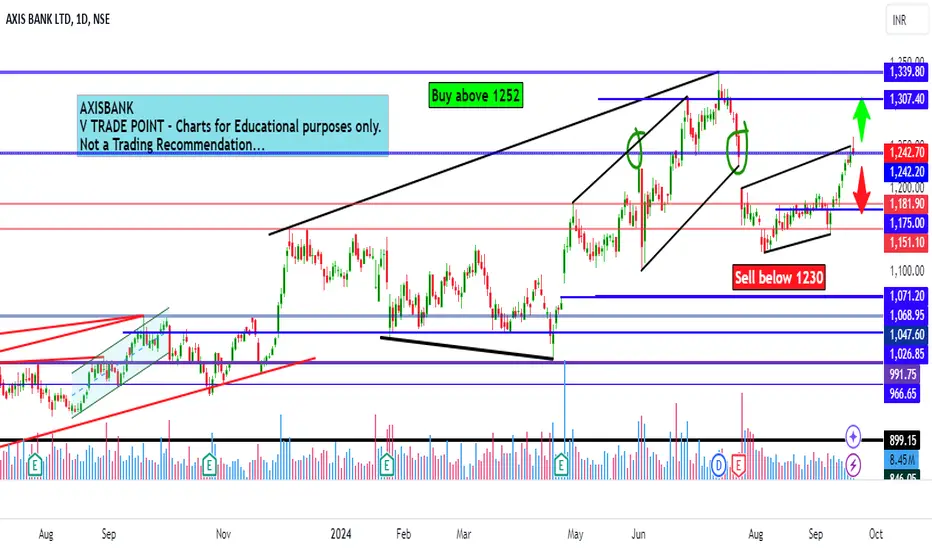
Axis Bank Ltd view for Intraday 20th September #AXISBANKAxis Bank Ltd view for Intraday 20th September #AXISBANK
Buying may witness above 1252
Support area 1230. Below ignoring buying momentum for intraday
Selling may witness below 1230
Resistance area 1250-1252
Above ignoring selling momentum for intraday
Charts for Educational purposes only.
Please follow strict stop loss and risk reward if you follow the level.
Thanks,
V Trade Point
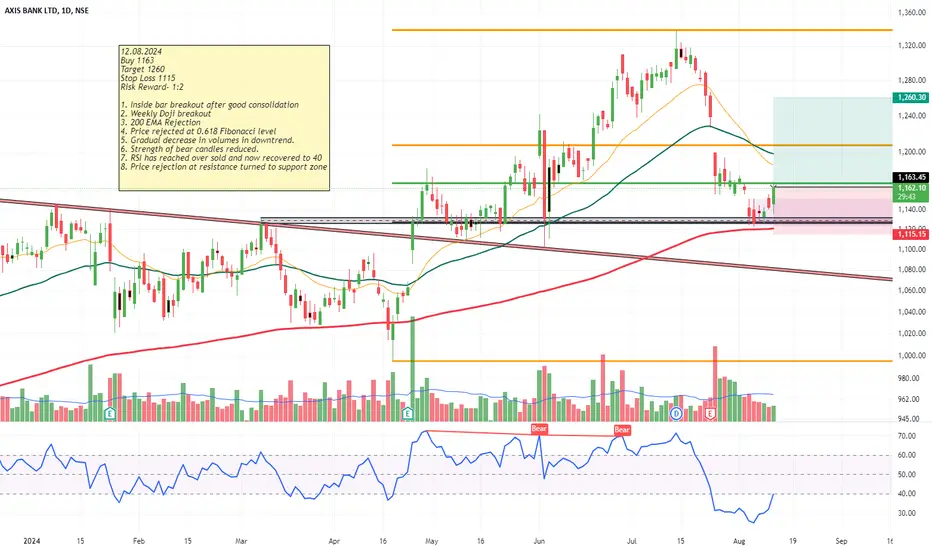
Axis Bank-Bullish Swing- Strong Supply zone!!
12.08.2024
Buy 1163
Target 1260
Stop Loss 1115
Risk Reward- 1:2
1. Inside bar breakout after good consolidation
2. Weekly Doji breakout
3. 200 EMA Rejection
4. Price rejected at 0.618 Fibonacci level
5. Gradual decrease in volumes in downtrend.
6. Strength of bear candles reduced.
7. RSI has reached over sold and now recovered to 40
8. Price rejection at resistance turned to support zone
NSE:AXISBANK
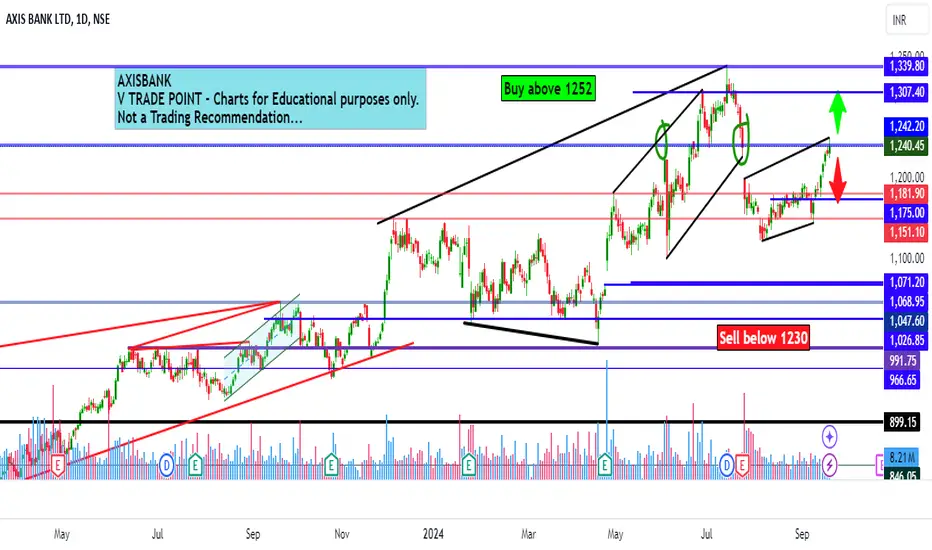
Axis Bank Ltd view for Intraday 19th September #AXISBANK Axis Bank Ltd view for Intraday 19th September #AXISBANK
Buying may witness above 1252
Support area 1230. Below ignoring buying momentum for intraday
Selling may witness below 1230
Resistance area 1250-1252
Above ignoring selling momentum for intraday
Charts for Educational purposes only.
Please follow strict stop loss and risk reward if you follow the level.
Thanks,
V Trade Point
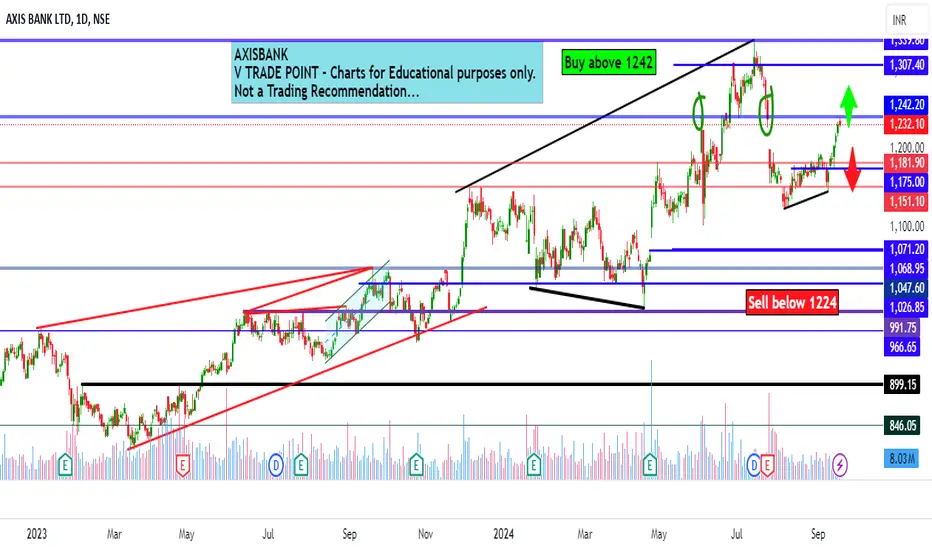
Axis Bank Ltd view for Intraday 18th September #AXISBANK Axis Bank Ltd view for Intraday 18th September #AXISBANK
Buying may witness above 1242
Support area 1223-1225. Below ignoring buying momentum for intraday
Selling may witness below 1224
Resistance area 1240-1242
Above ignoring selling momentum for intraday
Charts for Educational purposes only.
Please follow strict stop loss and risk reward if you follow the level.
Thanks,
V Trade Point