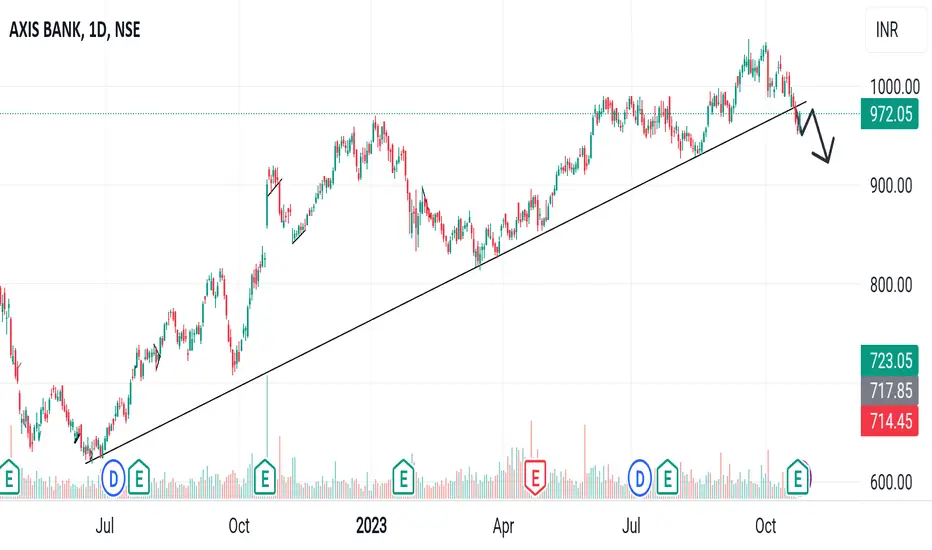
Axisbank📢 Trendline broken stock📢
These are swing ideas which you can add your watchlist and analysis for yourself !
Keep on your radar 📡
This content only education purpose!
❗I am not sebi ragister❗
UZC trade ideas
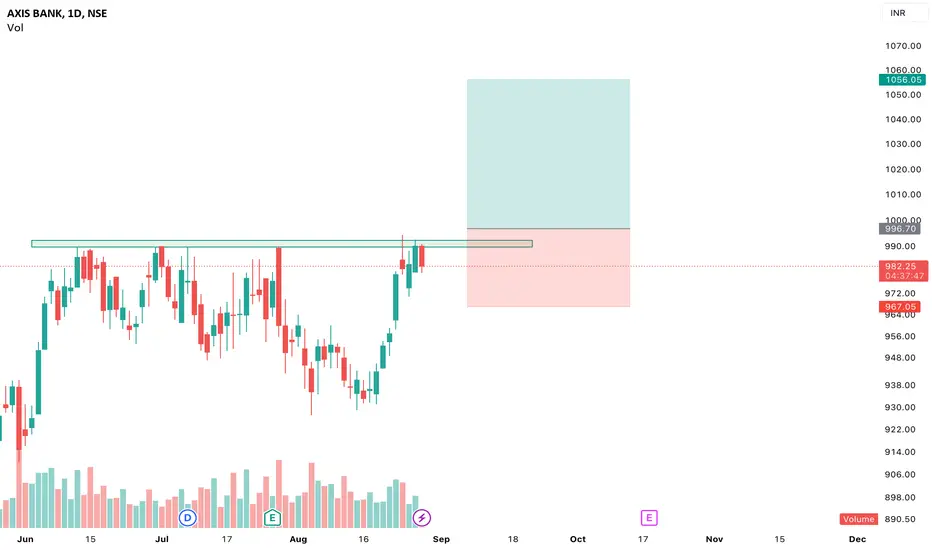
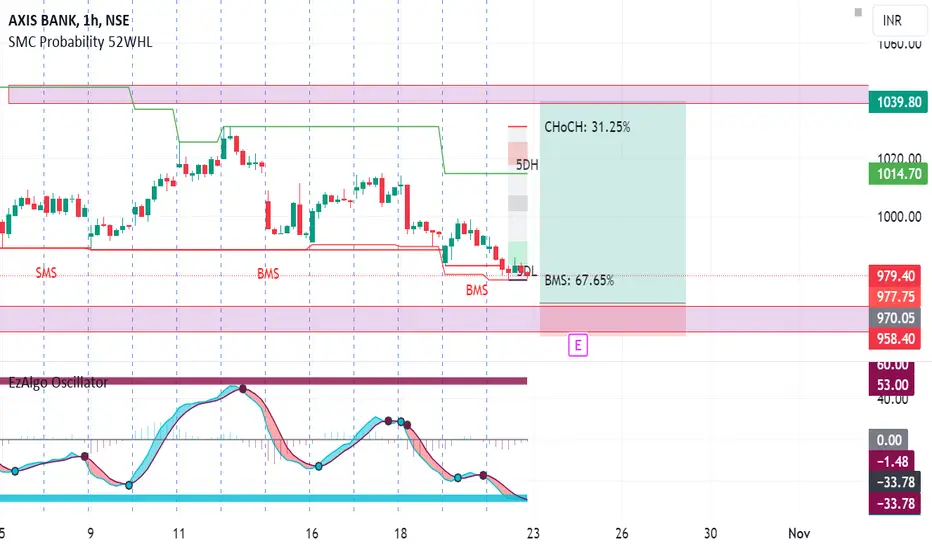
AXIS BANKStocks trading near 5 day Low & 1H POI, its strong Support Zone , indicating a possible breakout
I am not SEBI register Advisor and I am not any trade and tips recommend here, This Idea post on this Channel Only for educational knowledge & learning purpose, I am not provide any trading tips, Before any Trade Advice your Financial Advisor, I am not responsible any profit and loss
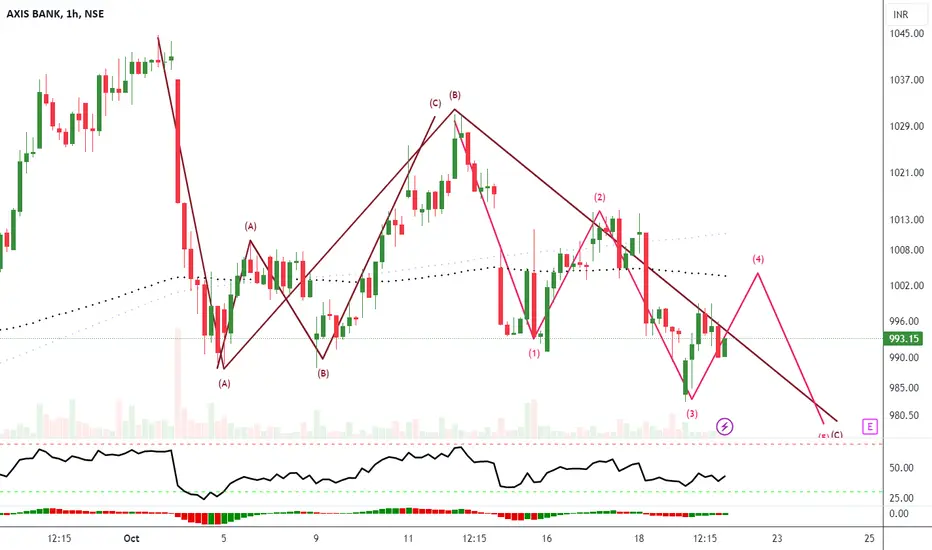
Axis bank elliot wave analysisAxis bank elliot wave analysis one hour chart
price down side complete Wave A or Wave B complete upside internal wave a,b,c or Wave C downside move 1,2,3,4,5
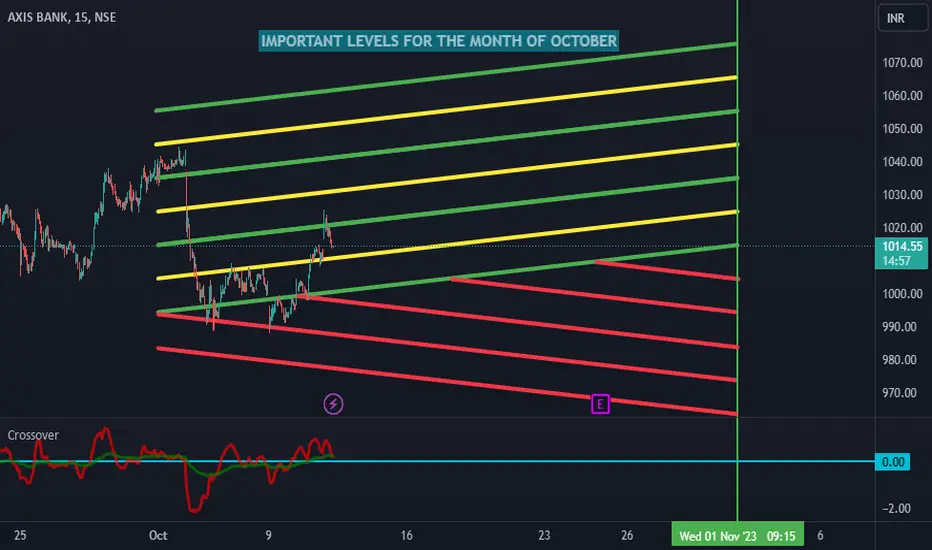
INTRADAY & POSITIONAL LEVELS FOR OCT 23NSE:AXISBANK BSE:AXIS1! NSE:AXISBANK1!
All the Marked levels are valid for the month of October 2023.
Levels marked in green and yellow colour represent the area in which bullish movement is expected.
Levels marked in red colour represent the area where all the bearish movement is expected.
I am expecting bullish / Upside movement from the lower levels .
If in case all levels gets exhausted either on the up side or down side, i will update .
Use these levels with your existing strategy and try to go short or long near or at the levels so that your stoploss can be minimized.
All the best folks.
Axis bank looking weak 955 1st LEVEL to watch on downside On Our Harmonic pattern indicator based trade setup take trade as explained below :-
Early trades Buy or sell below/ above 23.6 %, safe trades buy or sell above / below 41% , after taking trade next upside or downside levels will be target ,
When reverse buy or sell signal appear then book profit on Target or trail SL to 23.6 % If trailing SL hit then early trade can be taken above or below 23.6 and safe trade can b taken above/ below 41% ..
Please note:-
It's working on news based and volitile market very well so exit if SL hit

Axisbank more upside pending buying recommended at 1002On Our Harmonic pattern indicator based trade setup take trade as explained below :-
Early trades Buy or sell below/ above 23.6 %, safe trades buy or sell above / below 41% , after taking trade next upside or downside levels will be target ,
When reverse buy or sell signal appear then book profit on Target or trail SL to 23.6 % If trailing SL hit then early trade can be taken above or below 23.6 and safe trade can b taken above/ below 41% ..
Please note:-
It's working on news based and volitile market very well so exit if SL hit

Axis Bank trying to break Upside resistance On Our Harmonic pattern indicator based trade setup take trade as explained below :-
Early trades Buy or sell below/ above 23.6 %, safe trades buy or sell above / below 41% , after taking trade next upside or downside levels will be target ,
When reverse buy or sell signal appear then book profit on Target or trail SL to 23.6 % If trailing SL hit then early trade can be taken above or below 23.6 and safe trade can b taken above/ below 41% ..
Please note:-
It's working on news based and volitile market very well so exit if SL hit

Axis Bank - Can we short it for profit?
If Nifty close in red tomorrow, Axis bank can be short trade to make 4-5% in a week or less.

Axis Bank looks weekAxis bank overall looks weak, with strong sellers, as bank nifty also weak, we would get a good opportunity on the down side, do track it

Axis Elliot Wave Analysis Axis Bank break impulsse wave 2 0r 4 trend this line indcate price direction change
. my view this stock create a top

AXIS BNK LOOKING WEAKAxis Bank at its resistence level which is from year 2015, if axis is reverse from here expecting a decent 20% downside, so waiting for a reversal.
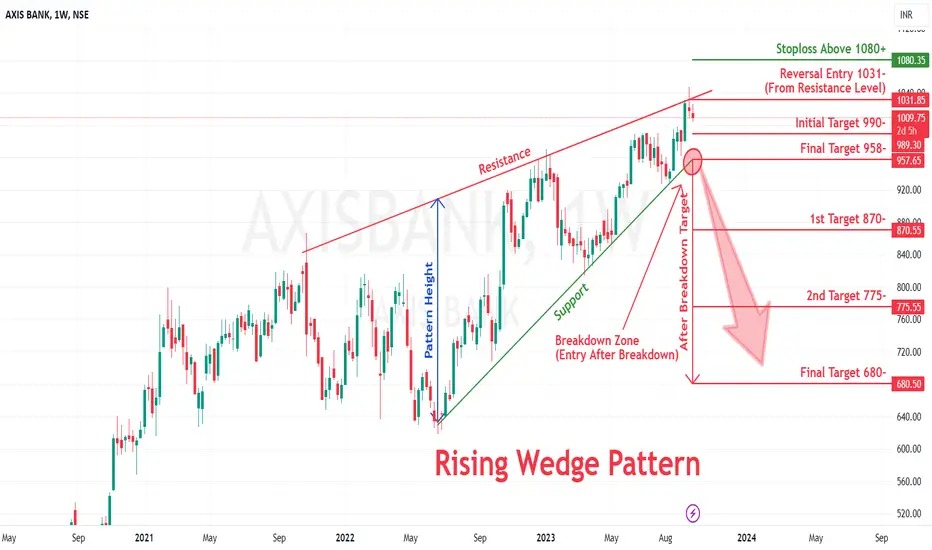
Reversal Rising Wedge pattern in AXISBANKAXIS BANK LTD
Key highlights: 💡⚡
📈 On 1week Time Frame Stock Showing Reversal of Rising Wedge Pattern.
📈 It can give movement upto the Reversal Final target of Below 958-.
📈 There have chances of breakdown of Resistance level too.
📈 After breakdown of Resistance level this stock can gives strong downside rally upto below 680-.
📈 Can Go short in this stock by placing a stop loss Above 1080+.
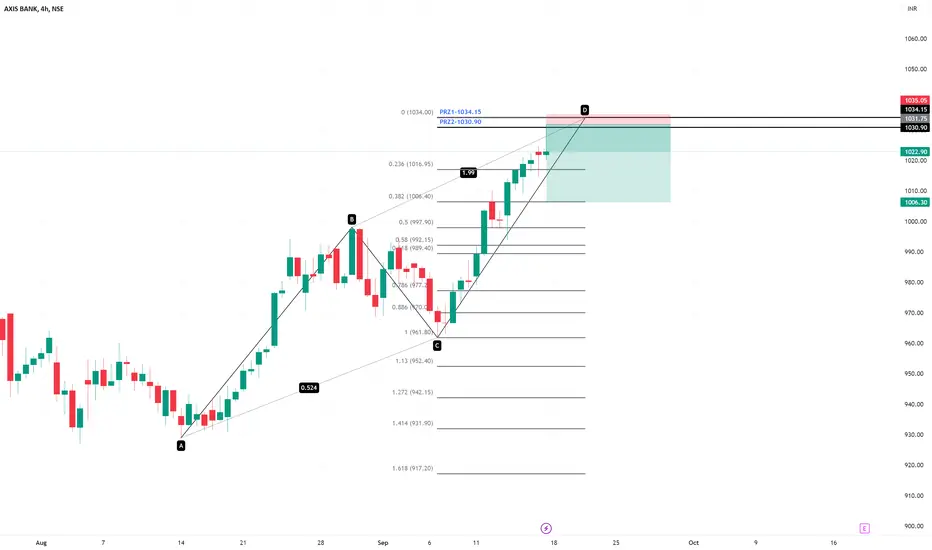
Axis Bank,Harmonic ABCD pattern=> In 4HTF,ABCD pattern hits the prize reversal zone.
=> 0.382 level from C to D retracement is the first target
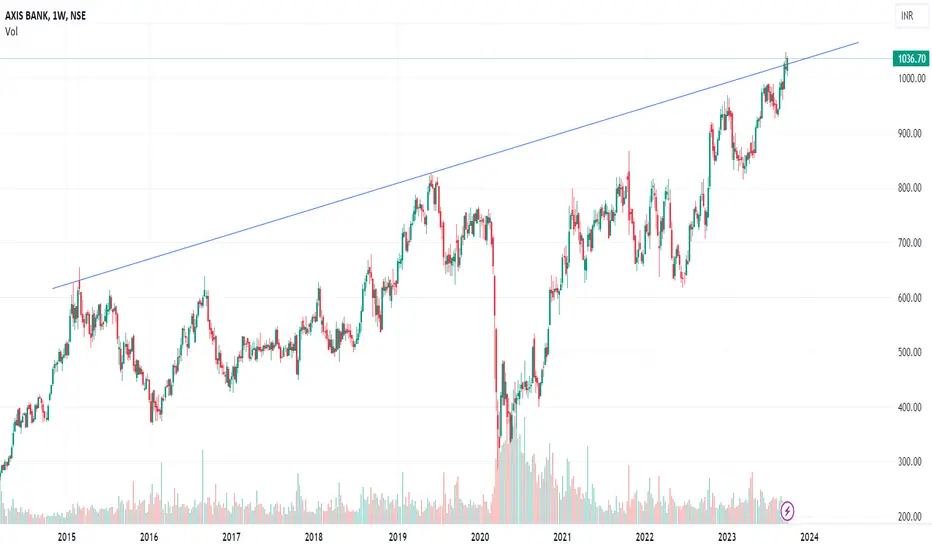
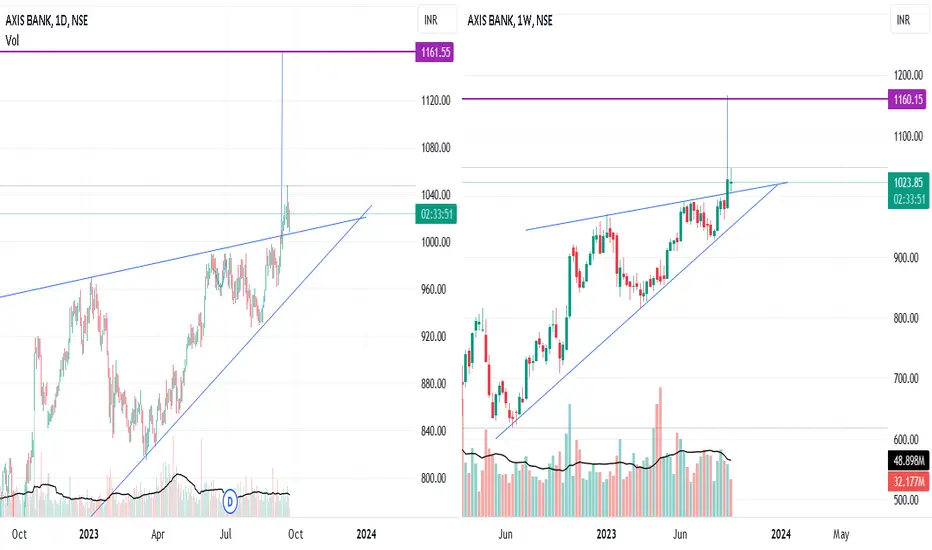
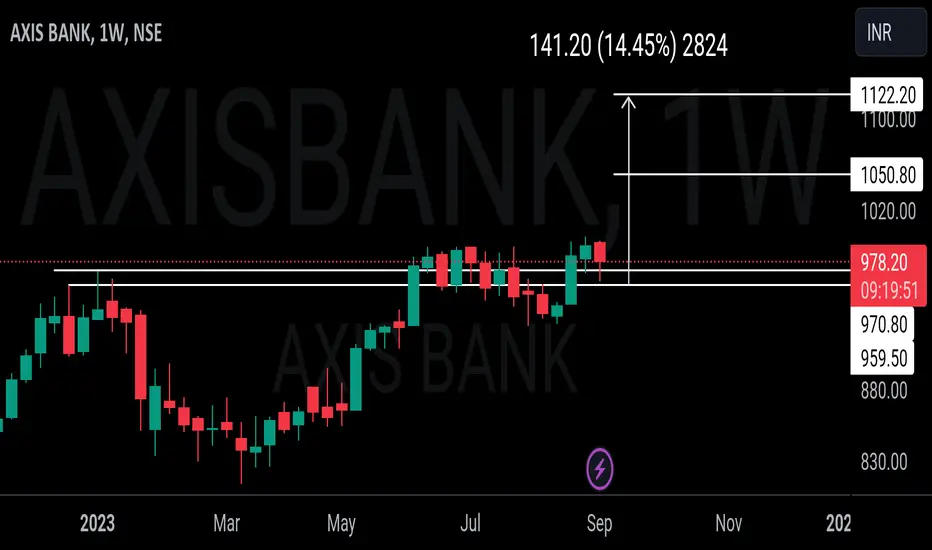
Axis Bank Tringle Breakout on Daily and Weekly Time FrameAxis Bank has breakout on Daily and Weekly Time Frame. My target 1160 but taking conservatively 1120 by Oct 2023.
Note: This is for educational Purpose, i have Axis Bank in my portfolio and there is a high chance my analysis is biased.
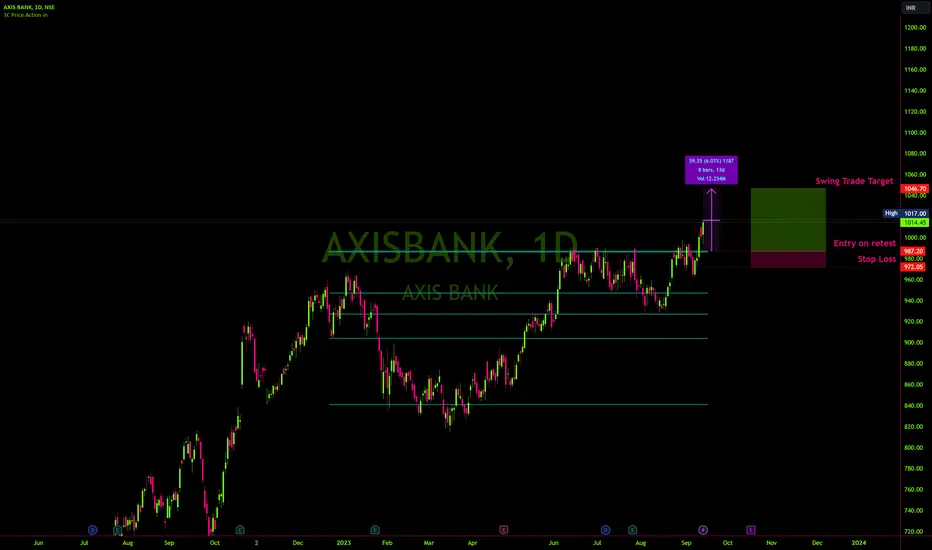
axis bankaxis bank is at a good breakout it has given a retest after the previous breakout and now it's set for new highs The shortest target would be 1116 with the top loss of 987 looking good right now and the banking sector is at a great index price
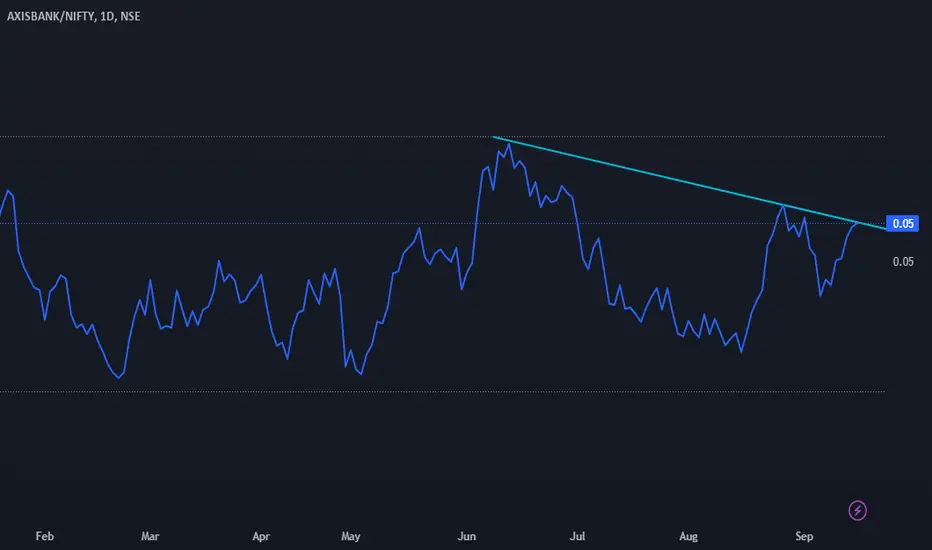
Axis BankIt seems on verge of breakout in ratio chart. One may plan long here with proper SL in system
AXIS BANK AXIS BANK Chart Analysis
last week given a breakout .. Upside targets given.
***I am not SEBI Registered. All my charts and analysis are only for educational purpose not for trading purpose.
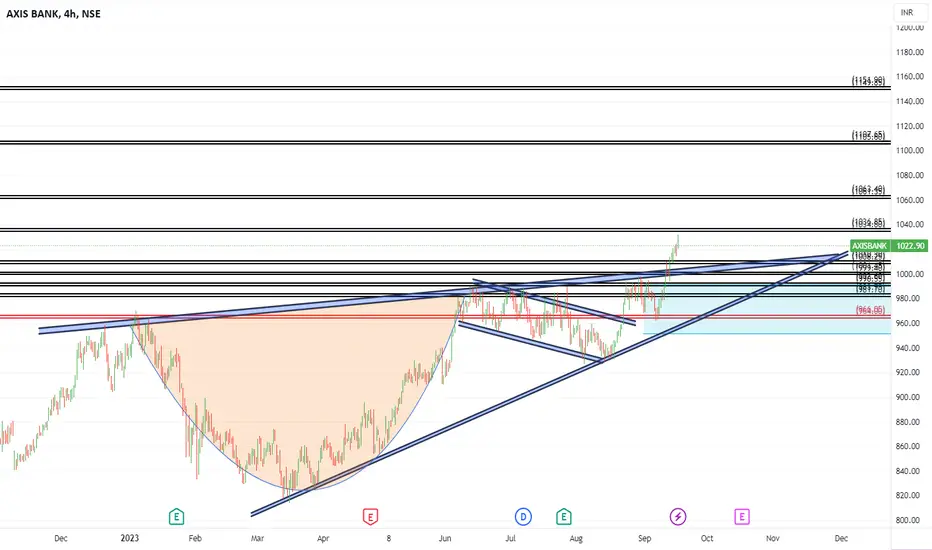

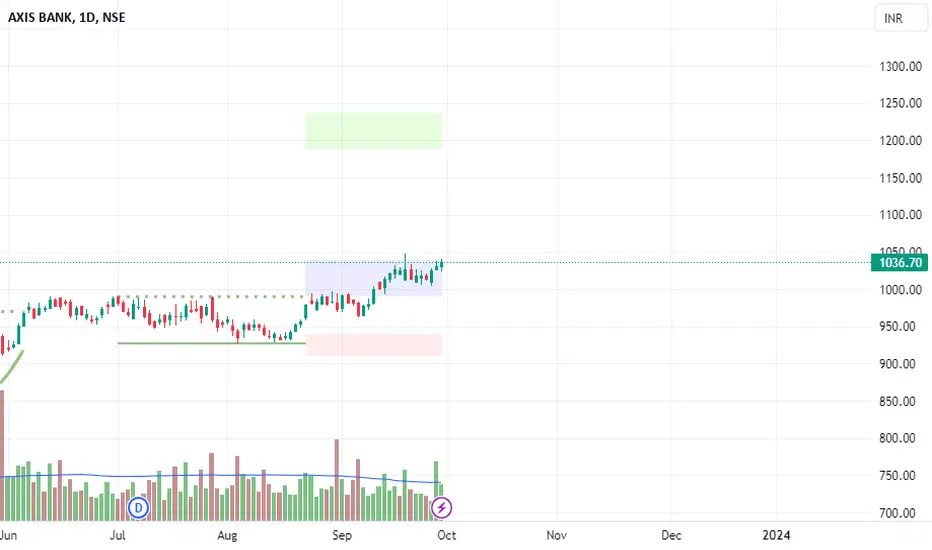
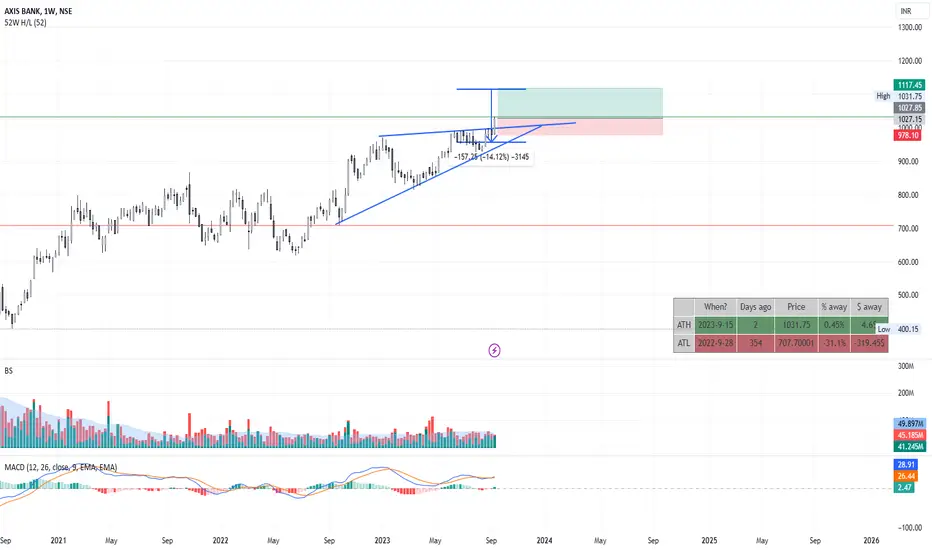
Axis Bank Swing Trade SetupAxis Bank is trading at its 52-week high and all-time high. There is no resistance on the upper side. Volume is increasing.
The relative strength index is above 60 daily, weekly and monthly.
The cup and handle pattern is visible.
If the prices retest the neck level, 987 - 985, it would be a good entry-level with a target level 1045. We can achieve a 4 risk-to-reward ratio if the trade goes positive.
Even after stretching the stop order below the previous swing low, the risk-reward ratio would be more than 2.
Stop loss can also be trailed as the price moves upward.
Axis Bank Looks Bullish 💪The Axis Bank looks perfect break out & retest and sustain at current market price.
It's Technical Analysis show's Cup & handle break out retest & sustain at the support 💪.
AXIS BANK 🏦 LONGStock ready for Breakout with good volume.Price above the DEMA,
20DEMA is major support & S.L zone.Setup is ready for long.
Rsi Bullish
MACD Bullish
Disclaimer:- This is my personal view for education purpose only.
No Buy sell recommendations give by me.