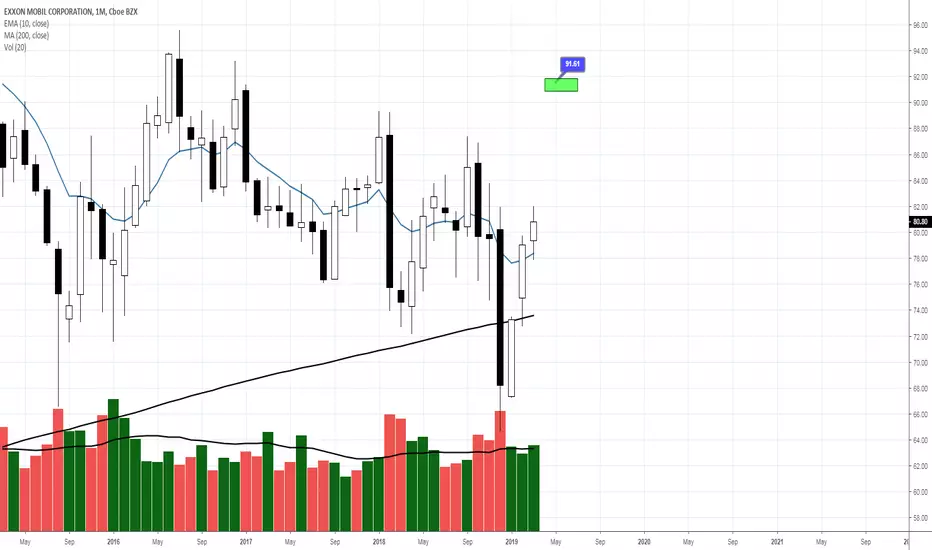
EXXON to continue a strong 20191. Exxon Mobil recently bounced back from a 30 year low - indicating we have seen the bottom so the stock is relatively cheap compared to its all time high.
2. Exxon Mobil plan to push hard in the U.S. onshore market. With a goal of 55 rigs from 48 by the end of 2019 - this is a very large number especially as smaller drillers are actually reducing their number of rigs.
3. For over 30 years Exxon Mobil has delivered annual boosts to it quarterly payout (last year's was a 6.5% rise) and with production recovering, there is a good chance the payout could keep increasing.
Like our ideas? Check out our site at: insidebitcoins.com
XONA trade ideas


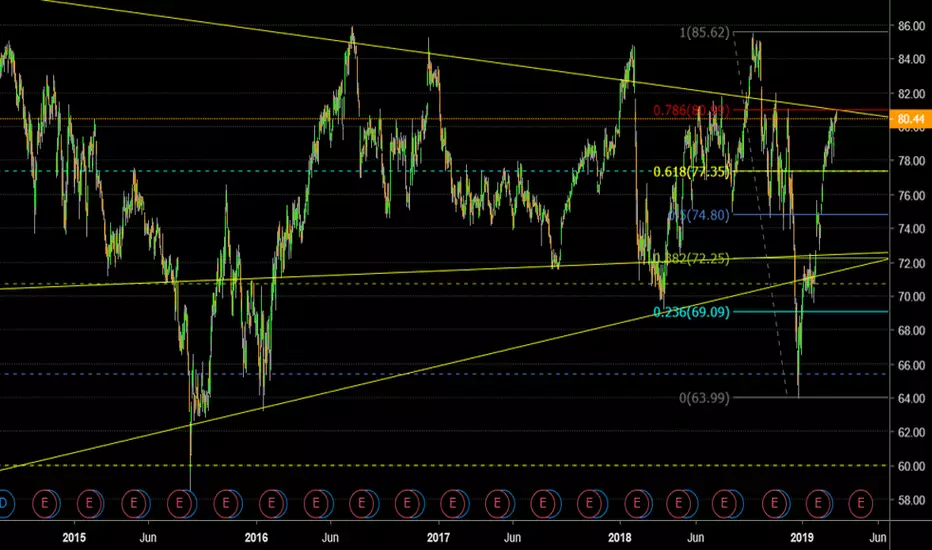
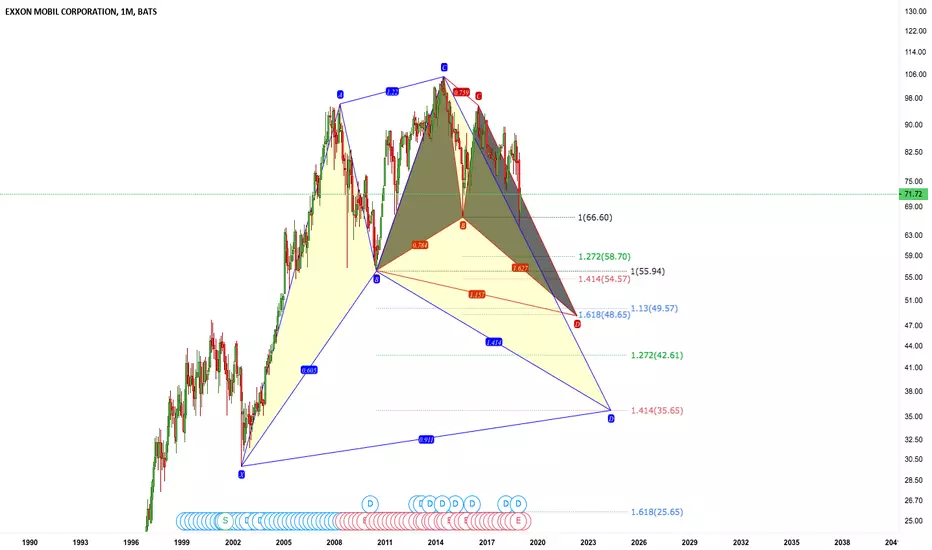
XOM short : back to the supportXOM has been tackled by Morgan Stanley (versus Chevron), I claim the stock will go down to its las support

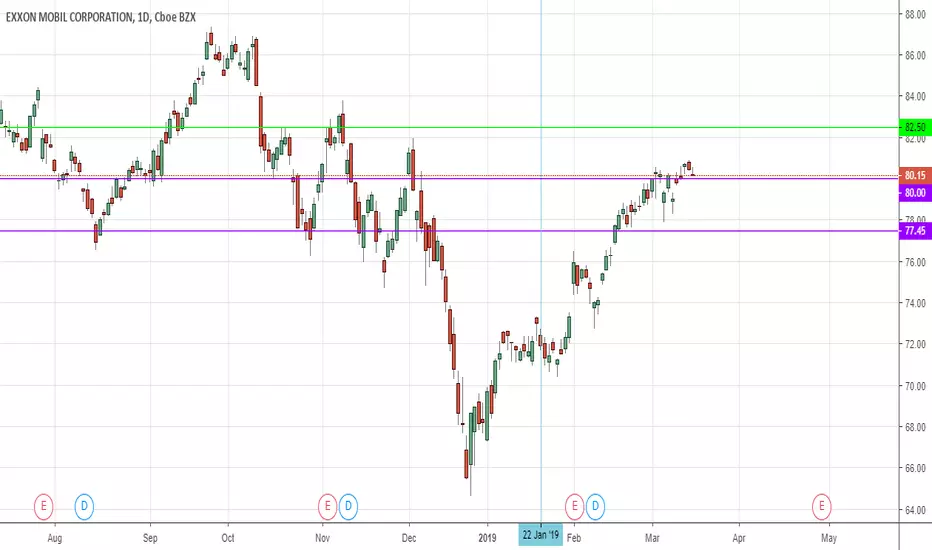
$XOM C&H Breakout / Golden Cross$XOM C&H Breakout / Golden Cross. Looking for a close above $82.00 for confirmation. Note upcoming ER late April.
See chart for possible near term targets.
Note: Informational, not investment advice.


Dividend Capture Strategy for easy cash flowDividend Capture strategy for easy cash flow on XOM
Exxon Mobil pays .82 per share quarterly and the ex-dividend date is this Friday (2/8/2019) the dividend pay date is on 3/11/19. So yearly Will get $3.28 (.82x4)for a dividend yield of 4.4% not bad.
But by selling the ATM Put for $1.02 I will increase the premium plus dividend paid for the year to $4.30 and increase the yield to 5.77%. That alone is an improvement of 31%.
If I don't get assigned I get to keep the premium and make over $500 in a couple of days and if I do get assigned then I will sell some calls to keep reducing my basis and improve my yield even more.
The Trade: XOM
Sold 5 ATM Puts @ 74.5 for $1.02
4 days to expiration

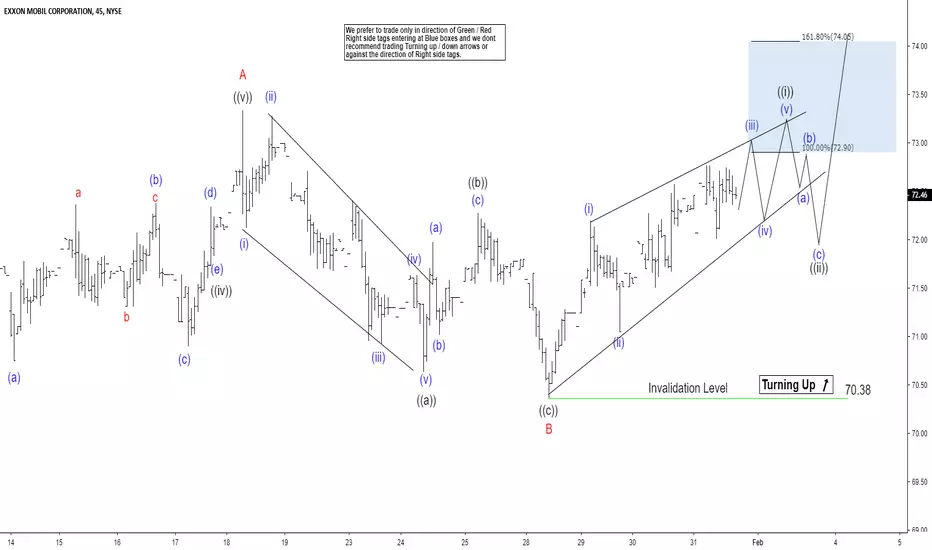
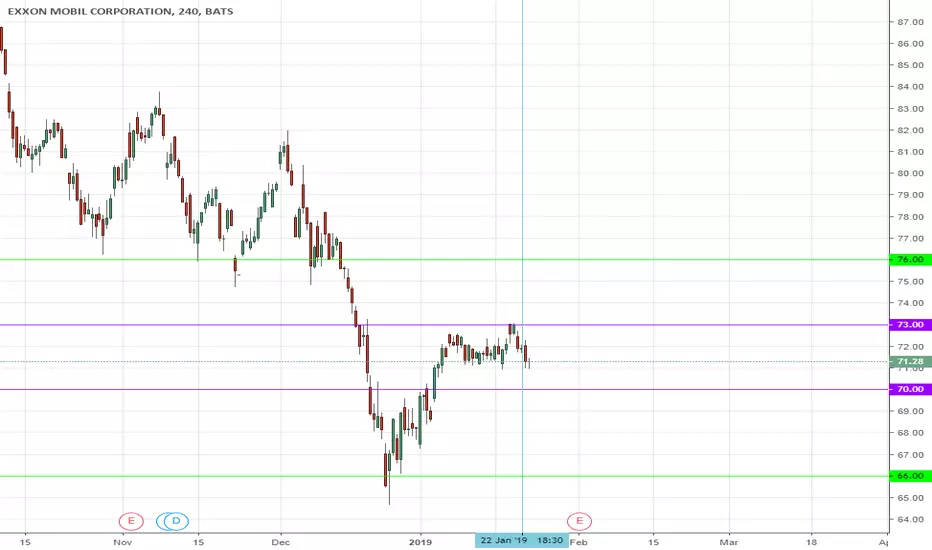
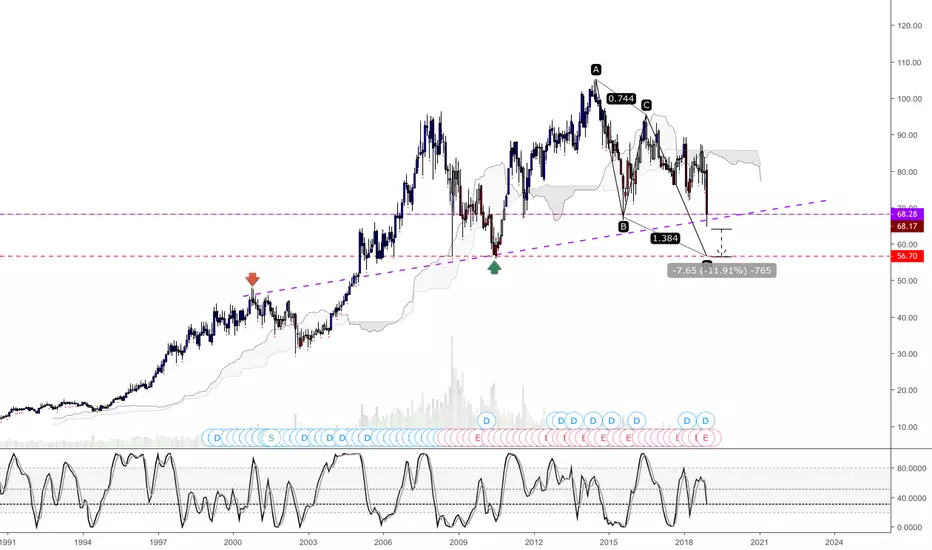
Elliott Wave View Expects Exxon Mobil To RallyElliott Wave view in Exxon Mobil (ticker: XOM) suggests that the rally from December 26, 2018 low ($64.65) is unfolding as Elliott Wave zigzag. The first leg of the zigzag ended at $73.33 on January 18, 2019 high as wave A. A zigzag is a 5-3-5 structure and wave A should unfold in 5 waves in impulse or diagonal. We can see in the chart below that wave ((iii)) of A ended at $73, wave ((iv)) of A ended at $71.95, and wave ((v)) of A ended at $73.33.
The stock then pullback in wave B with the internal as a zigzag Elliott Wave structure as well. Down from $73.33, wave ((a)) ended at $70.64, wave ((b)) ended at $72.27, and wave ((c)) ended at $70.37. Wave C rally has started and the stock is expected to break above wave A at $73 and could see as high as $79 when wave A = C. To gain confirmation for this view, the stock still needs to break above $73. Otherwise, technically we still can’t rule out a double correction in wave B. Near term, while pullback stays above $73.33, expect Exxon Mobil to extend higher.
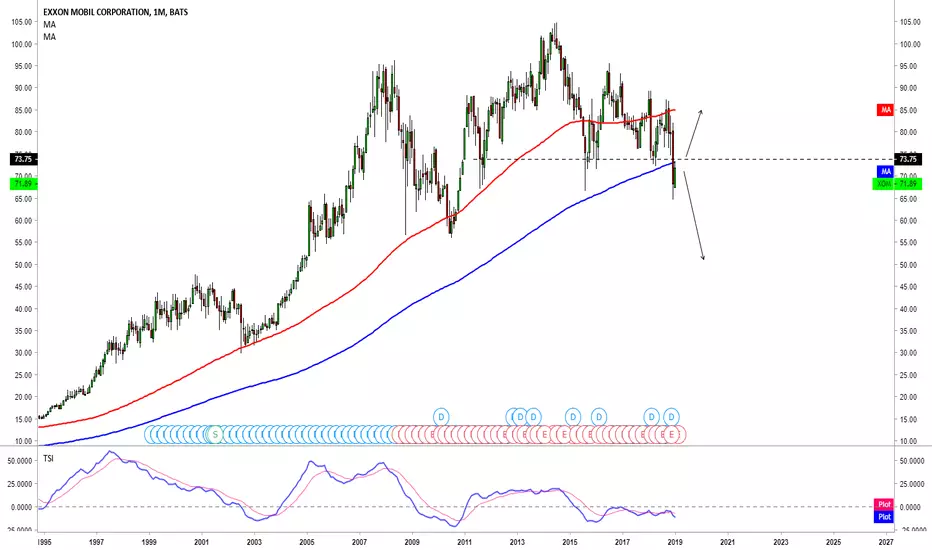
A huge short opportunity if resistance fail $XOM$XOM has retraced some of it's loses but is facing a strong upside resistance, downside support Rejection from here is opening a huge profit space.
XOM BUY (EXXON MOBIL CORPORATION)Hi there. Price is forming a continuation pattern to the upside. Wait for the price to hit the bottom of the pattern and watch strong price action for buy.

EXXON MOBIL CORPORATION (XOM): A Reversal Is On The Way?Find Winning Trades In Seconds >> efcindicator.com (Special Discount)
The last three candles indicate the formation of a morning star, a strong bull flag. A breakout at the pivot level (P) is required.

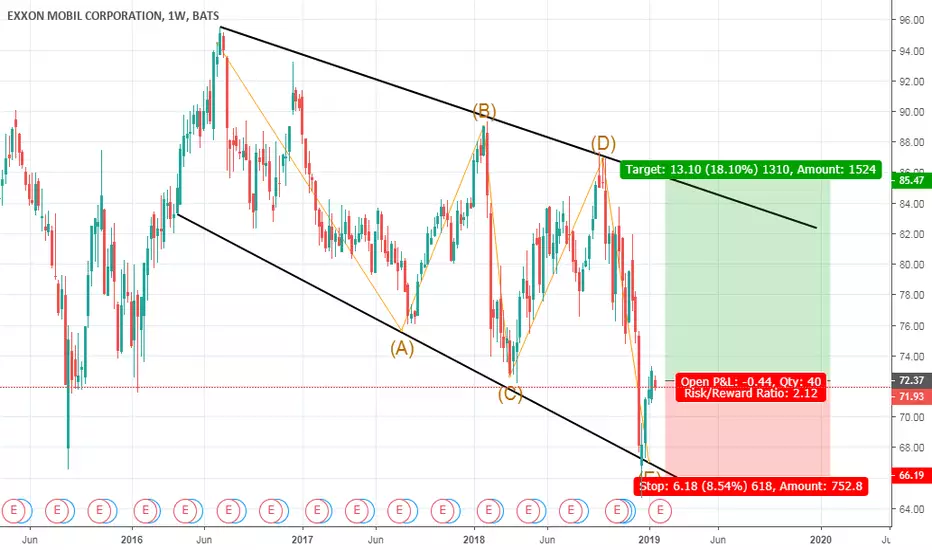
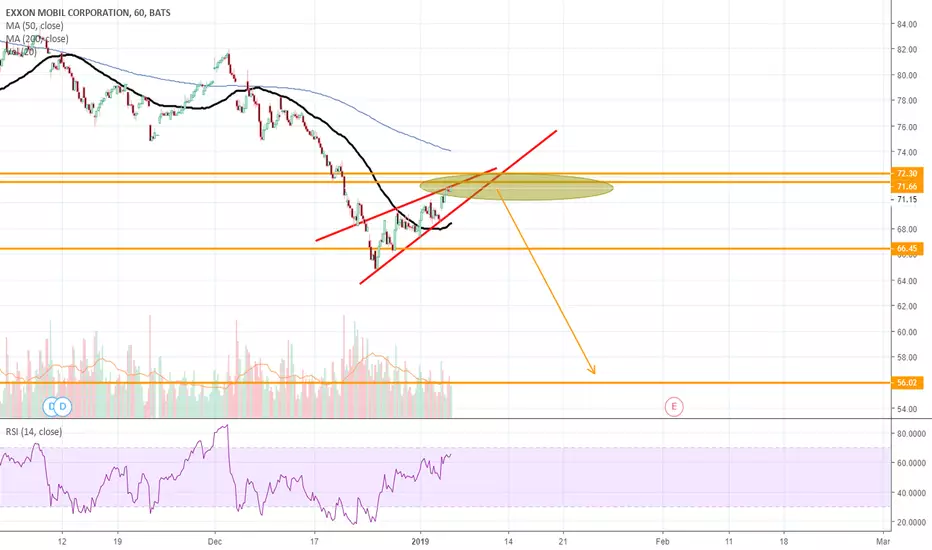
XOM RISING WEDGEAnother opportunity where the rising wedge should be touching resistance and preparing to break.
Order placed - currently unfilled
$71.65 Entry
$73.55 SL
$56.02 TP
Take Profit is fairly deep so I will be watching closely and adjusting prices accordingly.
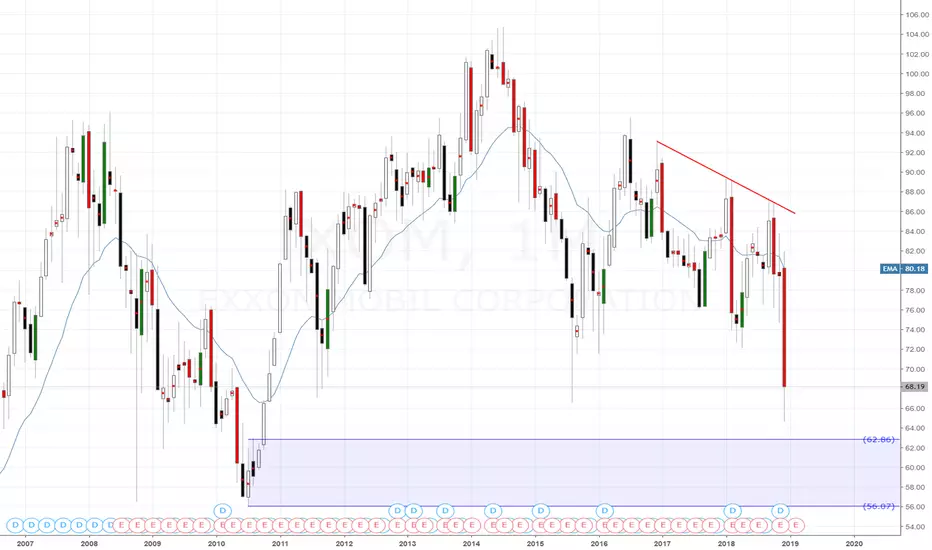
EXXON MOBIL Buy IdeaEXXON MOBIL Buy Idea @ Monthly Demand Zone (62.86 - 55.77)
Buy Limit: 63.10
Stop Loss: 55.77
Take Profit: 79.47
Risk Management = 0.01/$100
Recommended Leverage not to exceed 1:50
Recommended Risk Ratio 1:2 – 1:3
Close partially the contract once it reaches 50% of profit, Move stop loss over the entry level
Close partially the contract once it reaches 80% of the profit


EXXON MOBILE POTENTIAL BOUNCE ON THE PREVIOUS DAILY LOWXOM has broken the last support with a strong impulse. I's now reaching the previous long term support on daily. Look to the price action around this level for a potential bounce.
