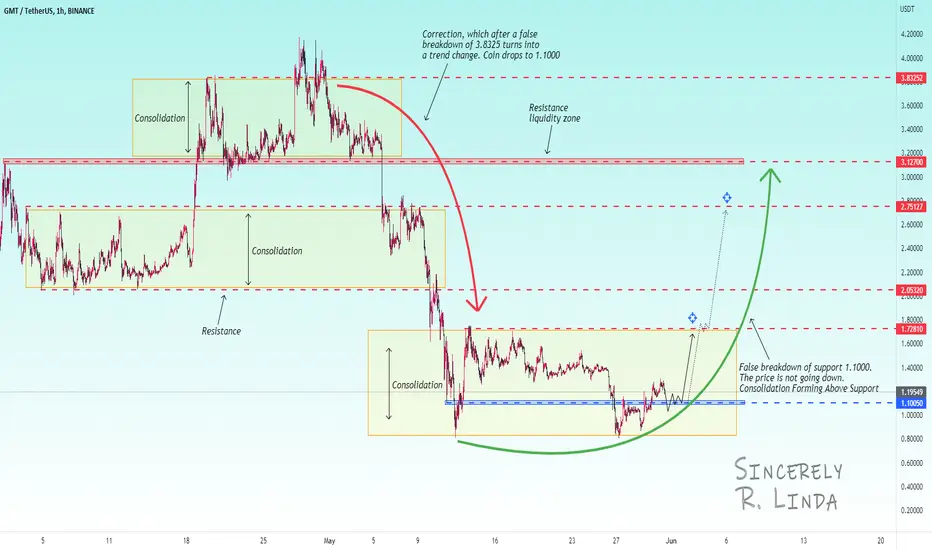
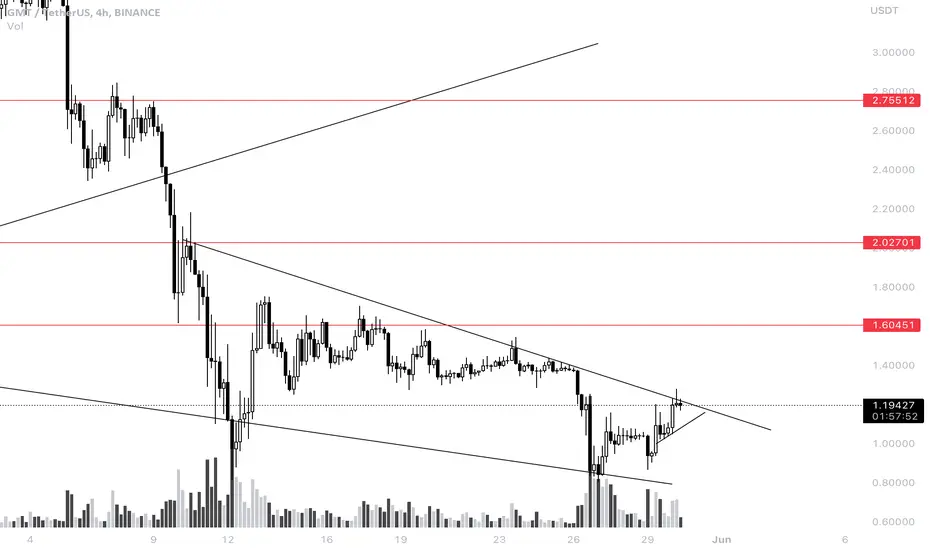
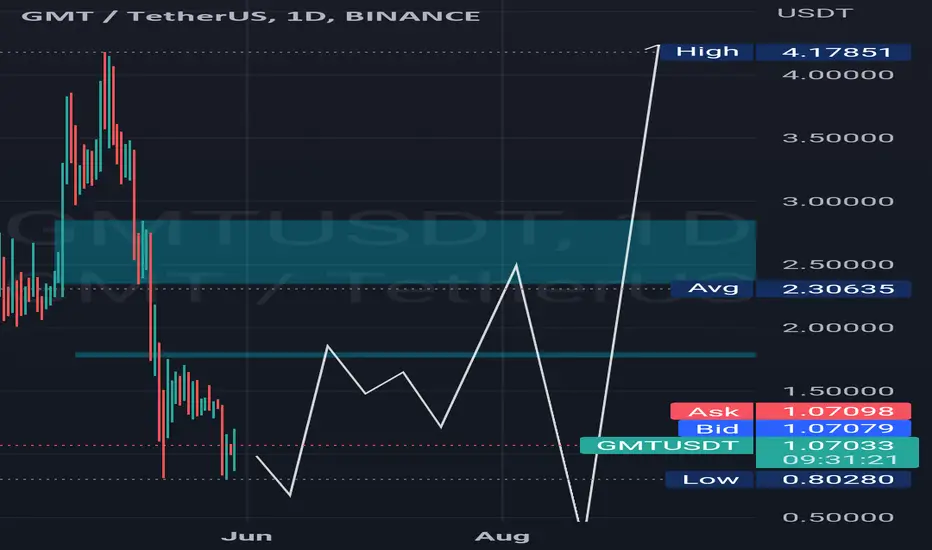
GMTUSDT ! double bottom. Will there be a change in trend?GMTUSDT in consolidation. A double bottom pattern is forming around the 0.800 support. A false breakdown of the strong support at 1.1000 was also made. The price returns beyond the level and consolidates above.
I'm guessing the price will go up. Change from a downtrend to an uptrend. The potential is great, I'm waiting for the price increase. In the short term - 1.7281. In the medium term - resistance 2.7513
Sincerely, R. Linda!
GMTUSDT trade ideas
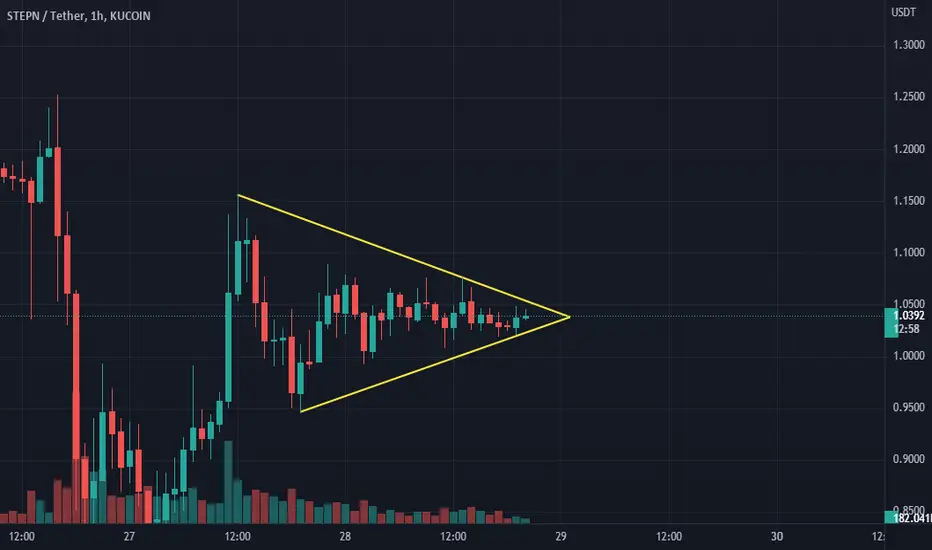
🏃GMT: you can't run away from a SCAM.📊Actually, it`s +15% after the last idea. You can read about why the STEPN fell and possible scenarios of pump or dump in this idea.
📊At the moment on the volume indicator we can see an increase in volume at every test of the bottom, which means that the coin is being bought back. Especially it can be seen on the massive sell-off when the price temporarily renew its lows (2) and the coin has already risen by 50% after that. Definitely a sign of strength.
🔶1. $1.31-1.54 is the largest zone of value, a strong resistance for the price. After the 50% growth, GMT should consolidate under this area for some time, to accumulate the strength for continued growth.
🔶2. $1.87-2.02 - the first target, a value zone, an even number. Traders who bought a $1 coin will close their longs.
🔶3. $2,53-2,77 - the second target
✅Friends, trade with stop losses, this is a must. Remember, the Chinese players, were the main players and now this market is being shut down for STEPN. Even if the volume indicator shows buying, remember what happen to LUNA!
Do you think this is a scam or should we expect a strong growth of Move-2-earn projects and STEPN will be the largest of them? Let me know in the comments!
💻Friends, press the "like"👍 button, write comments and share with your friends - it will be the best THANK YOU.
P.S. Personally, I open an entry if the price shows it according to my strategy.
Always do your analysis before making a trade.

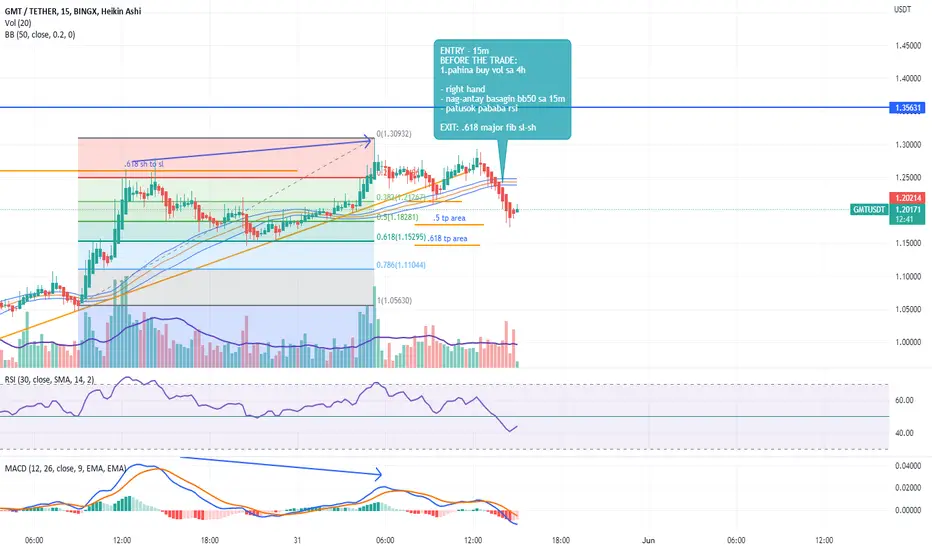
shorting $GMTwith trading buddies
ENTRY: 15m
4h weakening ng buying volume
15m ccc - antay butasin ang BB50
with buy volume dapat
exit: 43% on .5 area sa fib
Stepn (GMT)STEPN (GMT)
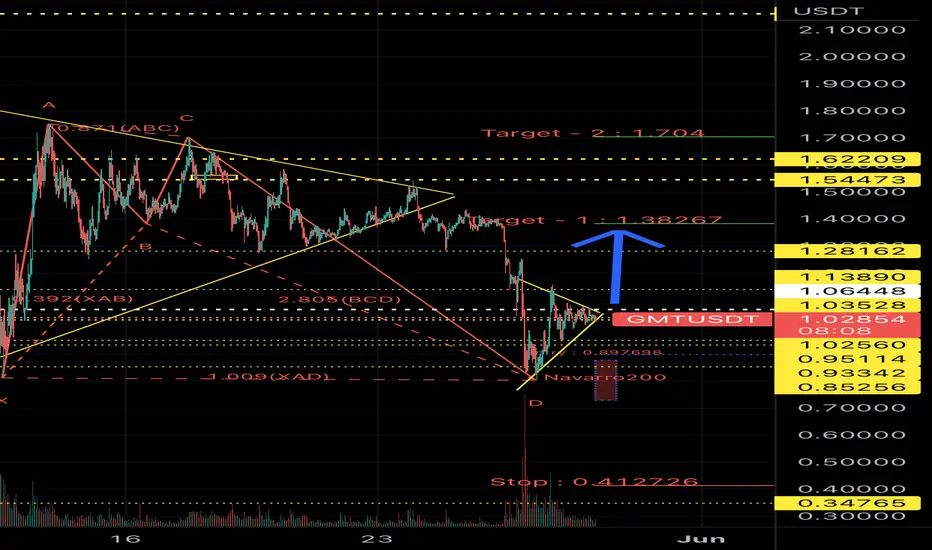
GMT a possible Leonardo Harmonic Pattern, similar to Bat Pattern but with slight difference based on fibonacci ratios.
Two possible scenario and PRZ:
● First scenario: Leonardo Harmonic Pattern (retrace at 0.786 of XA wave) + orderblock around 1.36 - 1.38, short position.
● Second scenario: Bat Harmonic Pattern with 0.886 retracement of XA wave, short position.
Please use low leverage (3-5x)

King is back! Gmt looking juicy :))There is an amazing positive divergence on daily and hourly!!
All the points are clear on the chart.
I am not sure on the last Tp but first 2 ones looking nice.
GMTUSDT Buy after break & fixation. StepNHello traders, Everything is clear on the chart for you like always.
Good luck.
If you like the idea, do not forget to support with a like and follow me for next analysis :)
Write your comment and opinion below to me
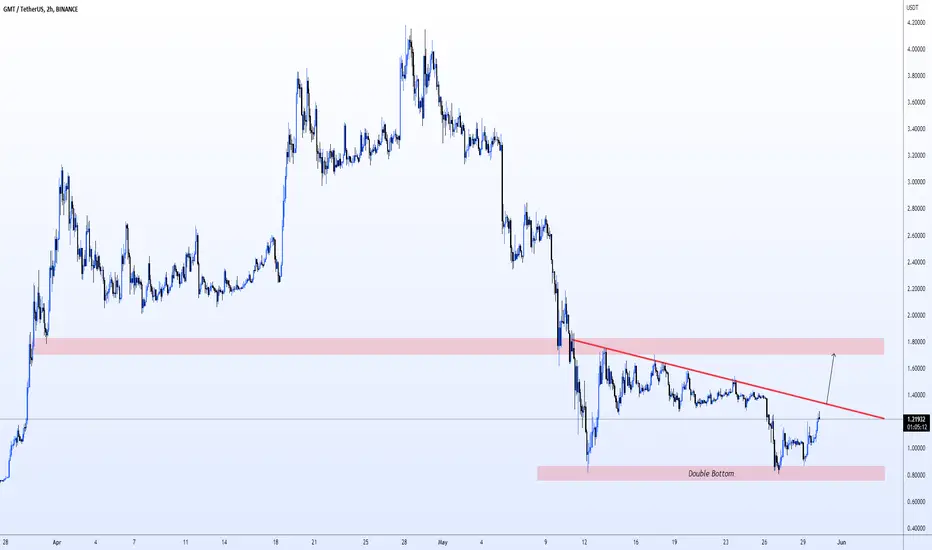
GMT : A bullish ideaGMT / H2 / Regular chart
GMT is bouncing from the double bottom support and if GMT Breaks the red downtrend line, I am expecting GMT To reach the Neckline of the double bottom pattern.
RR=2.12 buy ideadouble bottom pattern + breakout of resistance level with pullback with stong bullish engulfing, price might go up and retest 1.27 $ level and form a gartley pattern
PS : never risk more than 2% of your capital per trade

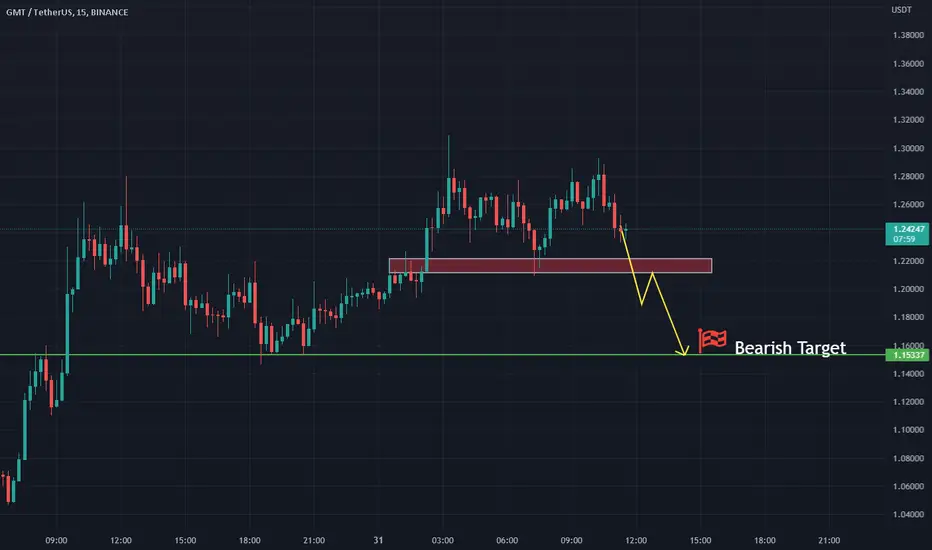
GMT/USDT: Short Term BounceMay 30 2022:
short term bounce on 30m/1H level
May wait for later chances to short
GMT may pump on short term 4H.Above 20MA, Bouncing hard at the support on 4h tf may test upwards trendline resistance.

GMT - Let's Go For A Run!Hello TradingView Family / Fellow Traders. This is Richard, as known as theSignalyst.
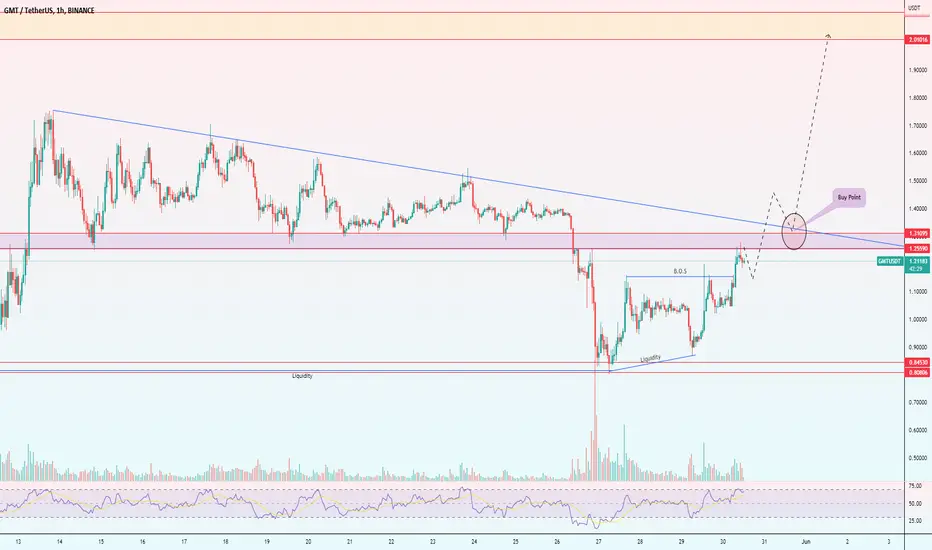
As per my last GMT analysis, we were waiting for GMT to break above 2.0 OR retest the 0.75 - 1.0 zone to look for buy setups.
Now since GMT is around our 0.75 - 1.0 demand zone , we will be looking for buy setups on lower timeframes.
on H1: GMT is forming a trendline but it is not valid yet, so we are waiting for a new swing high to form around it to consider it our trigger swing. (projection in purple)
Trigger => Waiting for that swing to form and then buy after a momentum candle close above it (gray zone)
Meanwhile, until the buy is activated, GMT would be overall bearish can still trade lower.
Which scenario do you think is more likely to happen? and Why?
Always follow your trading plan regarding entry, risk management, and trade management.
Good luck!
All Strategies Are Good; If Managed Properly!
~Rich

STEPN drawn Double Bottom pattern and price start rise soon !Hello dear traders, we here new so we ask you to support our ideas with your LIKE and COMMENT, also be free to ask any question in comments, we will try to answer for all, thank you guys.
12th May GMT token create local low at 0.85$ and bounced more than 100% to 1.75$
Few days ago price back to support level, local low at 0,85$ and now created double bottom pattern.
I think for now price can make another 100-140% upward movement to our main target around 2-2.1 USD.
And some time to trades in this range 0.85-2.1 USD
I expect this scenario, so be prepare for next movements.
Thanks for your time, we hope our work is good for you, and you are satisfied, wish you a good day and big profits.

Corrective phase beginAfter GMT create new Low, in my humble opinion it will form bigger corrective structure then make a new Low. Please look at my opinion about Chrusdt long time ago at the link below. Maybe it will form same pattern.
GMT There are 3 targets ahead👌The desired currency code, as you can see, has done the necessary analysis and is now ready for the 3 targets.
If you want to buy a currency code, now is the time to buy.
The analysis you are looking at is the specific method of the servant and the trading strategy is called the servant.

$GMT Bonuce Or DieWe Are in A Good Position Right Now I will buy it from here with Stop lose in 0.94 - 0.96
Target 1 - 1.30 $
Target 2 - 1.70$
Above 8$ For HOLD
GMT HARMONIC PATTERN As you can see gmt show a harmonic pattern on 1h timeframe. If bitcoin not volatile dump maybe its a bullish sign for gmt. TAYOR
Green Metaverse Token GMT STEPN: Is this the moment of truth?GMT Green Metaverse Token STEPN could be forming a potencial W-Pattern to retest the support level at 0,80 $. The golden pocket from the Fibonacci Retracement comes in directly with the downtrend line at 1,40 $...what a perfect confluence. :-)
I will update you here if the W-Pattern really plays out and what the price target is. All in all GMT must break the 0,618 to 0,65 Fib Level.

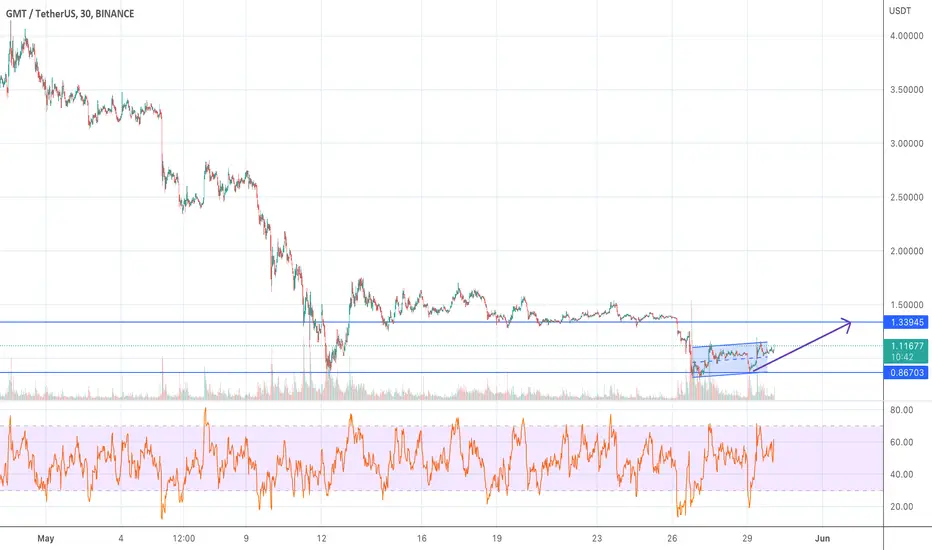
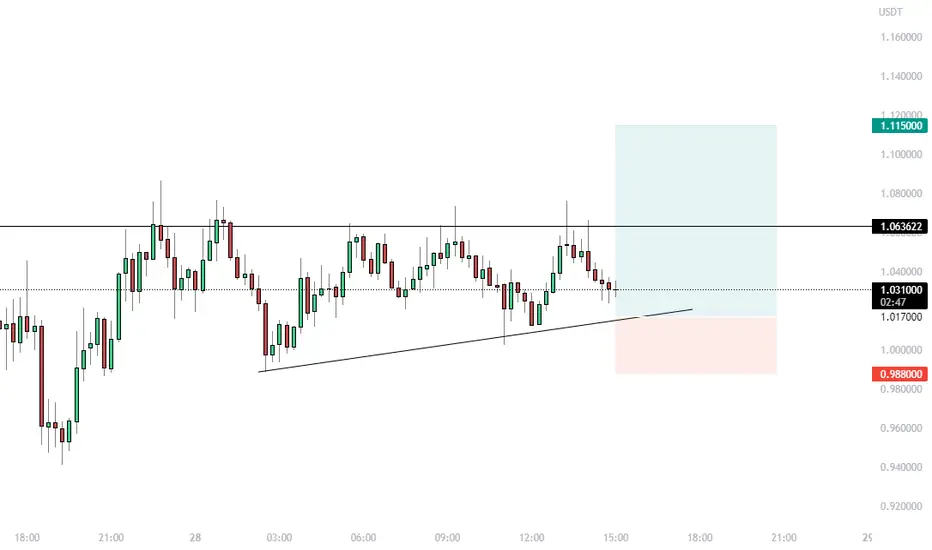
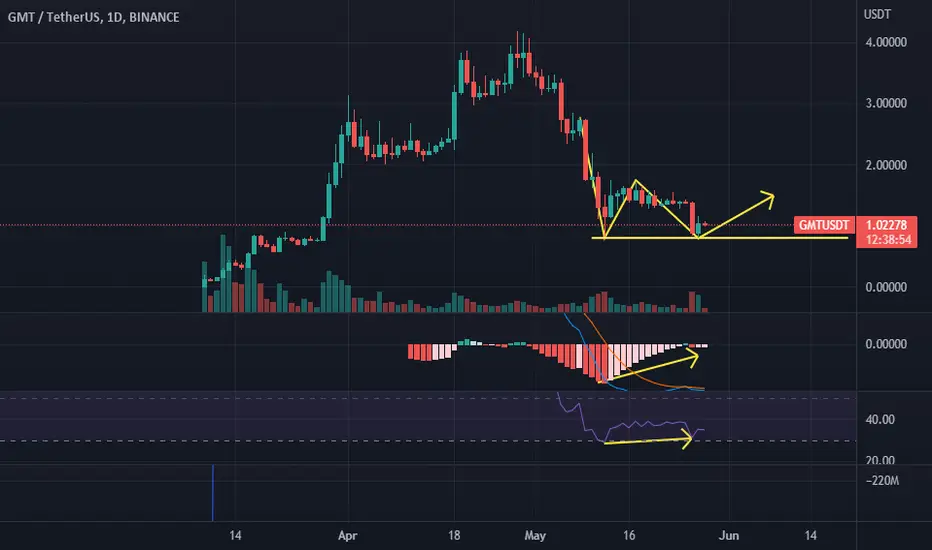
Rising support + static resistanceHello friends. I found a relatively clean setup featuring my favorite pattern: rising support + static resistance.
This pattern is especially powerful because of the nature of resistance. Think for a second of this level at ~$1.06 as a door, and think of the price as a "battering ram". Each time that the battering ram smashes into the door, the door falls apart some, and becomes weaker. At some point, when the door has become weak enough, it will fall down altogether as the battering ram smashes into it for the last time, popping off the hinges of the door. This creates a breakout in the price which can be quite explosive and generate a good profit for those who were already long. I don't really like to long those after the breakout already happened because you miss most of the movement, so it seems more effective from a risk to reward standpoint to simply anticipate a possible breakout of this nature.
Thanks for playing.
GMT, is expected to rebound with double bottom support.The following are machine translations:
On the daily chart, it stepped back after it fell to around 0.8 on May 12 and rebounded. Now it has stepped back to around 0.8 to get support and rebound, showing a bullish shape.
In terms of indicators, the macd indicator is seriously deviating from the bottom, and you can wait for the golden fork to do more. SRI reached 27.72 on May 12, the price on the 26th was slightly lower than that on the 12th, and the RSI reached 30.3, which also formed a bottom divergence, and the market rebounded yesterday.
In terms of operation, it can be regarded as a double-bottom pattern at present. It can be done with the indicator macd. When the macd crosses, it is more likely to continue to rise.
TS ❕ GMTUSD: bounced offGMT has reached the lower limit of the accumulation zone and the support level, I expect an upward rebound.
BUY scenario: long to 1.738.
----------------------------------------------------------------------------
Remember, there is no place for luck in trading - only strategy!
Thanks for the likes and comments.

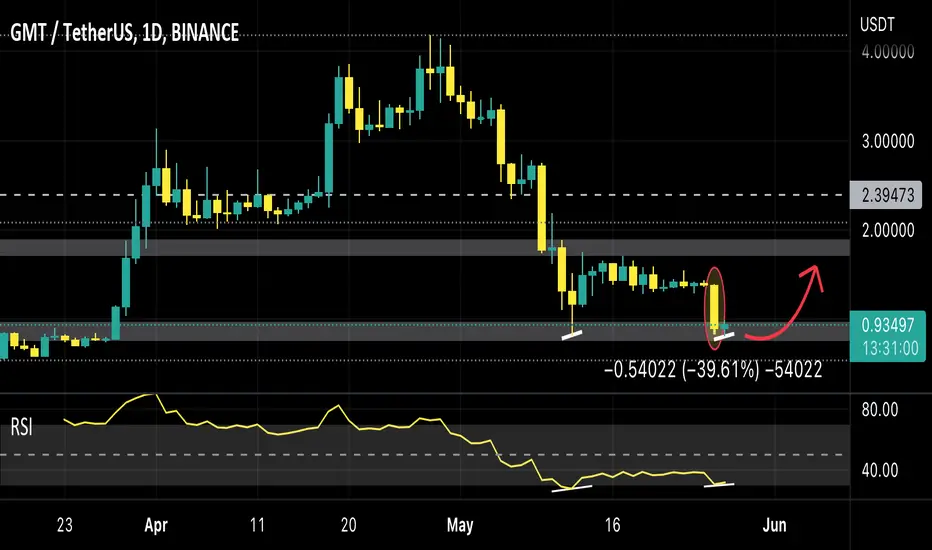
GMT LONG#GMTUSDT
Looking at $GMTUSDT from the 1D timeframe. Expecting a relief recovery after over -39% dip from the previous day.
RSI printed double bottom ✅
Strong support at $0.78 held✅
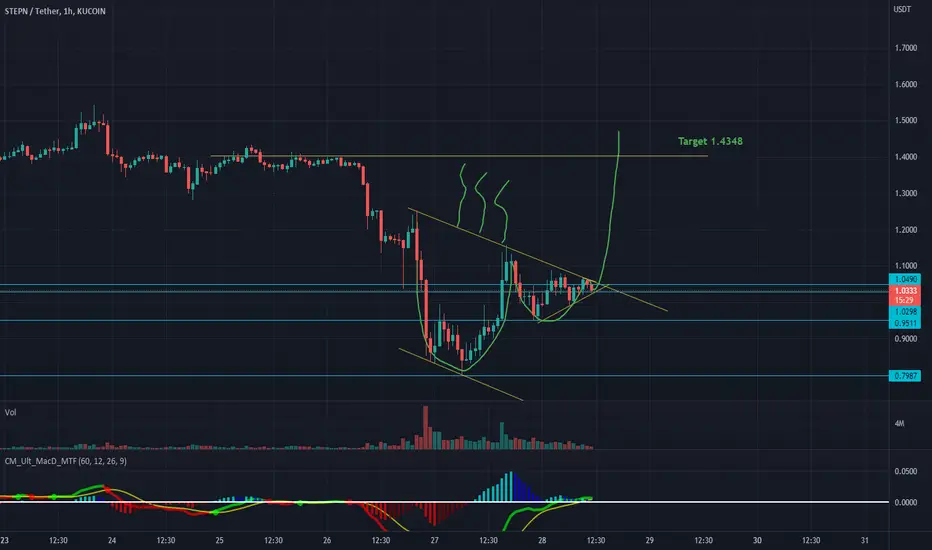
GMT Must see moon
Cup & handle Pattern has been Created.
as i See, Next TP is 1.4348$
commect below your Ideas