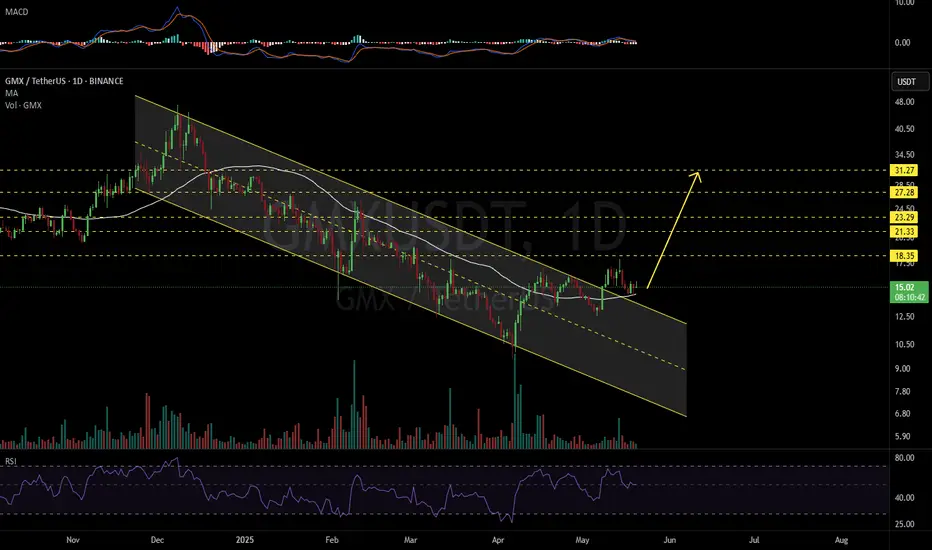
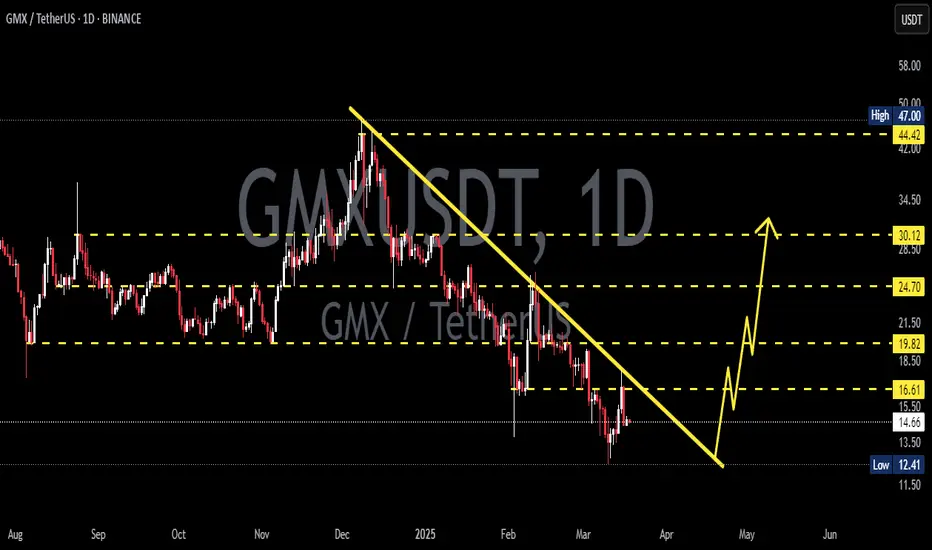
GMXUSDT 1D#GMX has broken the descending channel to the upside on the daily chart. It is currently trading above the daily MA50. Expect some upward movement from here. Targets are:
🎯 $18.35
🎯 $21.33
🎯 $23.29
🎯 $27.28
🎯 $31.27
⚠️ Use a tight stop-loss.
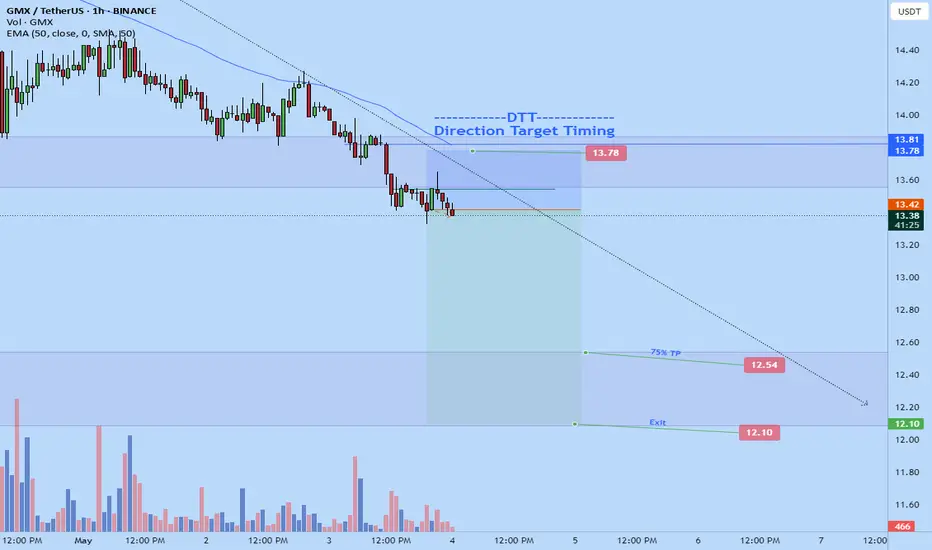
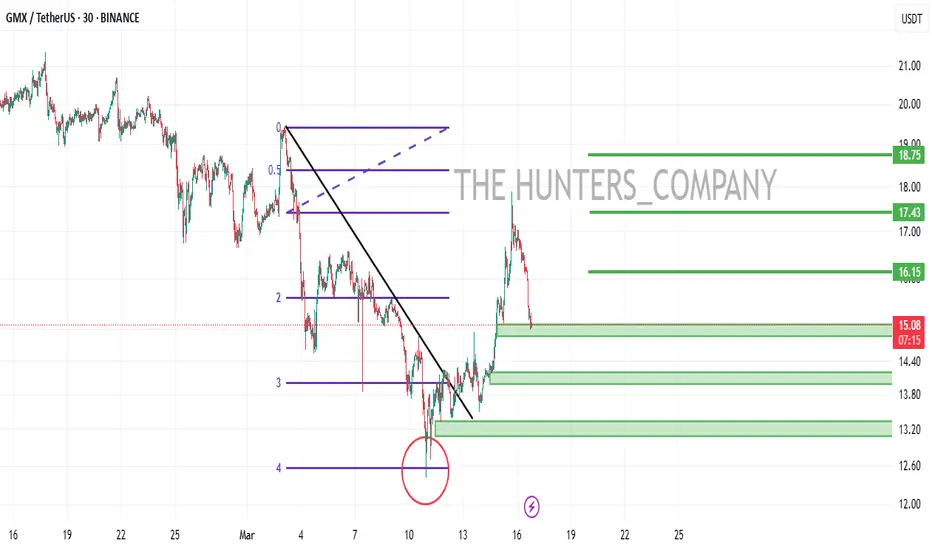
Gmx short to 12.1Just now opened a short position on GMX. Am expecting a clean fall soon down to $12.1 potential demand zone.
2.5-3.67RR
75% Tp at $12.54
close at $12.1
Stop: $13.78
DTT strategy applied
Gmx short to Entered gmx short a while ago. I anticipate further selloff down to 13.6 area.
Roughly 3RR
Market reacting to supply zone- more supply coming in.
DTT applied.
Stop and target on chart
Time sensitive

gmx extremely over sold (easy 400-500% gain)The descending broadening wedge chart pattern is a bullish reversal formation characterized by two sloping and diverging trend lines. This pattern emerges as the price fluctuates between the upper resistance and lower support trend lines, expanding the trading range during a downtrend.
A descending
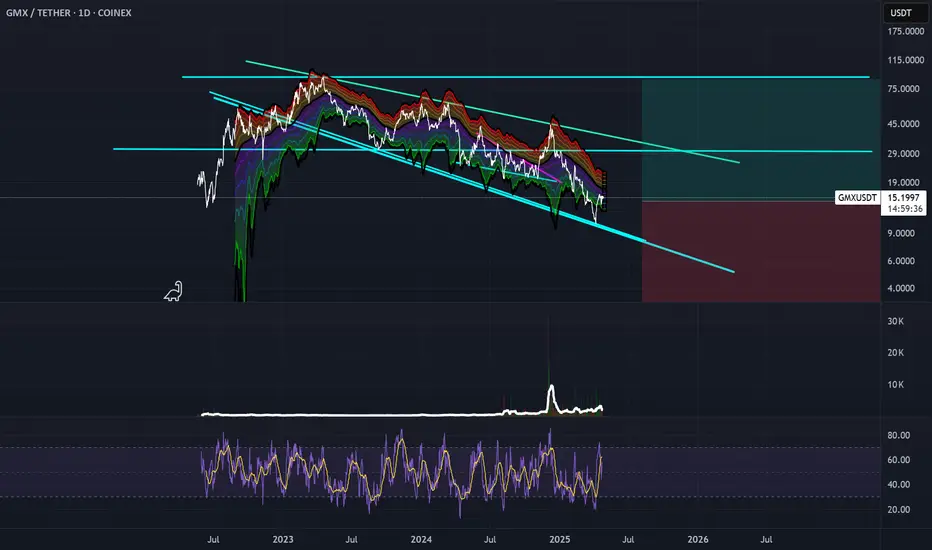
trading the decending channel for 300% (long)The descending channel pattern (also called the falling channel) is a bearish chart formation. It develops within pronounced downtrends in asset pricing.
Forex traders view descending channels as evidence of weakened strength in the counter currency. Accordingly, it is frequently used to sell a cu

GMXUSDT 30%+ Short opportunity here?I found a possible short opportunity here in one of the largest up-trending tokens in the last 24 hours. You can see by all the previous structure of what I call the EMA (solid red smoothed Heikin Ashi candles) and how the actual price behaves when it break up through the mean. It is short lived (2-
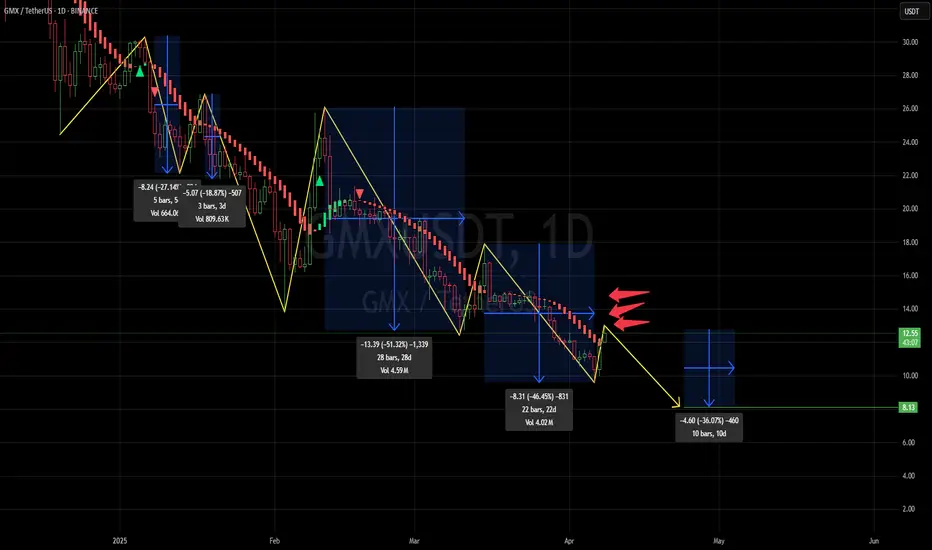
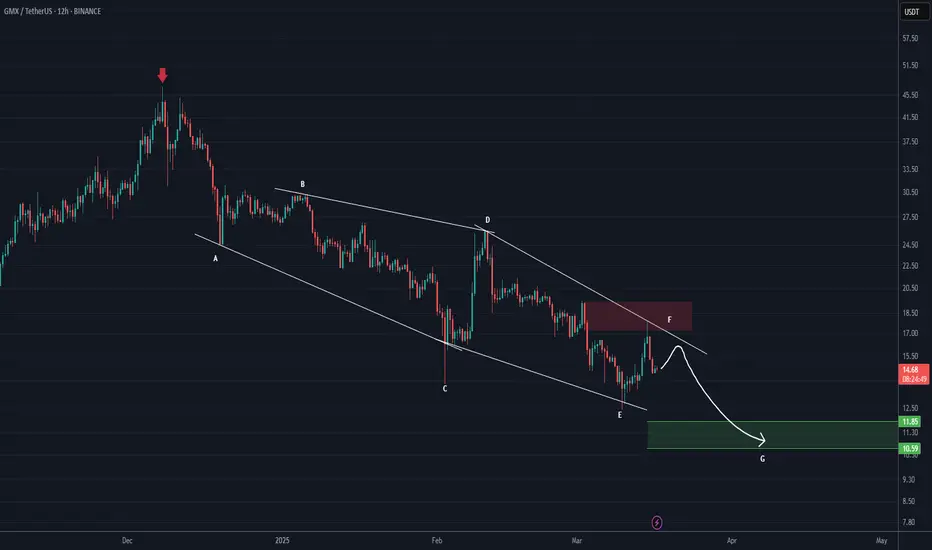
GMX is Still Bearish (12H)From the point where we placed a red arrow on the chart, it appears that GMX has entered a bearish diametric pattern.
It now seems that wave F is nearing completion.
The target is marked on the chart. it could be the green target box. If a daily candle closes above the upper red box, this analysis
GMXUSDT 1DGMX ~ 1D Analysis
#GMX High risk trading, Buy after successfully penetrating this resistant line with a short -term target of at least 10%+.
GMX/USDTHello friends
Due to the heavy price drop on the indicated support, buyers have provided good support for the price, which has caused a good price growth.
Now you can buy in steps in the indicated support areas.
If you want to be with us in the Alt Season, send us a message.
*Trade safely with
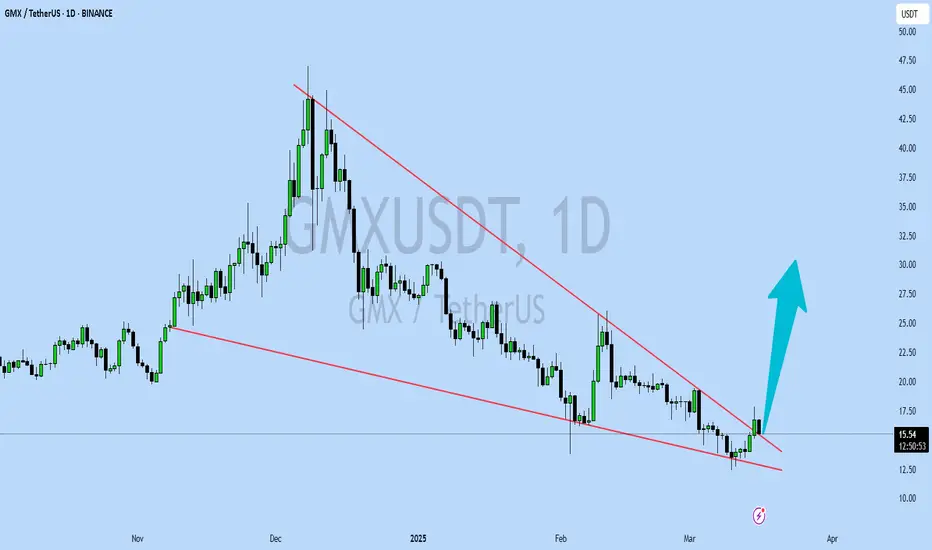
GMXUSDT UPDATEGMXUSDT is a cryptocurrency trading at $15.52. Its target price is $30.00, indicating a potential 90%+ gain. The pattern is a Bullish Falling Wedge, a reversal pattern signaling a trend change. This pattern suggests the downward trend may be ending. A breakout from the wedge could lead to a strong u
See all ideas
Summarizing what the indicators are suggesting.
Oscillators
Neutral
SellBuy
Strong sellStrong buy
Strong sellSellNeutralBuyStrong buy
Oscillators
Neutral
SellBuy
Strong sellStrong buy
Strong sellSellNeutralBuyStrong buy
Summary
Neutral
SellBuy
Strong sellStrong buy
Strong sellSellNeutralBuyStrong buy
Summary
Neutral
SellBuy
Strong sellStrong buy
Strong sellSellNeutralBuyStrong buy
Summary
Neutral
SellBuy
Strong sellStrong buy
Strong sellSellNeutralBuyStrong buy
Moving Averages
Neutral
SellBuy
Strong sellStrong buy
Strong sellSellNeutralBuyStrong buy
Moving Averages
Neutral
SellBuy
Strong sellStrong buy
Strong sellSellNeutralBuyStrong buy
Displays a symbol's price movements over previous years to identify recurring trends.