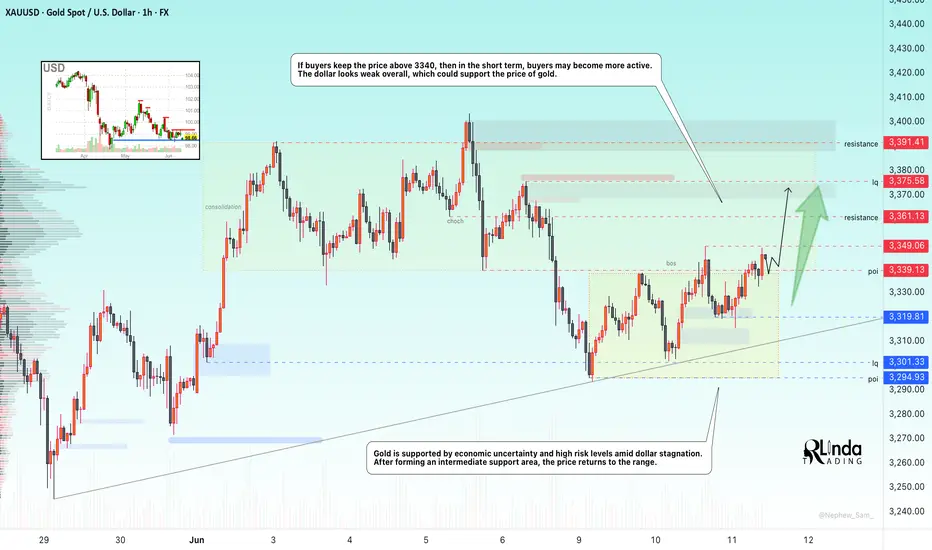
GOLD → Strengthening and return to range. Focus on 3340FX:XAUUSD is forming a fairly strong support zone (a cascade within an upward line). The price is returning to the range, with bulls storming 3330-3340.
Markets are awaiting US inflation data (CPI), which may affect expectations for a Fed rate cut in September (chances are about 52%). Optimism following progress in US-China trade talks is supporting sentiment, but uncertainty remains due to a court ruling allowing Trump to maintain tariffs. This is holding back the dollar and helping gold. CPI forecast: 0.2% growth, core inflation 0.3%. Lower inflation, on the other hand, will support expectations of lower rates and strengthen demand for gold as a safe-haven asset.
Technically, gold is stuck between the boundaries of a symmetrical triangle. Overall, this situation is reflected in all markets. Consolidation is forming and the price could break out in either direction...
Support levels: 3301, 3330, 3340
Resistance levels: 3349, 3361, 3375
Focus on the boundaries of the previous range - 3330 - 3340. If the bulls, after the assault, manage to hold their ground above this zone, the market may take the initiative due to support and continue its growth towards areas of interest.
Best regards, R. Linda!
GOLD trade ideas
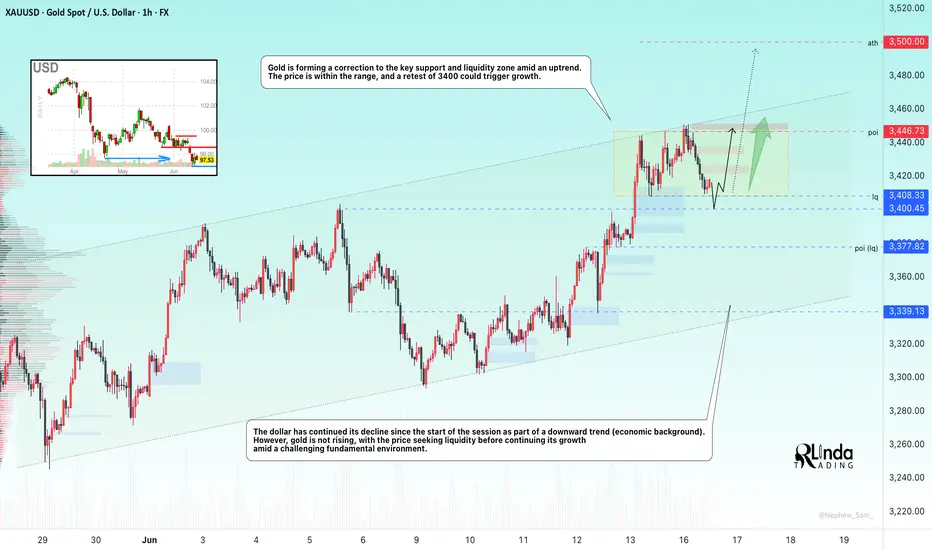
GOLD → Hunting for liquidity before continued growthFX:XAUUSD has been correcting since the start of the session. The fundamental background is complicated due to the escalation of the conflict in the Middle East.
The price of gold briefly retreated from a two-month high above $3,450 amid a recovery in the dollar and investor caution. Escalating tensions between Israel and Iran are dampening risk appetite, while markets await decisions from the Fed and the Bank of Japan. Expectations of a dovish Fed continue to support interest in gold, but fresh impetus is needed for further gains.
Technically, the market is bullish. Gold is forming a correction to the key support and liquidity zone amid an uptrend. The price is within the range, and a retest of 3400 could trigger growth.
Support levels: 3408, 3400
Resistance levels: 3446, 3500
A retest of support and liquidity capture amid the current challenging situation (high interest in the metal) and a bullish trend could support the price, allowing gold to continue its growth.
Best regards, R. Linda!
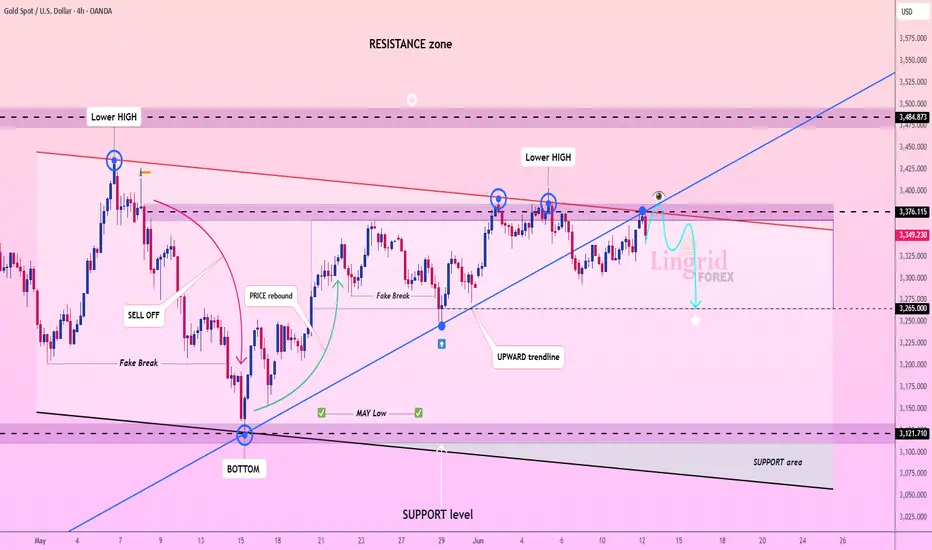
Lingrid | GOLD Consolidation ZONE: Possible SHORT SetupOANDA:XAUUSD has formed multiple lower highs near the 3376–3380 zone, consistently rejecting the descending red trendline within the resistance area. Despite a strong rebound from the May low, price is now testing the underside of this multi-touch resistance and stalling just under 3376. A rejection from this region may trigger a drop toward the support level at 3265.
📈 Key Levels
Sell zone: 3370–3376
Sell trigger: breakdown below 3340
Target: 3265
Buy trigger: breakout above 3385 with momentum
💡 Risks
Breaking above 3385 would invalidate the bearish thesis
False breakout patterns are present, so wicks above may trap sellers
Trendline support around 3300 must hold to avoid further downside momentum
Traders, if you liked this idea or if you have your own opinion about it, write in the comments. I will be glad 👩💻
XAUUSD:Touching $3500 One More Time Gold is currently extremely bullish and we expect price to touch 3500$ region one more time before it may reverse. you can set your own target based on your risk. Gold will remain volatile in coming weeks and we want all of you to trade safe.
Good luck and trade safe.
Team Setupsfx_
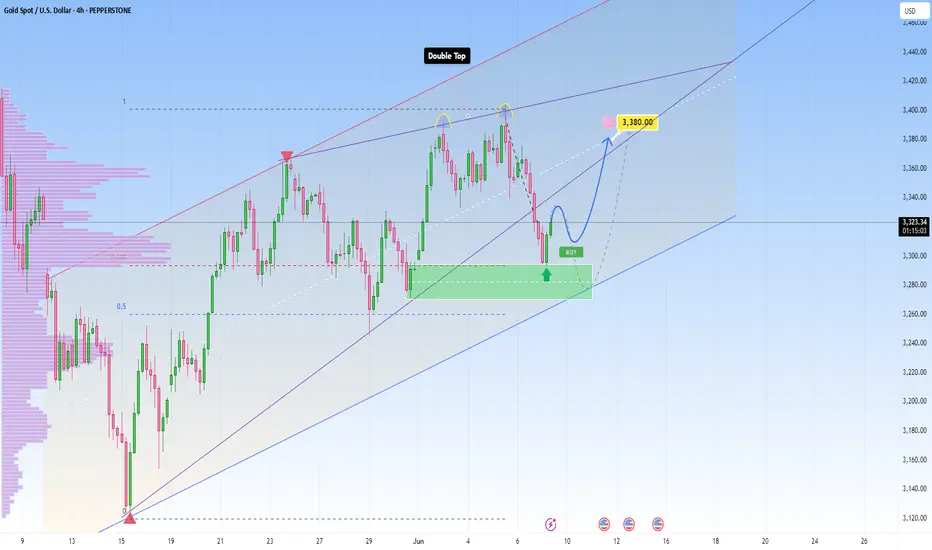
Gold’s back on track, paying attention to momentum and hintsXAUUSD is still climbing steadily within its upward parallel channel, respecting structure beautifully as we’re now seeing early signs of bullish interest returning, right after we got a nice rejection from the support zone.
Currently I’m watching this bounce to have a target near 3,380 , somewhere around the middle line of the ascending channel. If this bullish push continues with strong volume and momentum, I’ll be locking in that bias and planning my entry accordingly.
Patience first, I always wait for price to prove itself before getting involved.
This could be a beautiful continuation…
Or just one more fakeout before a deeper drop.
XAUUSD Hello Traders! 👋
What are your thoughts on GOLD?
Gold has broken above a major resistance level, and price has closed firmly above this zone, signaling strong bullish momentum and a shift in market sentiment.
We expect a brief pullback in the short term, followed by a resumption of the upward move toward higher targets and new highs.
As long as price remains above the identified support level, the bullish outlook remains valid.
Is gold ready for its next leg up after the pullback? Share your thoughts below! 🤔👇
Don’t forget to like and share your thoughts in the comments! ❤️
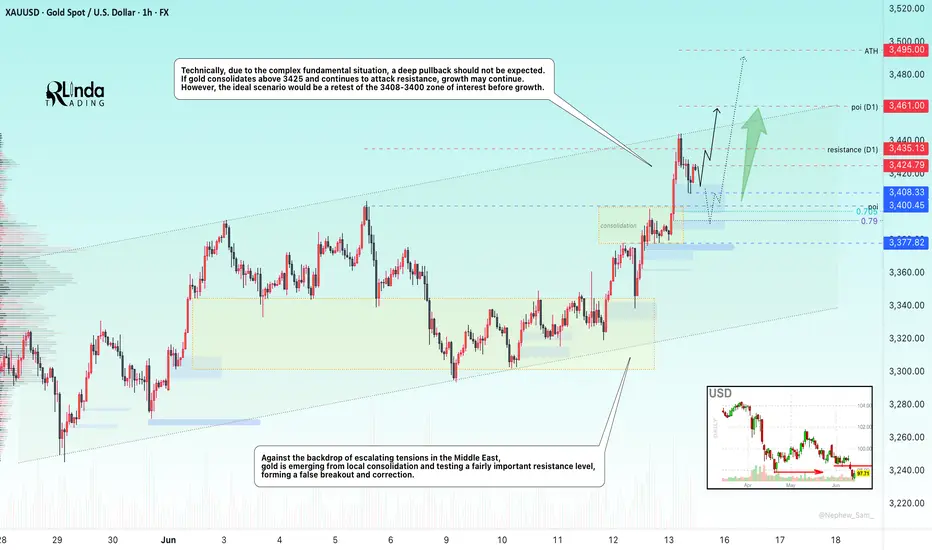
GOLD → Geopolitical risks are driving gold prices up. To ATH?FX:XAUUSD is updating its interim highs as it retests resistance at 3435 amid escalating tensions in the Middle East. Economic risks are on the rise...
Gold rose 1.5% on Friday in Asian trading as investors sought refuge from escalating tensions between Israel and Iran. The price approached 7-week highs and could reach $3,500 if the conflict intensifies. The US and Israel have warned of serious consequences, while Iran has promised to respond. Geopolitics has overshadowed economic news, and markets are pricing in the possibility of a Fed rate cut in September.
Technically, the price is emerging from a local consolidation and testing a fairly important resistance level, forming a false breakout and correction. But this does not mean that the price will fall...
Resistance levels: 3425, 3435, 3461
Support levels: 3408, 3400, 3377
If gold consolidates above 3425 and continues to storm the resistance, growth may continue, and at the moment, there is a fairly high probability of a retest of the ATH. However, the ideal scenario would be a retest of the zone of interest 3408 - 3400 and the capture of liquidity before continuing growth.
Best regards, R. Linda!
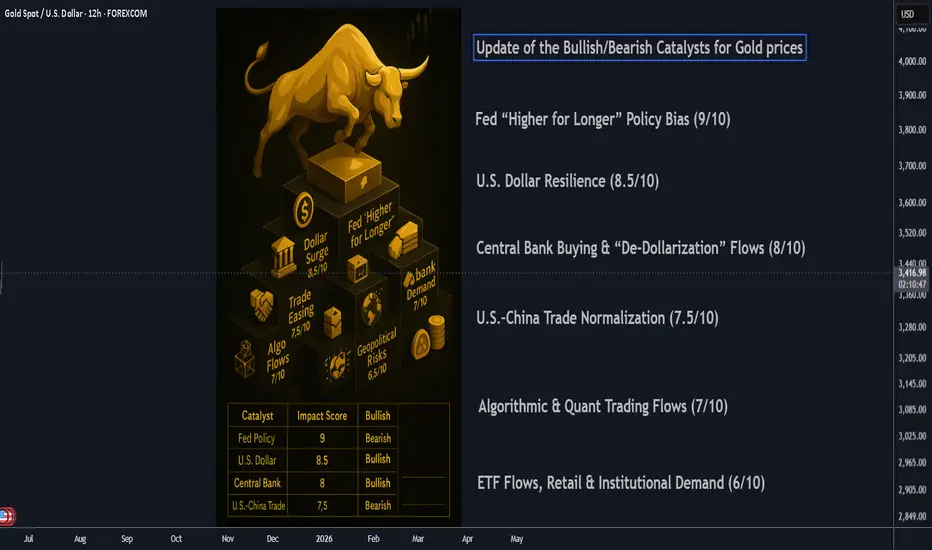
Update of the Bullish/Bearish Catalysts for Gold prices________________________________________
⚡️ Gold’s Pullback: A Reset, Not the End
After peaking above $3,500/oz in April, gold’s slide back toward $3,210 marks a sharp—but not unusual—correction. What’s changed in the gold narrative? The rapid unwinding of panic bids as the Fed stays hawkish, the dollar flexes, and risk appetite returns. But beneath the surface, multiple structural drivers—old and new—are shaping gold’s next act.
________________________________________
1. Fed “Higher for Longer” Policy Bias (9/10)
Still the #1 driver.
With inflation sticky and the U.S. labor market robust, the Federal Reserve’s reluctance to cut rates (4.25–4.50%) is pinning real yields near multi-year highs. This erodes the appeal of non-yielding assets like gold, particularly for Western investors.
🦅 Watch for any dovish shift—a single Fed pivot could reignite gold fast.
________________________________________
2. U.S. Dollar Resilience (8.5/10)
The DXY recently surged above 101, buoyed by relative U.S. growth outperformance and ongoing EM weakness. Since gold is dollar-priced, a strong greenback makes gold more expensive for non-dollar buyers, crimping global demand.
💵 Sustained dollar strength could push gold closer to $3,100 unless countered by inflation or new geopolitical stress.
________________________________________
3. Central Bank Buying & “De-Dollarization” Flows (8/10)
This is the new wild card.
Countries like China, India, Turkey, and Russia are accelerating gold reserves accumulation—partly to hedge against dollar-centric sanctions and diversify away from U.S. Treasuries. Q2 2025 data shows a 35% jump in net central bank purchases year-on-year.
🏦 This bid underpins the gold market even when ETFs and retail are sellers.
________________________________________
4. U.S.–China Trade Normalization (7.5/10)
The May 2025 Geneva agreement was a big de-risking event. While tariffs haven’t vanished, steady progress on tech and agriculture reduces tail risk for global trade, putting downward pressure on gold’s safe-haven premium.
🌏 Any breakdown or tariff surprise could quickly reverse this.
________________________________________
5. Algorithmic & Quant Trading Flows (7/10)
Gold’s volatility is now heavily influenced by systematic funds. CTA (commodity trading advisor) and quant-driven selling accelerated the recent drop once $3,300 was breached. This non-fundamental selling creates overshoots—but also sharp reversals on technical bounces.
🤖 Expect snapbacks when positioning reaches extremes.
________________________________________
6. U.S.–U.K. & EU Trade Deals (6.5/10)
Both deals have reduced the global uncertainty premium. While the economic impact is moderate, improved global relations have pushed capital into equities and away from gold.
🇬🇧 Keep an eye on political risk, especially if new tariffs or Brexit-related shocks re-emerge.
________________________________________
7. India–Pakistan and Middle East Geopolitical Risks (6.5/10)
Tensions have cooled, but remain a latent driver. The India–Pakistan border saw restraint in May; Iran–U.S. talks are “cautiously positive.” Any surprise flare-up, especially involving oil, can quickly restore gold’s safe-haven bid.
🕊️ Event-driven spikes likely, but not sustained unless escalation persists.
________________________________________
8. ETF Flows, Retail & Institutional Demand (6/10)
ETF inflows have slowed sharply in 2025, but central bank and Asian buying partly offset this. U.S. retail interest has faded due to higher Treasury yields, but any sign of real rates rolling over could spark new inflows.
📈 ETF demand is now more a symptom than a cause of price moves.
________________________________________
9. Technological Demand & Jewelry Trends (5.5/10)
Longer-term, gold’s use in electronics, EVs, and green tech is rising modestly (up ~3% YoY). Indian and Chinese jewelry demand—seasonally soft now—could rebound late 2025 if income and sentiment recover.
📿 Not a short-term driver, but a steady tailwind in the background.
________________________________________
10. Fiscal Risk & U.S. Debt Sustainability (5.5/10)
Rising concerns about the U.S. debt trajectory, especially if deficits widen or the U.S. nears a shutdown or downgrade, can trigger flight-to-quality bids for gold. This is not the main driver now, but is a key “black swan” risk if Treasury auctions stumble.
💣 Could move up the list rapidly on negative headlines.
________________________________________
🌐 Other Catalysts to Watch:
• Israel – Iran tensions in the Middle East – limited impact on gold prices.
• Crypto Market Volatility (5/10): Periods of sharp crypto drawdowns have triggered some rotation into gold, but the correlation is inconsistent.
• Chinese Real Estate Stress (5/10): Signs of further slowdown or crisis (e.g., major developer defaults) could boost gold as a defensive play in Asia.
• Physical Supply Disruptions (4/10): Mine strikes, export restrictions, or transport bottlenecks can create localized price spikes, but rarely move the global market for long.
________________________________________
🏆 2025 Gold Catalyst Rankings (with Impact Scores)
Rank Catalyst Strength/10 Current Impact Direction Notes
1 Fed “Higher for Longer” Policy 9.0 Very High Bearish Key yield driver
2 U.S. Dollar Resilience 8.5 Very High Bearish Hurts non-USD demand
3 Central Bank & “De-Dollarization” Buying 8.0 High Bullish Structural support
4 U.S.–China Trade Normalization 7.5 High Bearish De-risks global trade
5 Algorithmic/Quant Trading Flows 7.0 High Bearish Magnifies volatility
6 U.S.–U.K./EU Trade Deals 6.5 Moderate Bearish Risk appetite rising
7 India–Pakistan/Mideast Geopolitics 6.5 Moderate Neutral Event risk
8 ETF, Retail & Institutional Flows 6.0 Moderate Bearish Trend follower
9 Tech/Jewelry Physical Demand 5.5 Low Bullish Seasonal uptick possible
10 U.S. Debt/Fiscal Sustainability 5.5 Low Bullish Potential tail risk
11 Crypto Market Volatility 5.0 Low Bullish Risk-off flows (sometimes)
12 China Property Crisis 5.0 Low Bullish Asian safe-haven buying
13 Physical Supply Disruptions 4.0 Very Low Bullish Rare but possible
________________________________________
🚦Where Next for Gold?
• Current price: ~$3,210/oz
• Key support: $3,150/oz
• Key upside triggers: A dovish Fed surprise, sharp dollar reversal, sudden geopolitical event, or central bank “buying spree.”
• Risks: Extended strong dollar, yield spike, no escalation of global risks.
________________________________________
Summary Table: 2025 Gold Price Catalysts Comparison
Catalyst 2024 Score 2025 Score Change Impact Direction (2025) Commentary
Fed Rate Policy 9 9 – Bearish Unchanged, still dominant
U.S. Dollar 8 8.5 ↑ Bearish Gained in strength
Central Bank Buying 7 8 ↑ Bullish Grown in importance, especially in Asia
U.S.-China Trade 7.5 7.5 – Bearish Still relevant, deal holding for now
Algorithmic/Quant Flows 6 7 ↑ Bearish Systematic trading influence is rising
Geopolitics (excl. Russia/Ukraine) 6 6.5 ↑ Neutral Slight increase, mostly latent risks
ETF/Institutional Flows 5 6 ↑ Bearish Slower, but still influential
Jewelry/Tech Demand 4.5 5.5 ↑ Bullish Tech/jewelry more important now
U.S. Debt/Fiscal Risk 5 5.5 ↑ Bullish Gaining attention with deficit concerns
Crypto Market Volatility 4 5 ↑ Bullish Correlation growing, but inconsistent
China Property Risk N/A 5 NEW Bullish Added due to emerging Asian risk
Physical Supply Disruption 3.5 4 ↑ Bullish Minor, only spikes on rare events
________________________________________
🥇 Bottom Line:
Gold’s retreat reflects a rebalancing of risk and yield, but the stage is set for sudden moves—especially if the Fed blinks, the dollar falters, or new shocks emerge. The top three catalysts (Fed, Dollar, Central Bank buying) are especially worth watching as we head into the second half of 2025.
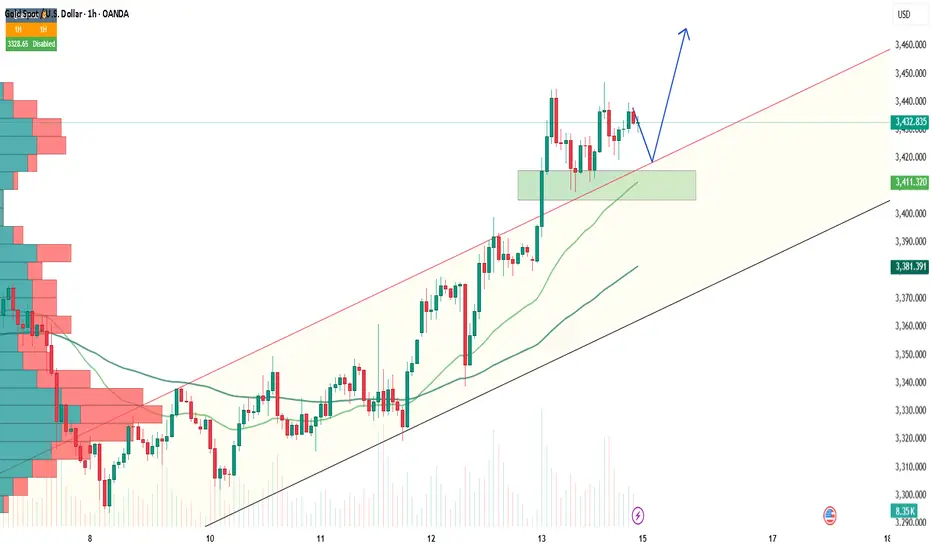
GOLD's rise has been steady, decisive move aheadGold is the focus, plain and simple. We’re in an ascending channel, and price is respecting that structure with precision, higher highs, and no major signs of exhaustion yet.
Recently a clear resistance level was just taken out, and now I am watching for the classic retest. That breakout? A big deal, and a strong clue as well. If that zone holds as support, that’s a green light for a potential upmove toward 3,460 which matches the top of the channel.
But if it fails, we could expect a slight pullback, it might mean we could be in for a healthy dip before the next move.
Bottom line: follow the structure, and don’t force trades here without confirmation first

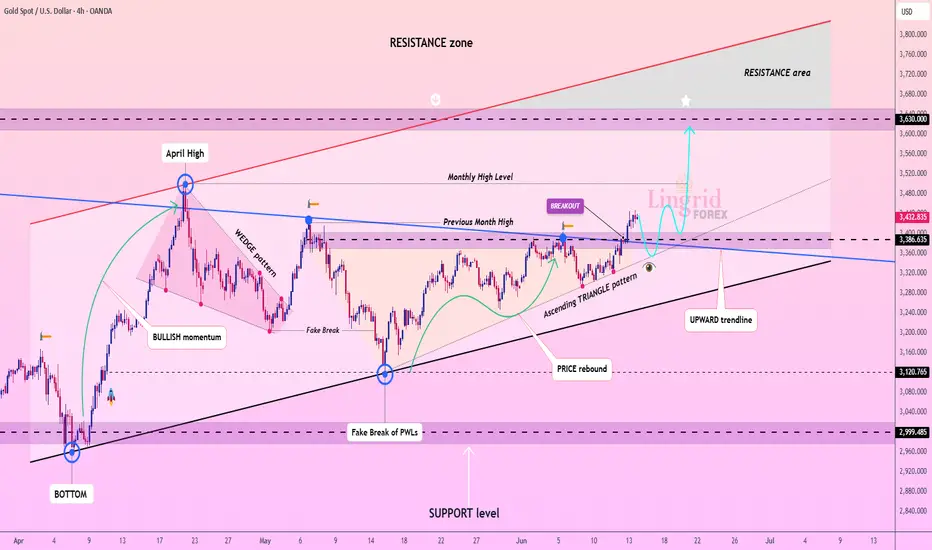
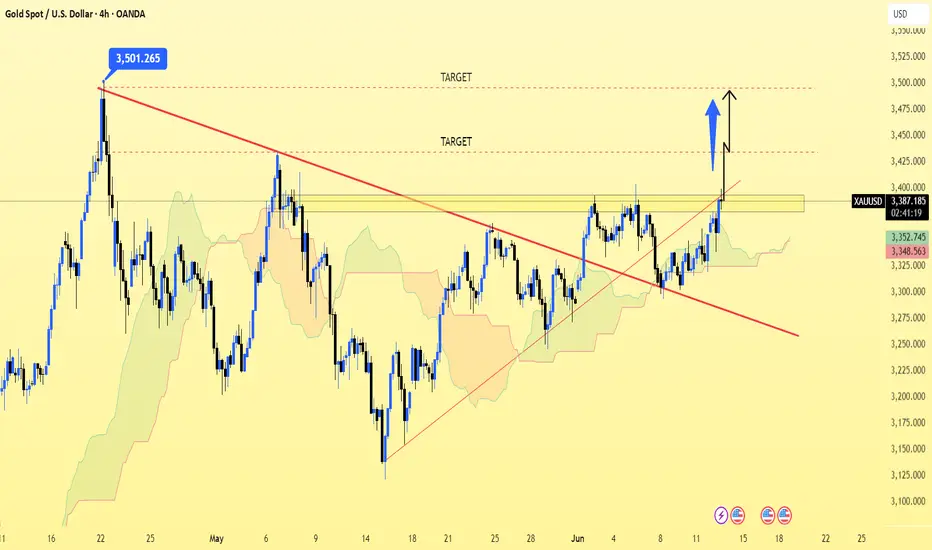
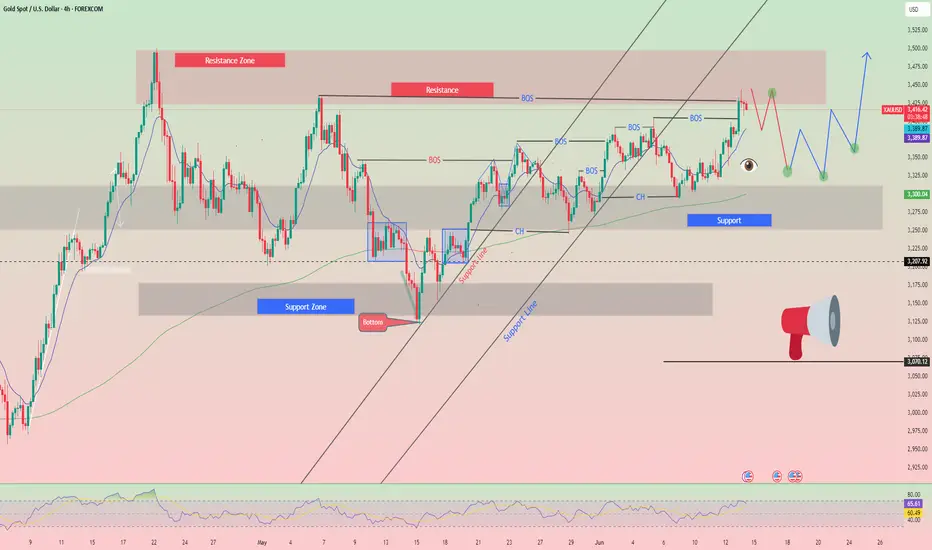
Lingrid | GOLD Weekly Analysis: Geopolitical Safe-Haven RallyOANDA:XAUUSD demonstrated exceptional strength this week as geopolitical tensions from Israeli-Iranian conflicts drove massive safe-haven demand. The metal successfully broke above the critical 3,360 resistance level, confirming the completion of an inverse head and shoulders pattern that has been forming since April.
The 4H chart reveals the market appears to be forming an ascending triangle pattern within a broader upward trendline, suggesting continued bullish momentum. The recent breakout above the monthly high resistance zone indicates strong institutional buying pressure.
The daily chart presents an even more compelling picture with the completion of an inverse head and shoulders pattern, a classic bullish reversal formation. This technical setup, combined with the massive flag pattern completion, projects potential targets toward $3,650-$3,700 levels. The right shoulder formation confirms the pattern's validity, while sustained buying above previous resistance zones validates the upward trajectory.
We should monitor the $3,430-$3,450 resistance area closely, as a decisive break could accelerate momentum toward the projected targets. The combination of geopolitical risk premiums and technically sound chart patterns creates a favorable environment for continued gold appreciation in the mid-term.
Traders, if you liked this idea or if you have your own opinion about it, write in the comments. I will be glad 👩💻
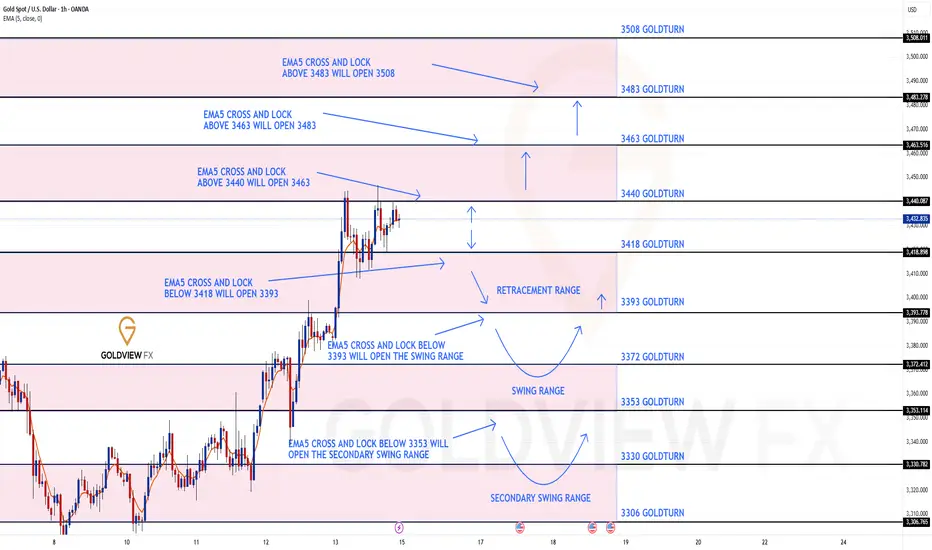
GOLD 1H CHART ROUTE MAP UPDATE & TRADING PLAN FOR THE WEEKHey Everyone,
Please see our updated 1h chart levels and targets for the coming week.
We are seeing price play between two weighted levels with a gap above at 3340 and a gap below at 3418. We will need to see ema5 cross and lock on either weighted level to determine the next range.
We will see levels tested side by side until one of the weighted levels break and lock to confirm direction for the next range.
We will keep the above in mind when taking buys from dips. Our updated levels and weighted levels will allow us to track the movement down and then catch bounces up.
We will continue to buy dips using our support levels taking 20 to 40 pips. As stated before each of our level structures give 20 to 40 pip bounces, which is enough for a nice entry and exit. If you back test the levels we shared every week for the past 24 months, you can see how effectively they were used to trade with or against short/mid term swings and trends.
The swing range give bigger bounces then our weighted levels that's the difference between weighted levels and swing ranges.
BULLISH TARGET
3340
EMA5 CROSS AND LOCK ABOVE 3340 WILL OPEN THE FOLLOWING BULLISH TARGETS
3463
EMA5 CROSS AND LOCK ABOVE 3463 WILL OPEN THE FOLLOWING BULLISH TARGET
3483
EMA5 CROSS AND LOCK ABOVE 3483 WILL OPEN THE FOLLOWING BULLISH TARGET
3508
BEARISH TARGETS
3418
EMA5 CROSS AND LOCK BELOW 3418 WILL OPEN THE FOLLOWING BEARISH TARGET
3393
EMA5 CROSS AND LOCK BELOW 3393 WILL OPEN THE SWING RANGE
3372
3353
EMA5 CROSS AND LOCK BELOW 3393 WILL OPEN THE SECONDARY SWING RANGE
3330
3306
As always, we will keep you all updated with regular updates throughout the week and how we manage the active ideas and setups. Thank you all for your likes, comments and follows, we really appreciate it!
Mr Gold
GoldViewFX
Gold Takes the Throne as Safe Haven AgainThe recent escalation in the Middle East — particularly Israel’s surprise strike on Iran — has stirred up significant volatility in global financial markets. Oil prices surged, stock markets around the world turned red, just as many had predicted. However, in a surprising twist, capital did not rush into the usual safe havens like the US dollar or Treasury bonds. Instead, it flowed decisively into gold.
In fact, US Treasury yields have soared from 3.98% in April to around 4.42% now. This surge doesn’t signal growing confidence — it reflects investor demand for higher returns to compensate for the rising risk of holding dollar-denominated assets.
Against this backdrop, gold is emerging as an “unshackled safe haven” — immune to political instability tied to fiat-currency-issuing nations. The precious metal is once again proving its value in times of global uncertainty.
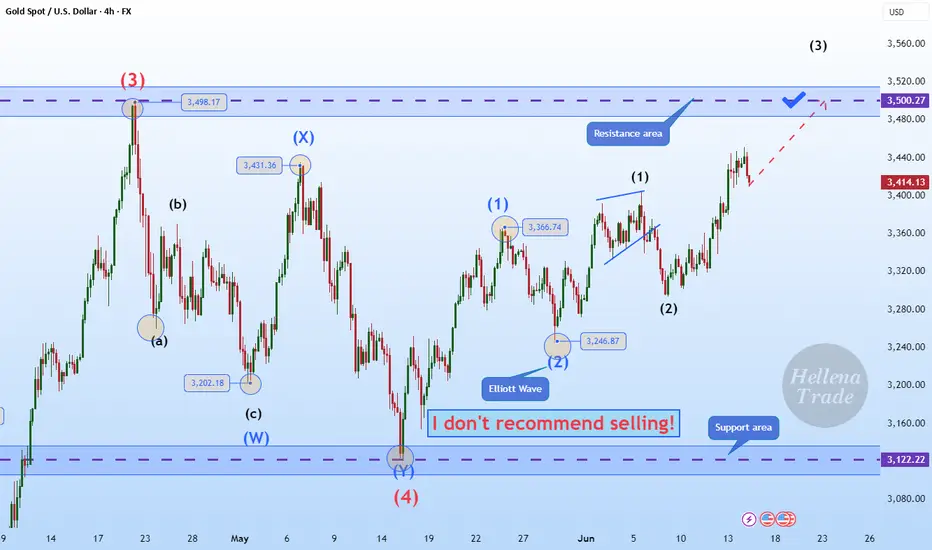
Hellena | GOLD (4H): LONG to resistance area of 3500.Colleagues, I believe that, as with the euro, the upward five-wave impulse is not yet over. At the moment, I see the formation of wave “3” of the lower order and wave ‘3’ of the middle order, which means that the upward movement will continue at least to the resistance area of 3500 — this is the maximum of wave “3” of the higher order, which means that a correction is possible at this level.
Manage your capital correctly and competently! Only enter trades based on reliable patterns!
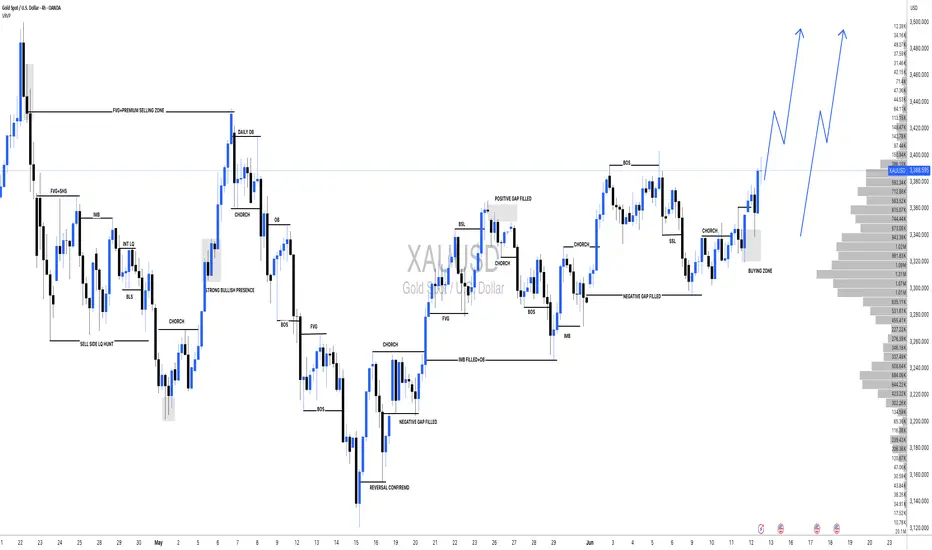
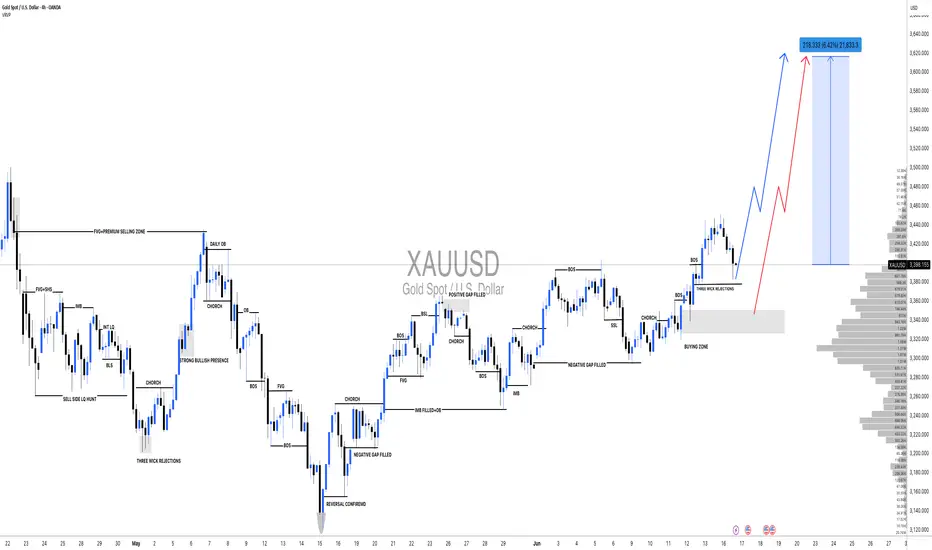
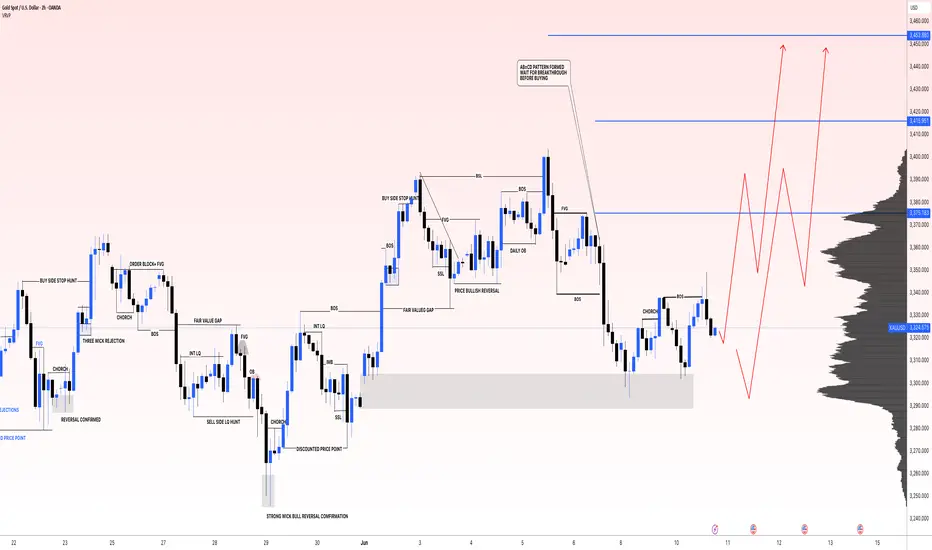
XAUUSD: Accumulation in process,Waiting for Bullish DistributionHello,
Today, we will analyse the key points of each significant move.
Following the price’s all-time high at $3500, it experienced a sharp decline and failed to maintain that level. A substantial 2400 pips would have resulted in significant losses for many accounts. Initially, it was perceived as a minor correction, with the expectation of further price appreciation. However, this assumption proved incorrect. After reaching an even higher peak, the price invariably undergoes a more substantial correction.
At 3260, substantial bullish volume surged into the market, necessitated by the presence of a fair value gap. Subsequently, the price experienced a decline, reflecting the prevailing bearish trend, which favoured the bears. However, at 3200, a pivotal level representing a discounted price point, bull volume surged. This powerful bullish impulse propelled the price to 3432, ultimately confirming the bullish trend. AB=CD there recurring pattern emerged weekly. When the price reached the 3432 level as a fair value gap, the CD pattern commenced.
AB=CDTheHeyIndeed, we have identified a recurring pattern. It appears to be an equal move in any direction, and it has manifested precisely as anticipated. We were aware that the price would reject at 3120, and it did so accordingly. Currently, the market is in our favour. Upon market opening, it exhibited a positive gap, propelling the price to 3450. However, it subsequently declined, reaching 3384.
Presently, we find ourselves in the accumulation phase, poised for distribution. This distribution is anticipated to be substantial, potentially leading to another record high, potentially reaching 3650.
Moving forward, the price could continue towards our target from its current position. Alternatively, there exists a possibility that it may drain the sell-side liquidity and reverse from 3360-3370.
Our take-profit levels are set at 3450, 3490, 3520, and finally, 3600. When entering the market, it is advisable to employ a short time frame. It is important to note that this analysis is merely our opinion, and market conditions may deviate from expectations.
We extend our best wishes for success and safe trading. If you wish to demonstrate your support, you may consider liking, commenting, or sharing this analysis with others.
Sincerely,
Team Setupsfx_
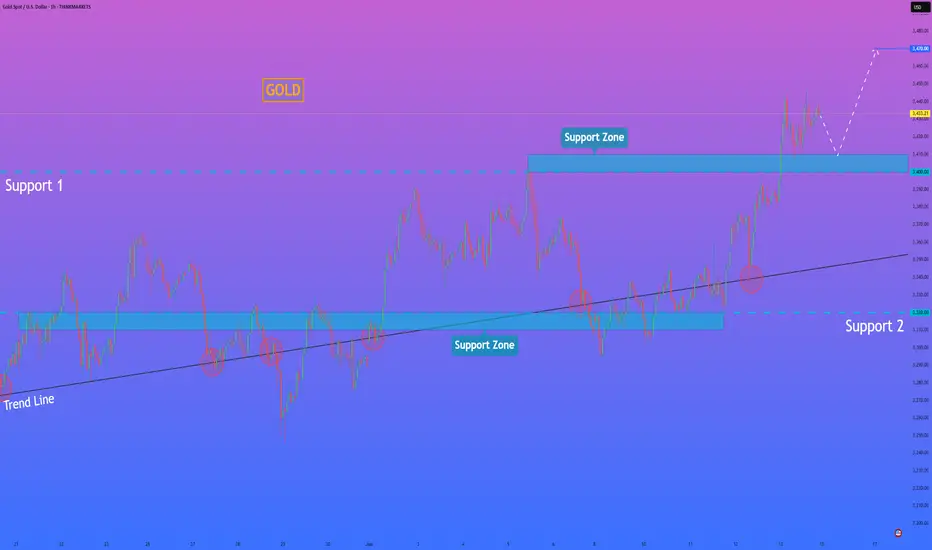
HelenP. I Gold may correct to support zone and then rebound upHi folks today I'm prepared for you Gold analytics. After rebounding from the trend line, XAUUSD began to grow steadily within the rising structure, confidently pushing through local resistance and breaking above the previous support 2 area. This breakout was backed by strong bullish momentum, with the price clearly holding above the broken level, turning it into a support base. Following that surge, the price entered a short-term consolidation, trading within the upper boundary of the chart, just above the 3400 level. This area now acts as a crucial support zone, and the market is currently hovering slightly above it after a local peak. Given the strength of the recent impulse and the confirmation of previous resistance as support, I expect a brief correction to the support zone before a continuation of the bullish move. That’s why I set my current goal at 3470 points — the next potential resistance area where the price may encounter renewed selling pressure after the rally continues. If you like my analytics you may support me with your like/comment ❤️
Disclaimer: As part of ThinkMarkets’ Influencer Program, I am sponsored to share and publish their charts in my analysis.
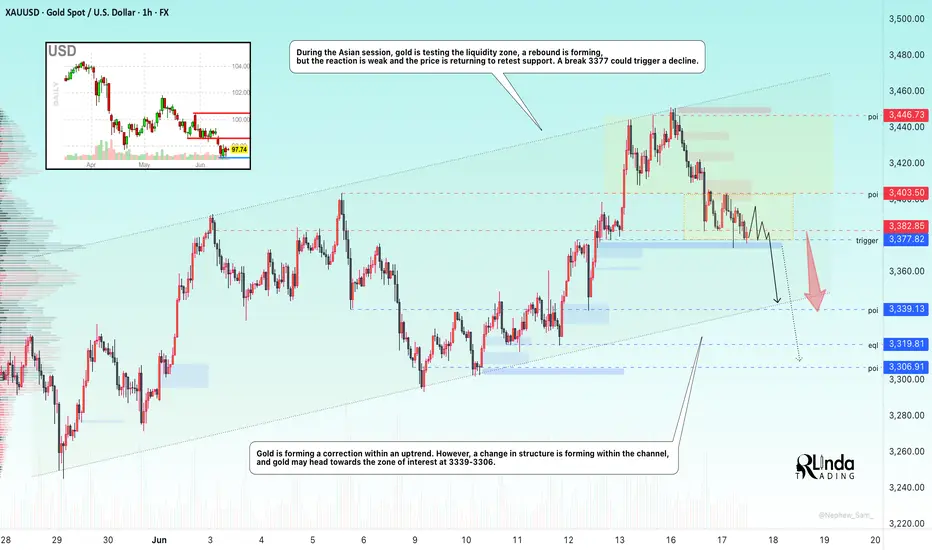
GOLD → Bear pressure. Area of interest: 3340–3306FX:XAUUSD continues to decline under pressure from sell-offs. However, the situation is interesting overall, as there is conflicting data and unexpected price behavior is surprising the market...
On Tuesday, gold is trying to regain the $3,400 level after pulling back from highs, but it is still facing selling pressure and returning to $3,377. The market reaction to the $3,377 level is quite weak, and if the price starts to stick to support, this will lead to a further decline. The dollar is strengthening as a safe-haven currency, holding back gold's growth. The markets are focused on the outcome of the Fed and Bank of Japan meetings, as well as US retail sales data. Any dovish signals from the Fed could support gold and weaken the dollar.
Technically, on D1, gold is returning below the 3382 level (selling zone) and testing 3377. The reaction to the false breakout of support is weak, and the price is forming a pre-breakdown consolidation relative to 3377. There are clear areas of interest that could lure the price before the news. For example, 3343, 3306, 3245.
Resistance levels: 3382, 3403.
Support levels: 3377, 3339, 3320
The bearish structure will be broken if the price strengthens to 3403 and consolidates above that level. This will reinforce buyers' expectations, which could lead to growth. At the moment, I would expect two scenarios: price consolidation within 3377-3403. But technically, the chart shows that there is bearish pressure in the market. The price continues to storm the support level of 3377, which may not hold up against another retest. A break 3377 could lead to a fall to the areas of interest at 3339-3306.
Best regards, R. Linda!
XAU/USD.4h chart pattern.Gold (XAU) buy trade setup:
Trade Setup
Direction: Buy
Entry: 3386
1st Target: 3435
2nd Target: 3500
Stop Loss: Not provided (highly recommended to define this)
Potential Profit
To 1st Target: 3435 - 3386 = 490 points
To 2nd Target: 3500 - 3386 = 1140 points
Recommendation
🔺 Without a stop loss, the risk/reward profile can’t be fully evaluated. Please specify your stop loss to assess trade viability.
🛡️ Suggested Stop Loss (example): If you use 3340, then:
Risk = 3386 - 3340 = 46 points
RR to 1st Target = 49 / 46 ≈ 1.06
RR to 2nd Target = 114 / 46 ≈ 2.48
Would you like help setting an optimal stop loss based on volatility or recent support levels? I can also provide a visual chart analysis if needed.
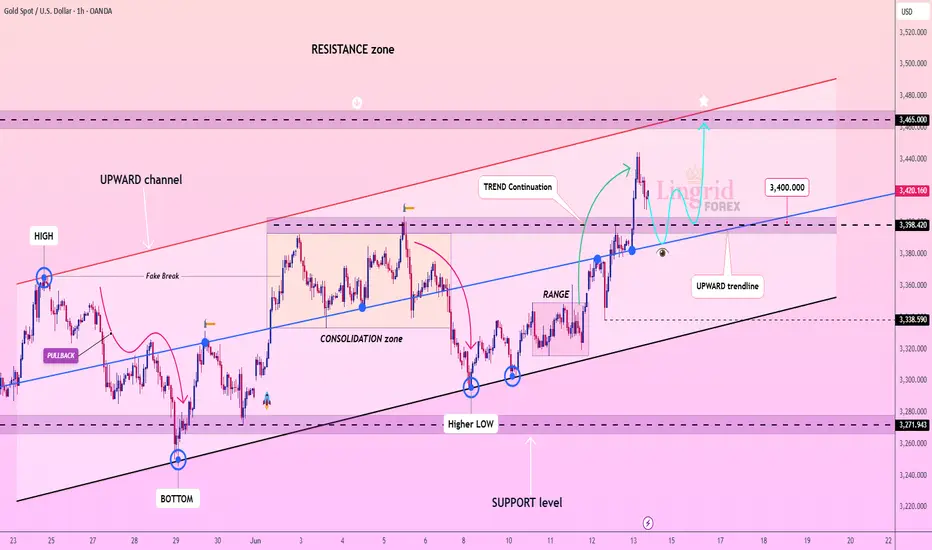
Lingrid | GOLD bullish Extension from the KEY Support ZoneOANDA:XAUUSD is climbing within a clean upward channel after rebounding strongly from the 3338 zone and forming higher lows. The recent breakout above the 3398.4 area signals a trend continuation setup toward the resistance line near 3465. Price is now testing the broken trendline from above, which could act as a launchpad for the next leg up.
📈 Key Levels
Buy zone: 3380–3390
Sell trigger: drop below 3380
Target: 3465
Buy trigger: bounce from 3400 zone with strong volume
💡 Risks
Rejection near 3440 may trigger a false breakout trap
Gold’s momentum may stall if it loses the 3380 trendline
Broader macro data could override technicals near resistance
Traders, if you liked this idea or if you have your own opinion about it, write in the comments. I will be glad 👩💻
#XAUUSD[GOLD]:+2200 Pips Big Move! | Setupsfx_|Gold is currently accumulating in smaller timeframes, which suggests it’s in the early stages of a significant move. It’s possible that the price will reverse from either of the entry zones. There are three take-profit areas you can target, but only if they align with your view. This is an educational post, so please don’t blindly follow it – do your own analysis.
Like and comment for more!
Team Setupsfx_
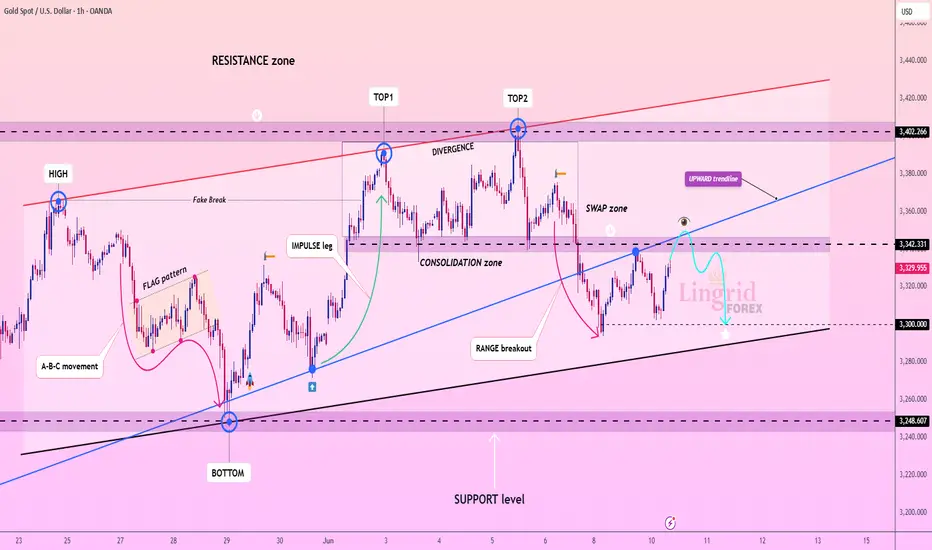
Lingrid | GOLD resistance Swap Zone Shorting OpportunityOANDA:XAUUSD is approaching a critical retest of the broken upward trendline and swap zone near 3342 after failing to maintain resistance above the 3400 area. The prior double top pattern and bearish divergence signal weakening momentum. If the price is rejected at the retest level, a move toward 3300 becomes likely.
📉 Key Levels
Sell trigger: rejection from 3340-3350 with lower high
Buy zone: 3295–3300
Target: 3300 and potentially 3245
Buy trigger: reclaim of 3342 with strong bullish candle
💡 Risks
Breakout above 3342 could reverse structure
Support at 3300 may hold firm on the first test
Weak volume could lead to fake moves in tight consolidation
Traders, if you liked this idea or if you have your own opinion about it, write in the comments. I will be glad 👩💻
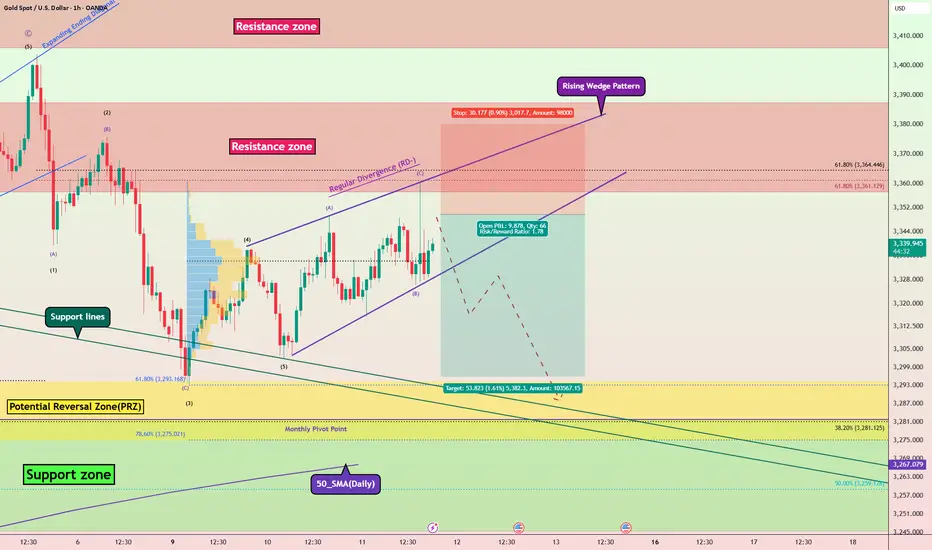
Gold Correction = Bearish Divergence + Wedge + Zigzag CompleteGold ( OANDA:XAUUSD ) attacked the Resistance zone($3,387-$3,357) today after the release of the US CPI indices . Although the figures seemed to be in gold's favor, traders still seem to be determined to continue the price correction.
In terms of Elliott Wave theory , it seems that Gold has managed to complete the Zigzag Correction. We should wait for the next 5 down waves .
Also, we can see the Regular Divergence(RD-) between Consecutive Peaks .
In terms of Classic Technical Analysis , Gold appears to have successfully formed a Rising Wedge Pattern .
I expect Gold to drop to at least $3,296 AFTER breaking the lower line of the Rising Wedge Pattern .
Note: Stop Loss(SL)= $3,380
Gold Analyze ( XAUUSD ), 1-hour time frame.
Be sure to follow the updated ideas.
Do not forget to put a Stop loss for your positions (For every position you want to open).
Please follow your strategy; this is just my idea, and I will gladly see your ideas in this post.
Please do not forget the ✅' like '✅ button 🙏😊 & Share it with your friends; thanks, and Trade safe.
Trading Signals for Gold Sell below $3,443 (21 SMA -7/8 Murrray)The XAU/USD trend remains bullish as long as the price consolidates above 3,384.
Therefore, it would be prudent to buy gold as long as the price consolidates above3,444, where the 7/8 Murray level is located.
Gold's volatility will continue over the next few days, so we believe it could move between 3,386 and 3,356.
Consequently, if gold consolidates and breaks above 3.498, it would be seen as a buying opportunity, with targets at the 8/8 Murray level around 3,600/
Last tow months, gold gapped around 3,498. This will likely be seen as a buying opportunity if the price breaks above the psychological level of $3,439
Conversely, below the R_1 around 3,443, gold will be seen as an opportunity to sell, targeting 3,400 and the bottom of the uptrend channel around 3,338.
The RSI indicator is showing a negative signal, so we must be cautious when buying, as a very strong technical correction could occur.
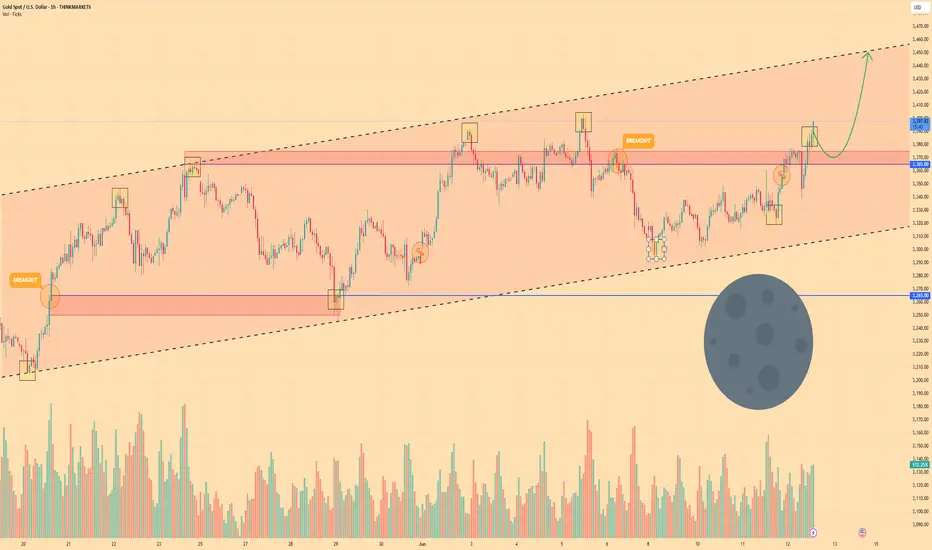
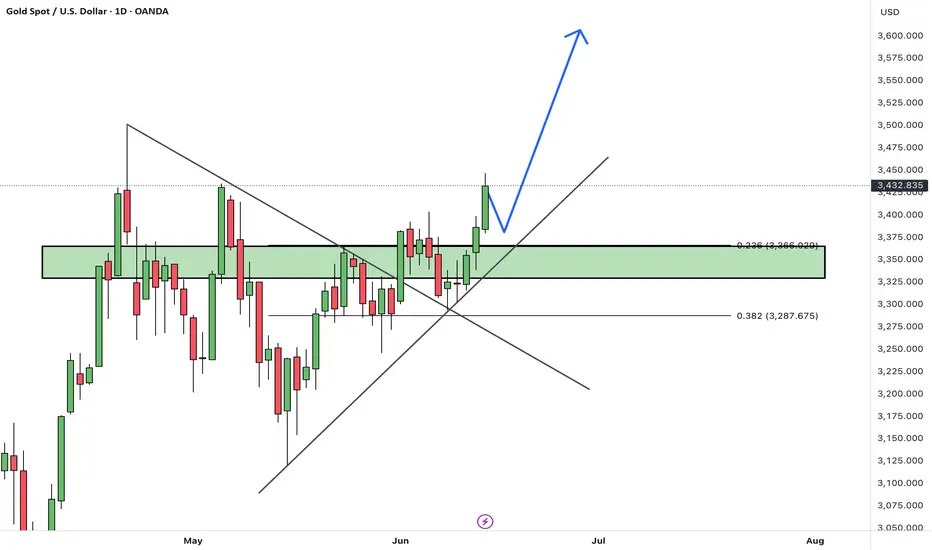
GOLD - Price can correct to support level and then bounce upHi guys, this is my overview for XAUUSD, feel free to check it and write your feedback in comments👊
Gold entered a Rising Channel structure, demonstrating stable growth with higher highs and higher lows.
After testing and breaking through the $3265 support level, the price pulled back slightly and then resumed its upward momentum.
This move confirmed buyer strength and renewed interest in the mid-channel zone.
Recently, Gold successfully retested the $3365–$3375 support area, turning it into a local springboard.
Now price is gaining traction above this zone and appears to be preparing for a continuation of the current trend.
I expect it to rise toward the $3450 target — the upper resistance of the channel.
If this post is useful to you, you can support me with like/boost and advice in comments❤️
Disclaimer: As part of ThinkMarkets’ Influencer Program, I am sponsored to share and publish their charts in my analysis.