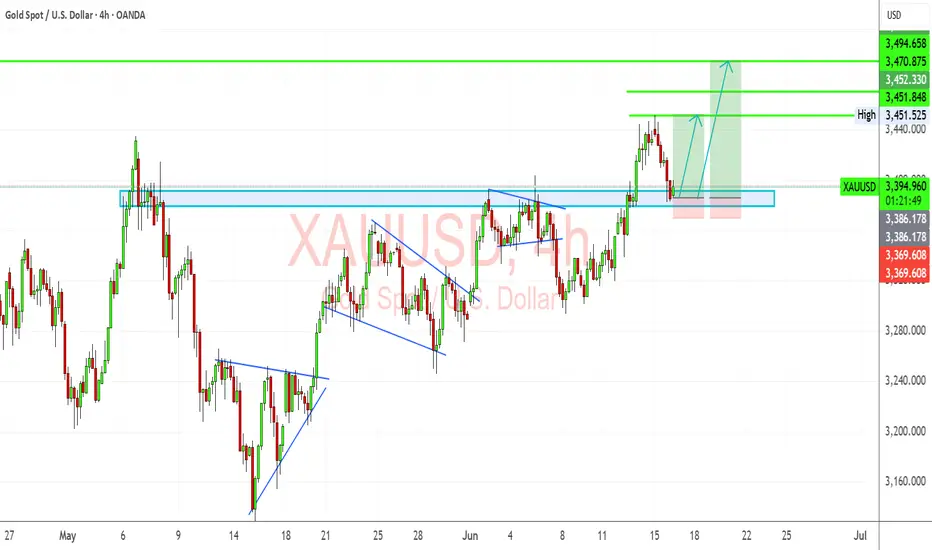
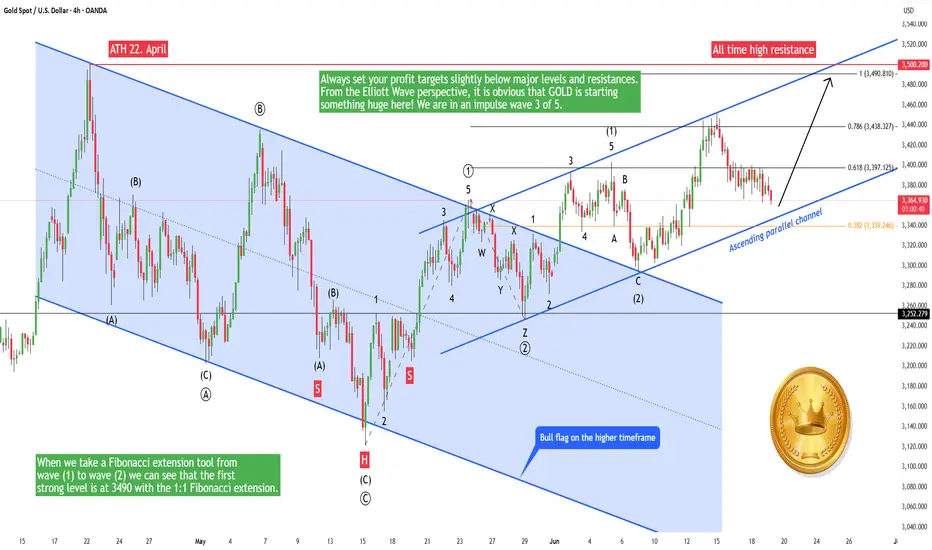
Gold - Pump to a new all-time high, buy here!GOLD is super bullish, and this trend should continue until around 7000 USD, so another few years! In one of my next analyses, I will tell you why. In this short-term analysis, we want to buy GOLD at the strong support of this blue ascending channel.
On the chart we can see that GOLD has been moving in the ascending parallel channel and recently broke out of the bullish flag on the higher timeframe. The bullish flag was retested on June 9, so we don't need to go down anymore. Btw, that was a great buying opportunity! Soon the price will hit the support trendline of the ascending channel, so prepare your buying orders!
What is the profit target? The first strong resistance is the previous all-time high level. If you want to take profit here, that's definitely reasonable. Always set your profit targets slightly below major levels and resistances. From the Elliott Wave perspective, it is obvious that GOLD is starting something huge here! We are in an impulse wave 3 of 5.
Always use fibonacci extension / retracement to find strong levels on charts. I recommend using only 0.382, 0.618, and 1 levels. When we take a Fibonacci extension tool from wave (1) to wave (2) we can see that the first strong level is at 3490 with the 1:1 Fibonacci extension.
Trading tip at the end: "Develop a trading strategy that aligns with your trading persona and risk tolerance." Leave a comment with your gold prediction, I am curious! Trading is not hard if you have a good coach! This is not a trade setup, as there is no stop-loss or profit target. I share my trades privately. Thank you, and I wish you successful trades!
GOLD trade ideas
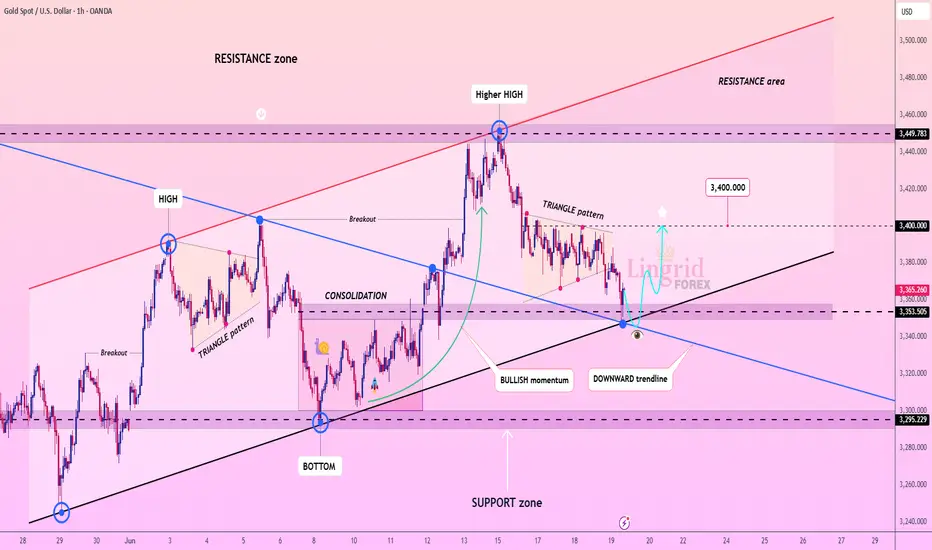
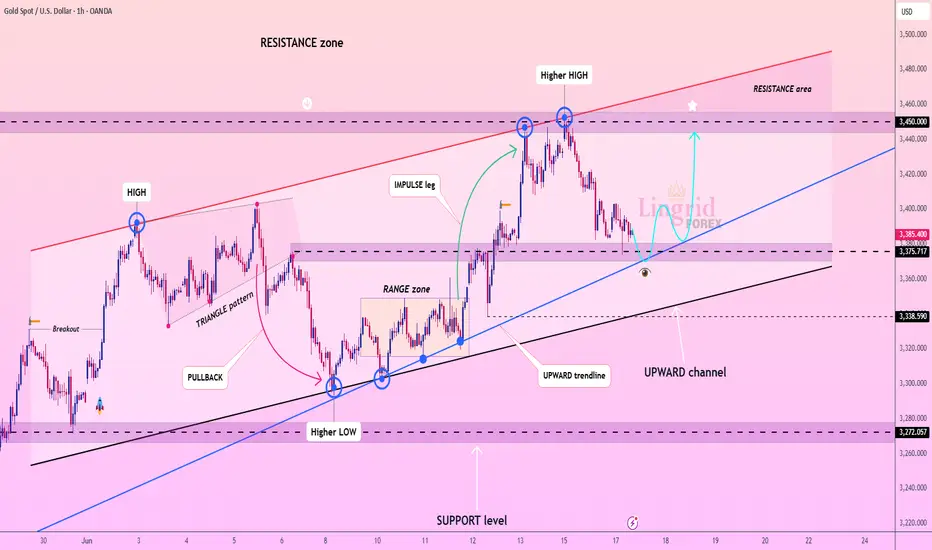
Lingrid | GOLD Post-FOMC Price Creates Trading OpportunityOANDA:XAUUSD is pulling back into the confluence zone between the black trendline and the 3,353–3,355 support, aligning with the breakout zone of a previous triangle pattern. Despite the drop, the overall structure remains bullish, especially if this retest holds. A bounce here would confirm the upward channel continuation toward the 3,400 key level.
📈 Key Levels
Buy zone: 3,350–3,355
Sell trigger: breakdown below 3,353
Target: 3,400
Buy trigger: clear bullish reversal from trendline support
💡 Risks
Break below 3,353 may shift bias to neutral or bearish
Sharp dollar strength could weigh on gold's recovery
Failure to break above the triangle again may trap early buyers
Traders, if you liked this idea or if you have your own opinion about it, write in the comments. I will be glad 👩💻
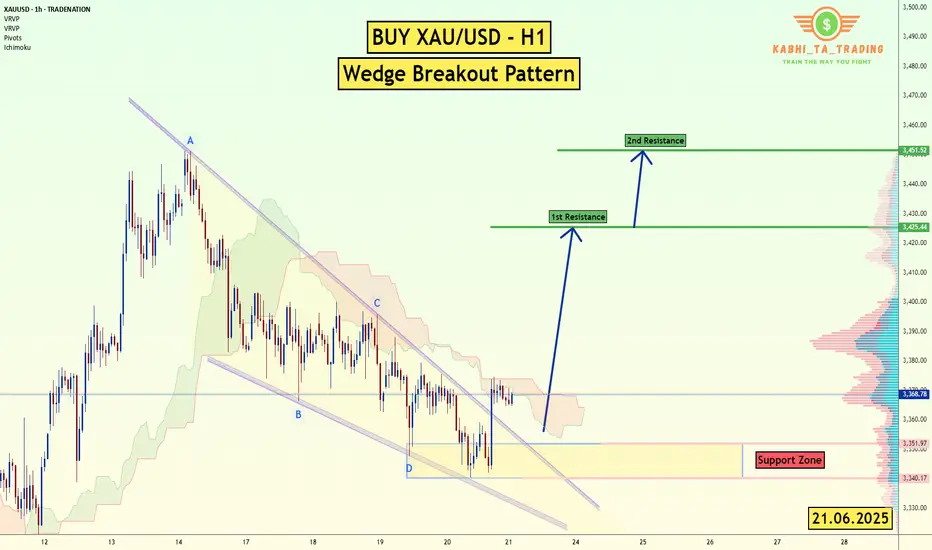
XAU/USD (Gold) - H1 - Wedge Breakout (21.06.2025)The XAU/USD pair on the H1 timeframe presents a Potential Buying Opportunity due to a recent Formation of a Wedge Breakout Pattern. This suggests a shift in momentum towards the upside and a higher likelihood of further advances in the coming Days.
Possible Long Trade:
Entry: Consider Entering A Long Position around Trendline Of The Pattern.
Target Levels:
1st Resistance – 3425
2nd Resistance – 3451
🎁 Please hit the like button and
🎁 Leave a comment to support for My Post !
Your likes and comments are incredibly motivating and will encourage me to share more analysis with you.
Best Regards, KABHI_TA_TRADING
Thank you.
Disclosure: I am part of Trade Nation's Influencer program and receive a monthly fee for using their TradingView charts in my analysis.
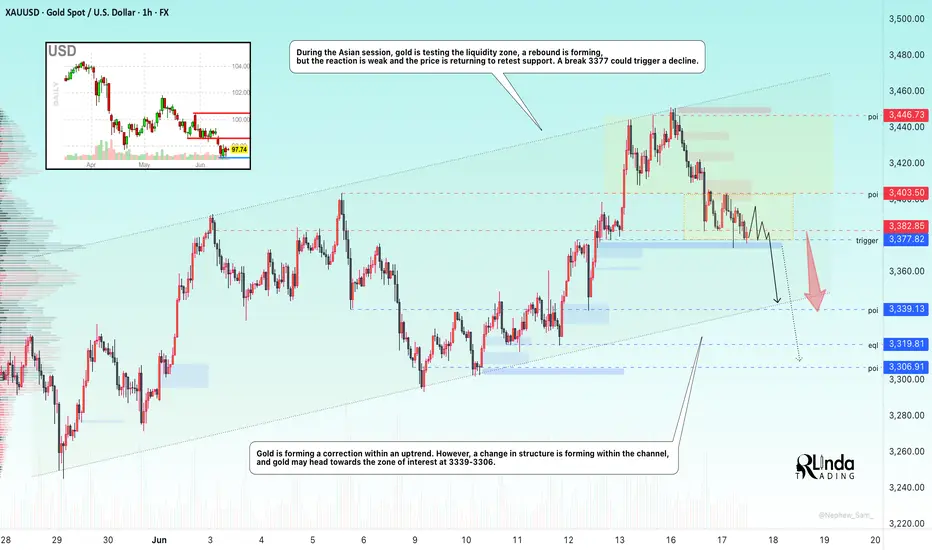
GOLD → Bear pressure. Area of interest: 3340–3306FX:XAUUSD continues to decline under pressure from sell-offs. However, the situation is interesting overall, as there is conflicting data and unexpected price behavior is surprising the market...
On Tuesday, gold is trying to regain the $3,400 level after pulling back from highs, but it is still facing selling pressure and returning to $3,377. The market reaction to the $3,377 level is quite weak, and if the price starts to stick to support, this will lead to a further decline. The dollar is strengthening as a safe-haven currency, holding back gold's growth. The markets are focused on the outcome of the Fed and Bank of Japan meetings, as well as US retail sales data. Any dovish signals from the Fed could support gold and weaken the dollar.
Technically, on D1, gold is returning below the 3382 level (selling zone) and testing 3377. The reaction to the false breakout of support is weak, and the price is forming a pre-breakdown consolidation relative to 3377. There are clear areas of interest that could lure the price before the news. For example, 3343, 3306, 3245.
Resistance levels: 3382, 3403.
Support levels: 3377, 3339, 3320
The bearish structure will be broken if the price strengthens to 3403 and consolidates above that level. This will reinforce buyers' expectations, which could lead to growth. At the moment, I would expect two scenarios: price consolidation within 3377-3403. But technically, the chart shows that there is bearish pressure in the market. The price continues to storm the support level of 3377, which may not hold up against another retest. A break 3377 could lead to a fall to the areas of interest at 3339-3306.
Best regards, R. Linda!
XAUUSD Analysis Today: Technical and Order Flow !In this video I will be sharing my XAUUSD analysis today, by providing my complete technical and order flow analysis, so you can watch it to possibly improve your forex trading skillset. The video is structured in 3 parts, first I will be performing my complete technical analysis, then I will be moving to the COT data analysis, so how the big payers in market are moving their orders, and to do this I will be using my customized proprietary software and then I will be putting together these two different types of analysis.

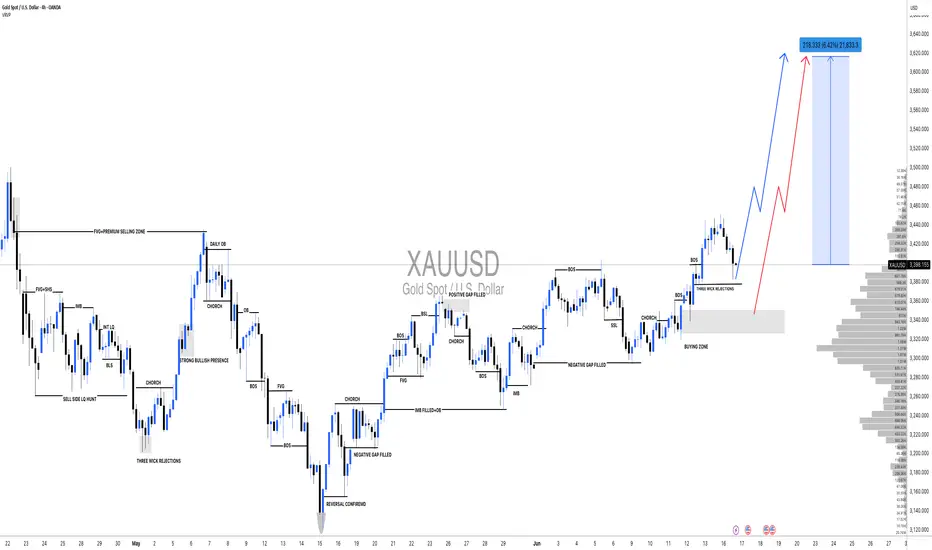
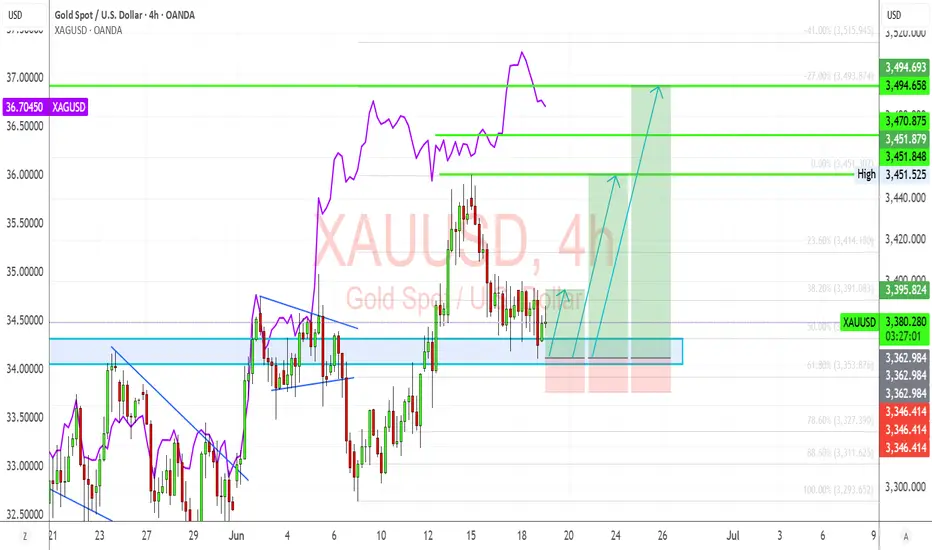
XAUUSD: Accumulation in process,Waiting for Bullish DistributionHello,
Today, we will analyse the key points of each significant move.
Following the price’s all-time high at $3500, it experienced a sharp decline and failed to maintain that level. A substantial 2400 pips would have resulted in significant losses for many accounts. Initially, it was perceived as a minor correction, with the expectation of further price appreciation. However, this assumption proved incorrect. After reaching an even higher peak, the price invariably undergoes a more substantial correction.
At 3260, substantial bullish volume surged into the market, necessitated by the presence of a fair value gap. Subsequently, the price experienced a decline, reflecting the prevailing bearish trend, which favoured the bears. However, at 3200, a pivotal level representing a discounted price point, bull volume surged. This powerful bullish impulse propelled the price to 3432, ultimately confirming the bullish trend. AB=CD there recurring pattern emerged weekly. When the price reached the 3432 level as a fair value gap, the CD pattern commenced.
AB=CDTheHeyIndeed, we have identified a recurring pattern. It appears to be an equal move in any direction, and it has manifested precisely as anticipated. We were aware that the price would reject at 3120, and it did so accordingly. Currently, the market is in our favour. Upon market opening, it exhibited a positive gap, propelling the price to 3450. However, it subsequently declined, reaching 3384.
Presently, we find ourselves in the accumulation phase, poised for distribution. This distribution is anticipated to be substantial, potentially leading to another record high, potentially reaching 3650.
Moving forward, the price could continue towards our target from its current position. Alternatively, there exists a possibility that it may drain the sell-side liquidity and reverse from 3360-3370.
Our take-profit levels are set at 3450, 3490, 3520, and finally, 3600. When entering the market, it is advisable to employ a short time frame. It is important to note that this analysis is merely our opinion, and market conditions may deviate from expectations.
We extend our best wishes for success and safe trading. If you wish to demonstrate your support, you may consider liking, commenting, or sharing this analysis with others.
Sincerely,
Team Setupsfx_
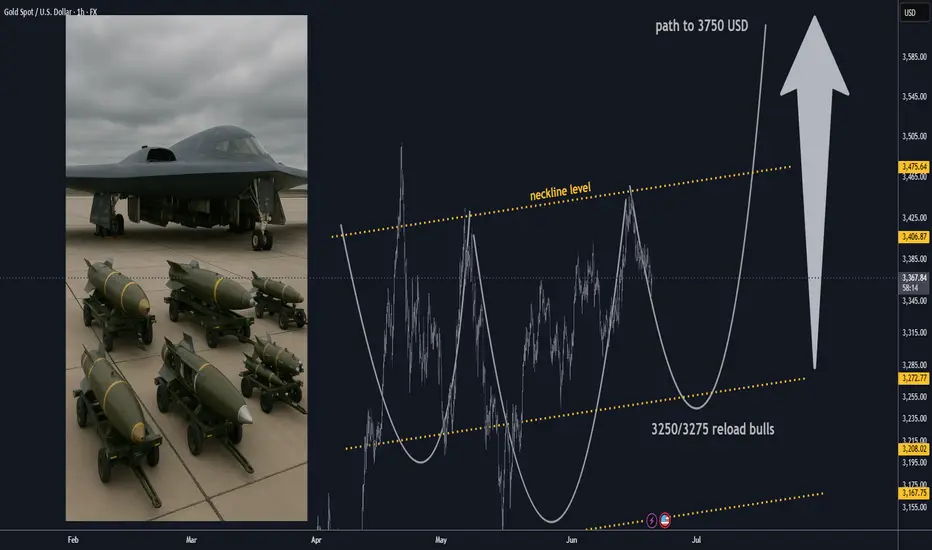
Gold Market Update: Bulls Will target 3750 USD after 3500 USD🏆 Gold Market Mid-Term Update (June 19, 2025)
📊 Price & Technical Outlook
Current Spot Price: ~$3,365
Technical Setup
Inverted H&S pattern forming/completed on higher timeframes — confirms bullish reversal structure.
Reload (buy) zone: $3,250–$3,275 (ideal accumulation range for bulls if price pulls back).
Swing trade setup: Entry: $3,250–$3,275 (reload zone)
Take Profit (TP): $3,750
Support: Major at $3,250–$3,275 (break below = reassess bullish bias).
Resistance: $3,450–$3,500 ; next major resistance: $3,600, then $3,750.
Price consolidating above $3,250–$3,350 is technically healthy — maintaining bullish structure.
🏆 Bull Market Overview
The pullback appears complete; uptrend resumes amid strong macro/geopolitical drivers (inflation, rates, safe haven flows).
Key Levels: $3,000 (macro support), $3,250 (bulls must defend), $3,500 (breakout zone), $3,750 (swing TP).
Short-term dips = buying opportunities — “Buy the Dip” remains favored as long as support holds. Upside targets: Immediate: $3,600 Swing target: $3,750
Summary:
Gold remains in a bullish mid-term structure, with the inverted H&S pattern pointing to higher prices ahead. Bulls look to reload at $3,250–$3,275, targeting $3,750 for swing trades. As long as $3,180–$3,200 holds, buying dips is the play. A sustained breakout above $3,400–$3,600 opens the door for new all-time highs.
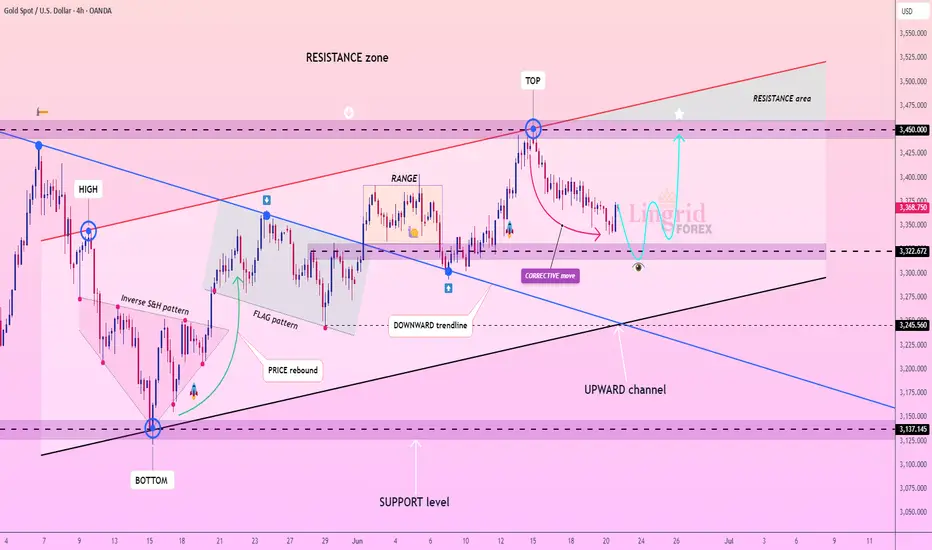
Lingrid | GOLD Weekly Outlook: Corrective Phase Tests SupportOANDA:XAUUSD experienced a notable pullback this week, retreating from the $3,450 resistance zone as profit-taking emerged following the recent geopolitical rally. The market appears to be entering a healthy corrective phase after the strong upward momentum driven by Middle Eastern tensions and safe-haven demand.
The 4H chart reveals gold testing the critical $3,320 support level, which coincides with the lower boundary of the established upward channel. This corrective move was anticipated after the sharp rally to the resistance area marked as "TOP" on the chart. The current price action suggests a natural retracement within the broader bullish structure.
Technically, the downward trendline from the recent high is being respected, indicating the correction may continue toward the $3,240-$3,270 range before finding stronger support. The flag pattern that previously drove the rally now serves as a reference point for this pullback phase.
Key levels to monitor include the $3,320 immediate support and the more substantial $3,200 level below. A decisive break below these supports could extend the correction further, while a bounce from current levels would reinforce the underlying bullish bias. The market remains within the broader upward channel, suggesting this correction is likely temporary before the next leg higher toward the resistance zone above $3,450.
Traders, if you liked this idea or if you have your own opinion about it, write in the comments.
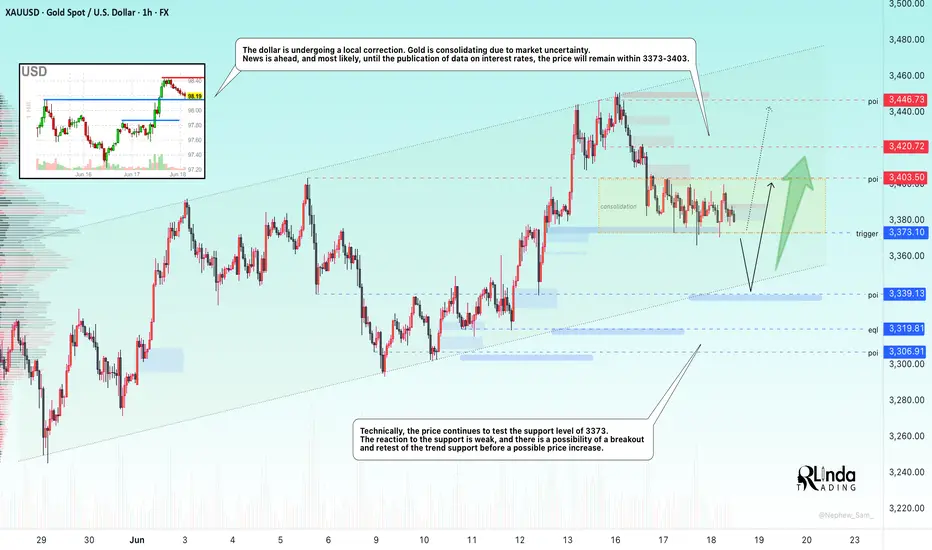
GOLD → Consolidation. Awaiting the FOMC meetingFX:XAUUSD is consolidating in the range of 3403 - 3373. The problem is that there is news ahead. FOMC and interest rate meeting. The market may react in any unpredictable way...
On Wednesday, the price of gold retreated from $3,400 as sentiment stabilized and investors focused on the upcoming Fed decision. Tensions in the Middle East remain high, but there is less panic in the markets. The Fed is expected to leave rates unchanged. The focus is on forecasts for rates, growth, and inflation. Dovish signals could support gold and weaken the dollar. If the Fed is more cautious due to oil and the conflict in the Middle East, the dollar could rise and gold could fall.
Technical nuances are irrelevant in this case, as price behavior depends on the market's interpretation of fundamental factors.
Resistance levels: 3403, 3420
Support levels: 3373, 3339
BUT! Technically, I would say that there is pressure from the bears. The price is compressing towards the support level of 3373.
The market remains unbalanced in favor of buyers, and it is logical that market makers will be interested in testing the trend support zone or the 3339 level (due to the liquidity pool) before continuing to rise (gold may continue to rise both if rates are lowered and if they remain at the same level. However, the tone of the Fed will play a major role here)
Best regards, R. Linda!
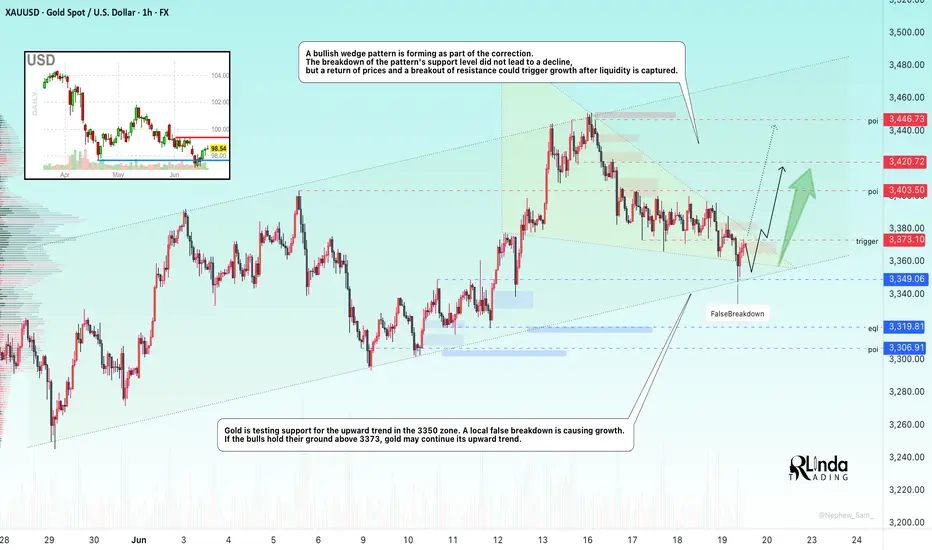
GOLD → Continuation of the global trend... To 3350?FX:XAUUSD is testing trend support within a correction. Against a complex fundamental backdrop (the Middle East, Fed comments, Trump's desire to lower rates), the price may continue to rise.
The price of gold rose from a weekly low of $3,363 on Thursday thanks to increased demand for safe-haven assets following reports of possible US strikes on Iran. Markets are ignoring the Fed's hawkish decision to maintain its tight policy and rate forecasts. Traders are waiting for new signals from the Middle East, given the risk of increased volatility due to low liquidity in connection with the US holiday.
Technically, a bullish wedge pattern is forming as part of the correction. The breakdown of the pattern's support did not lead to a decline, but a return of prices and a breakout of resistance could trigger growth after liquidity returns.
Resistance levels: 3373, 3403, 3420
Support levels: 3349, 3320
Before growth, a retest of the trend support or the 3350 zone is possible. However, if the price goes above 3375 and the bulls hold their ground above this level, then we can expect growth to continue within the trend.
Best regards, R. Linda!
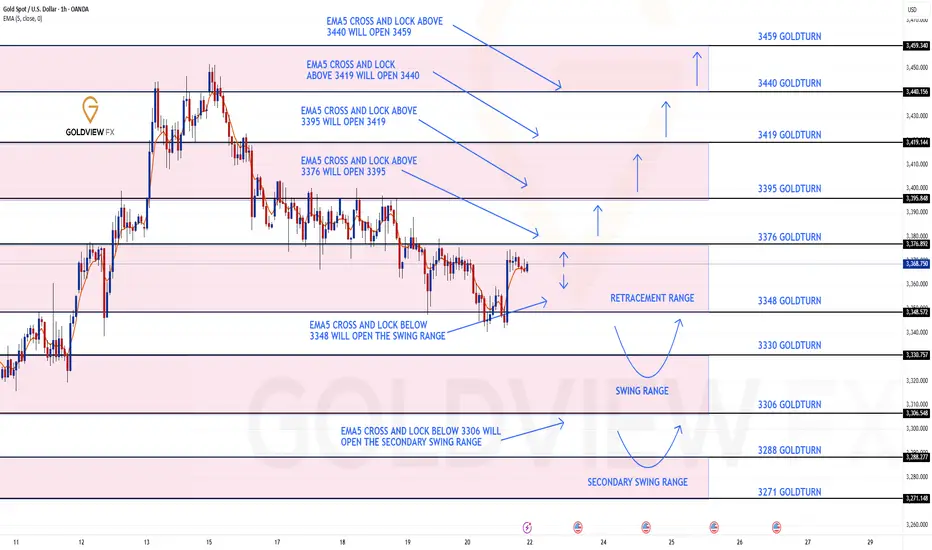
GOLD 1H CHART ROUTE MAP UPDATE & TRADING PLAN FOR THE WEEKHey Everyone,
Please see our updated 1h chart levels and targets for the coming week.
We are seeing price play between two weighted levels with a gap above at 3376 and a gap below at 3348. We will need to see ema5 cross and lock on either weighted level to determine the next range.
We will see levels tested side by side until one of the weighted levels break and lock to confirm direction for the next range.
We will keep the above in mind when taking buys from dips. Our updated levels and weighted levels will allow us to track the movement down and then catch bounces up.
We will continue to buy dips using our support levels taking 20 to 40 pips. As stated before each of our level structures give 20 to 40 pip bounces, which is enough for a nice entry and exit. If you back test the levels we shared every week for the past 24 months, you can see how effectively they were used to trade with or against short/mid term swings and trends.
The swing range give bigger bounces then our weighted levels that's the difference between weighted levels and swing ranges.
BULLISH TARGET
3376
EMA5 CROSS AND LOCK ABOVE 3376 WILL OPEN THE FOLLOWING BULLISH TARGETS
3395
EMA5 CROSS AND LOCK ABOVE 3395 WILL OPEN THE FOLLOWING BULLISH TARGET
3419
EMA5 CROSS AND LOCK ABOVE 3419 WILL OPEN THE FOLLOWING BULLISH TARGET
3440
BEARISH TARGETS
3348
EMA5 CROSS AND LOCK BELOW 3348 WILL OPEN THE SWING RANGE
3330
3306
EMA5 CROSS AND LOCK BELOW 3306 WILL OPEN THE SECONDARY SWING RANGE
3288
3271
As always, we will keep you all updated with regular updates throughout the week and how we manage the active ideas and setups. Thank you all for your likes, comments and follows, we really appreciate it!
Mr Gold
GoldViewFX
Hellena | GOLD (4H): LONG to resistance area of 3500 (Wave 3).Colleagues, the correction did take place and was quite deep, as I wrote earlier.
However, I am leaving my target unchanged—the resistance area and the maximum of wave “3” of the higher order at 3500.
The waves remain in their previous places, because none of the rules of wave analysis have been violated.
Manage your capital correctly and competently! Only enter trades based on reliable patterns!

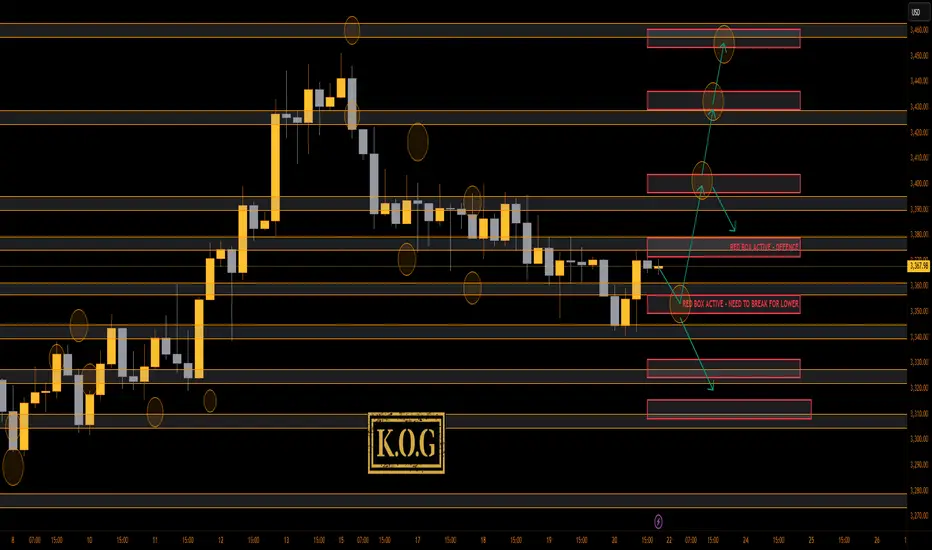
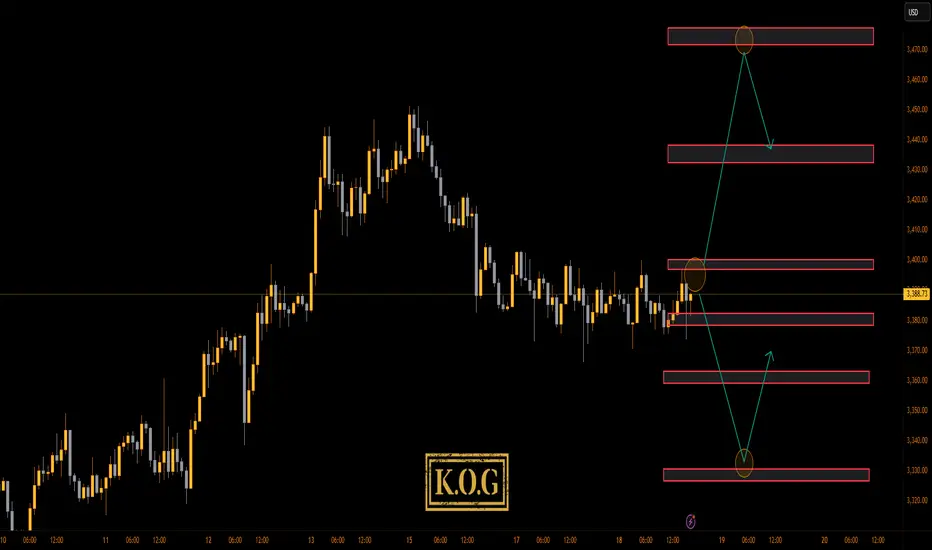
THE KOG REPORTTHE KOG REPORT:
In last week’s KOG Report we said we would be ideally be looking for the market to open, give us a high into that red box region 3455-60 and then give the reaction we wanted for the short trade. We didn’t quite hit that level falling just shy, but the move did present itself and as you can see all the bearish below red box targets were completed as well as KOG’s bias of the week targets which was bearish below 3465.
We then posted the FOMC KOG Report in which we suggested looking for price to continue the move as long as the bias level stood, which it did and we got another move downside, but again, falling just shy of the level we wanted to then attempt that swing long.
So, what can we expect in the week ahead?
As we suggested on Friday, it would be a good idea for traders to be sitting neutral on the markets with minimum to zero exposure anticipating gaps and glitches across the markets on open. This news was expected so those who played discipline should be cash in account, which is also a position in the markets.
We have key levels now 3350-55 support with extension 3340 which will need to break downside for us to go lower, while support there should take us up towards the 3385-90 level initially, which is the level to look for a potential RIP for the scalp short. This will give us the flip, red box activation 3380-75 which if held should allow us to complete the move to break through the 3400 level with red box target 3445 and above that 3451. This is based on there being a completely aggressive move from the open upside.
On the flip, break below key level here 3335 and 3320 is the first level to consider which will continue the path we wanted from last week. Ideally, not for this news and potential for this to spike upside, we would have stuck with the plan from last week. Difference now, we need more buyers higher up and a potential test on that high again.
Key Levels:
Red box defence 3375-80, needs to be broken
Red box defence 3350, needs to be broken
KOG’s bias of the week:
Bullish above 3340 with targets above 3375, 3390, 3395 and above that 3410
Bearish on break of 3340 with targets below 3330, 3320, 3310, 3306 and below that 3298
RED BOX TARGETS:
Break above 3375 for 3378, 3390, 3395, 3406, 3410 and 3419 in extension of the move
Break below 3365 for 3355, 3350, 3340, 3336, 3330 and 3323 in extension of the move
Please do support us by hitting the like button, leaving a comment, and giving us a follow. We’ve been doing this for a long time now providing traders with in-depth free analysis on Gold, so your likes and comments are very much appreciated.
As always, trade safe.
KOG
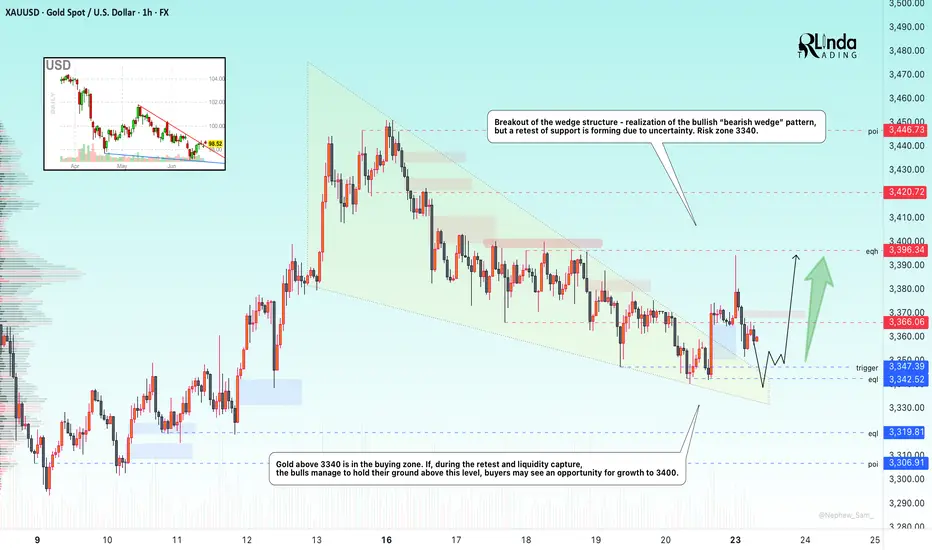
GOLD → Risk zone 3340. Sell-off after rallyFX:XAUUSD , after breaking out of its accumulation phase, rallied towards the 3400 zone of interest, but failed to reach liquidity and reversed, selling off its gains due to economic uncertainty.
In my opinion, the market is unexpectedly subdued and has reacted very weakly to geopolitical problems in the Middle East. The market has digested the news of US airstrikes on Iranian nuclear facilities and is awaiting PMI data from the US and the eurozone, Fed statements, US GDP and other macroeconomic data. The uncertainty factor has done its job... Participants fear further escalation of the conflict, but so far Iran has refrained from taking drastic steps, which has reduced demand for gold as a safe haven asset. Geopolitics and macro statistics remain in focus.
Technically, gold is trading above 3340 (in the buy zone). A retest of the liquidity zone is possible, and if buyers keep the market above 3340-3350, the price may continue to rise.
Support levels: 3347, 3342, 3320
Resistance levels: 3366, 3396
On D1, the key level is the 3340-3347 area. At the moment, we are seeing a sell-off and a move to retest support. Accordingly, a false breakdown and price holding above 3340, followed by a change in character and a breakdown of the bullish structure, will hint at growth. But if the reaction at 3340 is weak and the market continues to storm this support, then in this case, the metal could drop to 3300
Best regards, R. Linda!
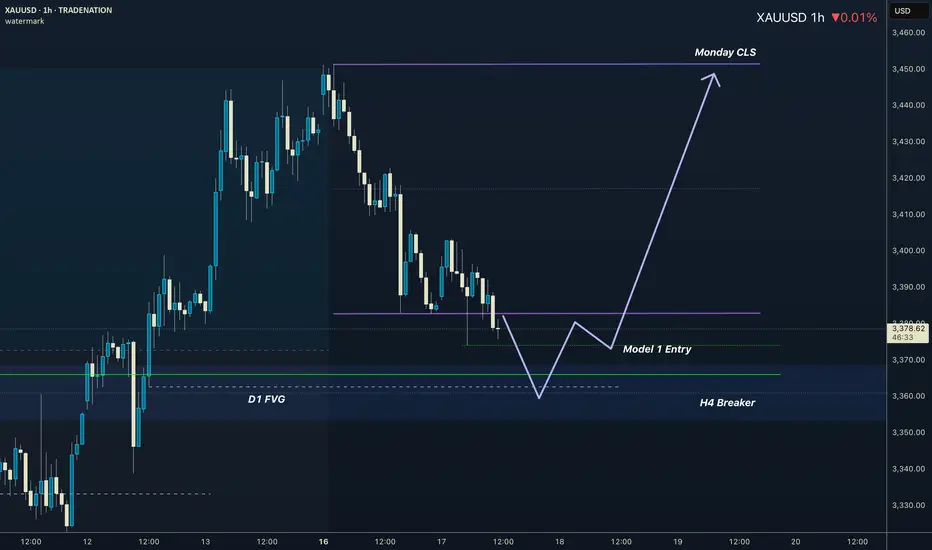
GOLD I Monday CLS I KL - OB/FVG I Target Monday CLS HighsHey, Market Warriors, here is another outlook on this instrument
If you’ve been following me, you already know every setup you see is built around a CLS Footprint, a Key Level, Liquidity and a specific execution model.
If you haven't followed me yet, start now.
My trading system is completely mechanical — designed to remove emotions, opinions, and impulsive decisions. No messy diagonal lines. No random drawings. Just clarity, structure, and execution.
🧩 What is CLS?
CLS is real smart money — the combined power of major investment banks and central banks moving over 6.5 trillion dollars a day. Understanding their operations is key to markets.
✅ Understanding the behavior of CLS allows you to position yourself with the giants during the market manipulations — leading to buying lows and selling highs - cleaner entries, clearer exits, and consistent profits.
📍 Model 1
is right after the manipulation of the CLS candle when CIOD occurs, and we are targeting 50% of the CLS range. H4 CLS ranges supported by HTF go straight to the opposing range.
Analysis done on the Tradenation Charts
Disclosure: I am part of Trade Nation's Influencer program and receive a monthly fee for using their TradingView charts in my analysis.
"Adapt what is useful, reject what is useless, and add what is specifically your own."
— David Perk aka Dave FX Hunter ⚔️
👍 Hit like if you find this analysis helpful, and don't hesitate to comment with your opinions, charts or any questions.
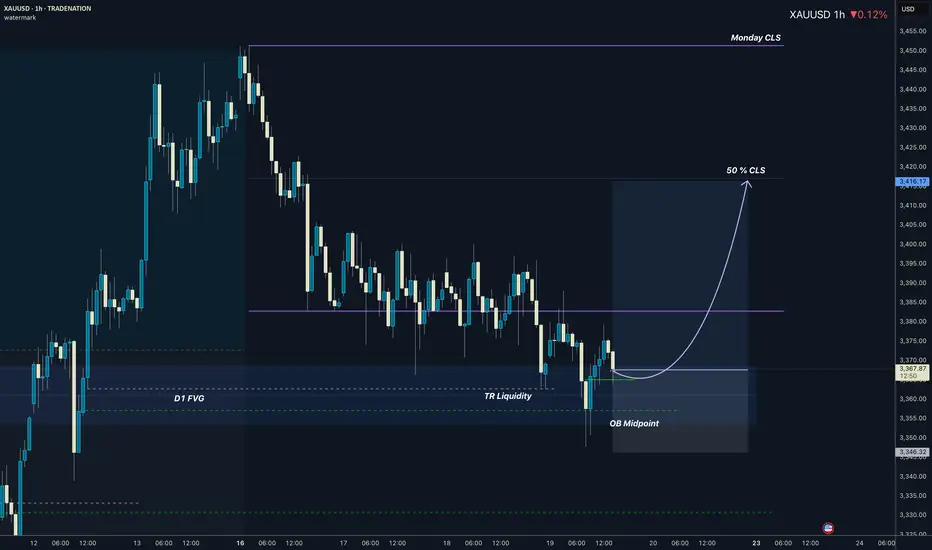
XAUUSD I Daily CLS I D1 FVG / OB Midpoint confluenceHey, Market Warriors, here is another outlook on this instrument
If you’ve been following me, you already know every setup you see is built around a CLS Footprint, a Key Level, Liquidity and a specific execution model.
If you haven't followed me yet, start now.
My trading system is completely mechanical — designed to remove emotions, opinions, and impulsive decisions. No messy diagonal lines. No random drawings. Just clarity, structure, and execution.
🧩 What is CLS?
CLS is real smart money — the combined power of major investment banks and central banks moving over 6.5 trillion dollars a day. Understanding their operations is key to markets.
✅ Understanding the behavior of CLS allows you to position yourself with the giants during the market manipulations — leading to buying lows and selling highs - cleaner entries, clearer exits, and consistent profits.
📍 Model 1
is right after the manipulation of the CLS candle when CIOD occurs, and we are targeting 50% of the CLS range. H4 CLS ranges supported by HTF go straight to the opposing range.
Analysis done on the Tradenation Charts
Disclosure: I am part of Trade Nation's Influencer program and receive a monthly fee for using their TradingView charts in my analysis.
"Adapt what is useful, reject what is useless, and add what is specifically your own."
— David Perk aka Dave FX Hunter ⚔️
👍 Hit like if you find this analysis helpful, and don't hesitate to comment with your opinions, charts or any questions.
Lingrid | GOLD corrective Pullback Presents Potential Long EntryOANDA:XAUUSD is retracing from a double top inside the resistance area near 3450 but remains above the key 3375 support and the ascending channel structure. Price is testing the confluence of the upward trendline and prior breakout level, creating a possible bullish rebound setup. A successful bounce here could ignite momentum toward the 3450–3470 zone.
📈 Key Levels
Buy zone: 3370–3375
Sell trigger: loss of 3360 support
Target: 3450
Buy trigger: breakout above 3400 and hold with strong candle close
💡 Risks
A close below the upward channel could trigger deeper sell-off
Failure to reclaim 3400 may trap bulls in consolidation
Macro catalysts (Fed, CPI) could override local structure
Traders, if you liked this idea or if you have your own opinion about it, write in the comments. I will be glad 👩💻
THE KOG REPORT - FOMCTHE KOG REPORT – FOMC
This is our view for FOMC, please do your own research and analysis to make an informed decision on the markets. It is not recommended you try to trade the event if you have less than 6 months trading experience and have a trusted risk strategy in place. The markets are extremely volatile, and these events can cause aggressive swings in price.
A you can see traders the pre-event price action started yesterday with the hourly now playing between the MA’s and waiting for FOMC for a potential breakout. As usual, we have highlighted the key levels and added the red boxes for all of you to help navigate the movement should this not be priced in.
Also remember, there is a press conference after the release, this is usually the time the market will react to anything Powell says about future plans for the economy.
Now, looking at the 4H, we have support at the 3370-65 level and below that 3355. If these are attacked and give a RIP, opportunity for the long trade may be available into the 3395 red box which price will need to break to go higher. If we can break above this red box, we can then look to attempt higher price with the levels 3430, 3445 and above that 3455-60 on the horizon. It’s that red box sitting higher up around the 3470-75 region which needs to be watched if we do get up there as an opportunity to attempt the reverse trade may present itself from there depending on the volume.
So in summary, we have 3 key levels in play, ideally a move upside and rejection from the 3400-6 level giving a further dip would suit buyers to get better pricing.
KOG’s RED BOX TARGETS:
BREAK ABOVE 3395 for 3404, 3406, 3410, 3420, 3430, 3435 and 3459 in extension of the move
BREAK BELOW 3380 FOR 3375, 3364, 3351, 3342, 3333 AND 3327 IN EXTENSION OF THE MOVE
LEARN AND GENERATE YOUR OWN SIGNALS. You don't need any of us to guide you.
Please do support us by hitting the like button, leaving a comment, and giving us a follow. We’ve been doing this for a long time now providing traders with in-depth free analysis on Gold, so your likes and comments are very much appreciated.
As always, trade safe.
KOG
Gold is Nearing an Important Support!!Hey Traders, in today's trading session we are monitoring XAUUSD for a buying opportunity around 3,360 zone, Gold is trading in an uptrend and currently is in a correction phase in which it is approaching the trend at 3,360 support and resistance area.
Trade safe, Joe.
Gold Ready to Shine Again? Watch This Battle Zone Closely!Gold is consolidating above the 50% retracement (3372) after defending key structure at 3368–3378. Bullish momentum is building as Silver continues to lead, and the US Dollar (DXY) weakens post-FOMC. If buyers step in here, we could see a clean breakout toward 3415–3450 and beyond. But if 3368 breaks, the bull case is temporarily invalidated.
🧭 Technical Highlights:
✅ Support Zone: 3368–3378 (Fibonacci + bullish order block)
✅ Resistance Targets: 3395, 3415.84, 3451.84, 3470+
🔄 Silver Divergence: XAGUSD broke higher → leading XAU bullishly
🔼 Bias: Bullish (as long as 3368 holds)
🌐 Fundamental Drivers:
🏦 Fed dot plot turns dovish – Only 1–2 cuts, but no hikes planned; supports gold upside.
⚔️ Middle East tensions rising – Iran vs. Israel/US rhetoric keeps risk premium high.
📉 DXY weakens after Powell avoided hawkish tone; real yields remain capped.
💬 Silver outperforming on safe-haven + industrial hedge flows.
💡 Trading Plan Summary:
Buy Zone: 3372–3380
TP Zones: 3395, 3415, 3450+
Invalidation: Close below 3368
Confirmation: Break and close above 3395 with volume = signal to scale in
🔔 Keep an eye on:
US Jobless Claims, SNB & BoE Decisions
DXY 98.70 key level
Silver reaction near 36.70–37.20
XAU/USD) Back Bullish trand Read The captionSMC Trading point update
Technical analysis of Gold (XAU/USD) on the 3-hour timeframe based on a price action setup within a rising channel and a key support zone. Here's a breakdown of the analysis:
---
Technical Overview:
Trend Structure:
The price is moving within a rising channel (marked by the black trendlines). Recent touches on both the top and bottom of the channel suggest that it is being respected.
Key Support Zone (Yellow Box):
Price recently tested a strong support zone around $3,338 – $3,350, which aligns with:
Historical price reaction area.
The 200 EMA (blue line).
An uptrend line support.
A bullish reaction (green arrow) confirming demand.
Bear Trap Breakout:
There’s a false breakout below the support followed by a sharp reversal (green arrow), which could indicate a bear trap, often followed by a bullish rally.
Price Projection:
The projected move suggests a bullish rally toward $3,478.89, offering a potential 3.97% gain (~133 points).
The path includes a possible consolidation before a breakout (illustrated by the wavy arrow).
RSI Indicator:
RSI is recovering from the oversold zone (~45), indicating increasing bullish momentum.
Mr SMC Trading point
---
Trade Idea Summary:
Bias: Bullish
Entry Zone: Around $3,350–$3,370 (post-retest of support)
Target: $3,478.89
Confirmation: Bullish price action at support, 200 EMA bounce, RSI reversal
---
Please support boost 🚀 this analysis)

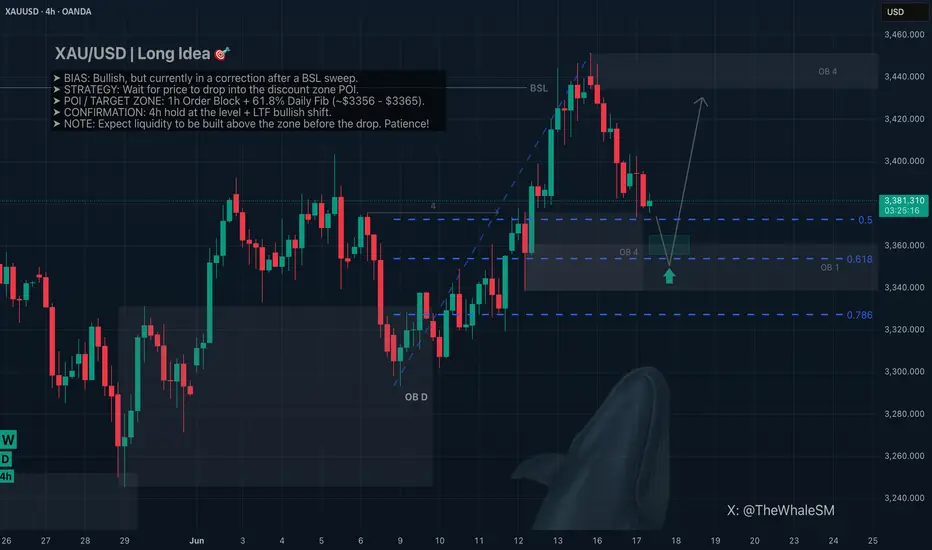
Gold's Next Move Up: Why I'm Waiting for This 1H Order Block.Hello, traders! 👋 Let's take a look at the current price action on Gold (XAU/USD).
📉 Current Situation: Correction Phase
After a strong impulse that swept the Buy Side Liquidity (BSL), Gold has entered a correction. This corrective move has a clear target below: a key 1-hour order block that aligns with the 61.8% daily Fibonacci level. This area acts as strong support and a potential reversal zone for the continuation of the uptrend.
⚠️ Patience is Key
Price has not yet reached a safe discount zone for considering long positions. This is where the "whale's" Point of Interest (POI) lies. It's highly probable that large players will deliver the price to this zone to "refuel" (mitigate their positions) before continuing the move up, or at least to test the manipulation that swept the initial BSL.
My Trading Plan
🎯 The Long Setup
The primary condition for considering a long setup from the $3356 - $3365 area is:
Mitigation of the 1-hour order block.
The 61.8% Fib level must hold with a clear reversal reaction on at least the 4-hour timeframe.
I don't expect this to happen today. It's likely that price will first build liquidity above our POI before dropping into it. Only from that zone, and with LTF confirmation, can we consider safer long positions.
This is not financial advice. My analysis is for educational purposes only.
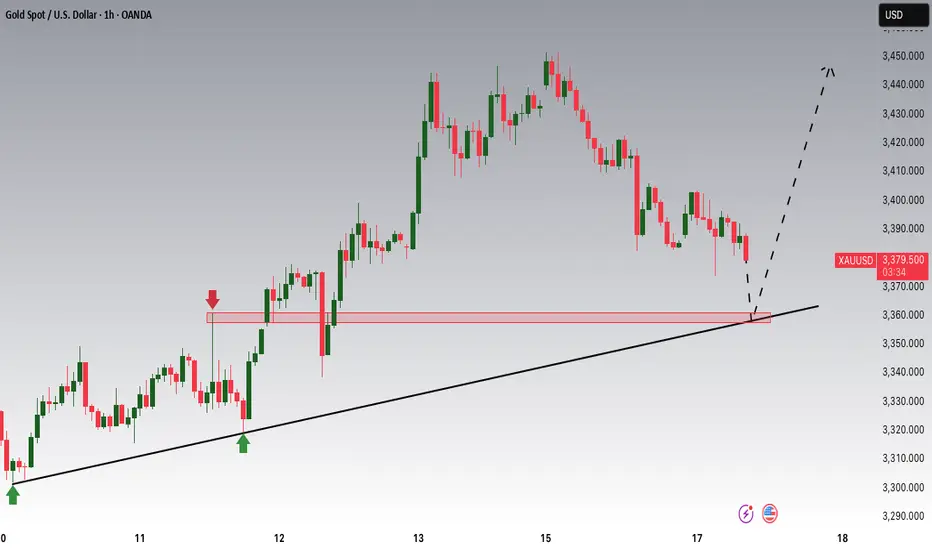
XAUUSD Long Setup – Retest of Broken Structure & Safe-Haven FlowGold has pulled back to retest a strong former resistance (now support) zone around $3,385–$3,390. This level aligns with a previous breakout and marks the neckline of an inverted head-and-shoulders pattern. The pair is now showing bullish structure with back-to-back continuation patterns (bull flags), suggesting further upside potential.
Given escalating geopolitical risk (Iran-Israel strikes, Trump-led evacuation urgency), slowing Fed cut expectations, and softening inflation-adjusted yields, gold remains in demand.
🔍 Technical Analysis:
Structure: Higher highs and higher lows maintained.
Support Zone: $3,385–$3,390 (retest zone) – bulls stepping back in.
Targets:
TP1: $3,451
TP2: $3,470
TP3: $3,495 (new local high)
Stop Loss: Below $3,369 (recent low)
Pattern Context: Bull flags continue to form and break bullish – reinforcing trend.
🧠 Fundamental Context (June 17):
Bullish Drivers:
Middle East escalation → safe haven bid surging (Iran missile launches, Israeli retaliation, US political chaos).
Fed on pause → real yields are subdued, favoring non-yielding assets like gold.
Convexity & bond volatility rising → investors hedging with hard assets (confirmed via CME sentiment reports).
Risks:
Sudden peace deal or ceasefire.
Unexpected US CPI spike → reawakens rate hike fears.
📅 Key Events to Watch:
Fed speeches (confirmation of dovish tone)
Any ceasefire or major diplomatic development
Oil movement (energy risk spillovers)