XAUUSD August 2025 Monthly OutlookWelcome to August — and welcome to the top of the macro ladder. Gold is not just rising. It’s rewriting structure.
🔸 Macro & Fundamentals
Gold opens August with a fresh impulsive breakout above $3360, fuelled by a weaker USD, rising global risk sentiment, and continued speculative positioning from institutional buyers. The upcoming Jackson Hole meeting and shifting Federal Reserve expectations create the perfect climate for volatility. All eyes are now on the premium structure top — but will gold expand beyond it or retrace to refill?
🔸 Monthly Trend & Bias (HTF Overview)
🔹 Structure: Clean bullish BOS, continuation leg in progress
🔹 Last CHoCH: April 2023 → Confirmed full trend shift bullish
🔹 Current Monthly Candle: Explosive push into supply with top wick rejection beginning to show
🔹 Bias: Still bullish but in extreme premium — watch for cooling/rebalancing
🔸 EMA Structure
| EMA Type | Status | Signal |
| ----------- | -------------- | ------------------------------------- |
| EMA 5 / 21 | Strong Bullish | Dynamic expansion, steep angle upward
| EMA 50 | Below | Clean breakout from range
| EMA 100/200 | Far below | Long-term uptrend deeply intact
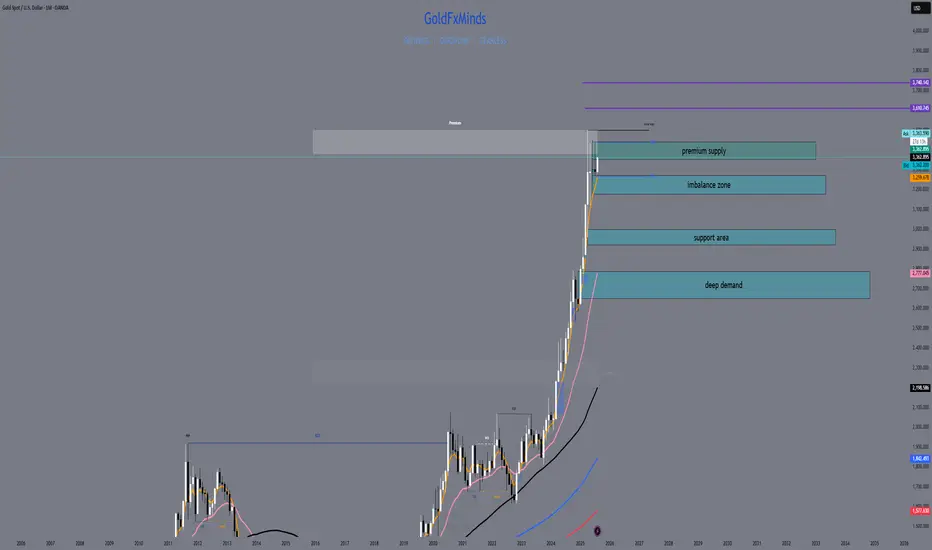
🔸 Key HTF Levels (Wick-to-Wick Mapping)
Zone Type Price Range Confluences
🔴 Premium Supply 3350 – 3439 Monthly FVG + Wick exhaustion + RSI 80+
🔵 Bullish Imbalance 3180 – 3270 Monthly FVG + old BOS + EMA5 baseline
🔵 Mid-Level Support 2920 – 3000 Monthly OB + FVG + structure base
🔵 Deep Demand 2670 – 2780 HTF equilibrium zone + RSI support
✅ The current candle has pierced into the final wick supply, but with clear signs of loss in momentum.
⚠️ If 3439 breaks cleanly, next expansion zone opens toward 3505 → 3610 (Fibonacci projection). Otherwise, expect cooling to 3270–3180 first.
🔸 Fibonacci Context
🔻 Swing Low: 1810
🔺 Swing High: 3439
🎯 Current price ($3363) sits just below the 100% Fibonacci projection, with the 1.272 and 1.618 extensions at 3610 and 3740.
This confirms we are in a macro premium, and any long positions from here forward must be built only on strong LTF confirmation or clean pullbacks into value.
🔸 August Scenarios
🟢 Scenario 1 – Breakout + Price Discovery
If bulls break 3439 with strong volume and close:
New leg toward 3505 → 3610 opens
Watch for LTF continuation on H4–D1 with bullish OB reentry
Only valid if 3350 holds as new support
🔻 Scenario 2 – Rejection + Healthy Pullback
If price holds below 3439 and monthly wick exhausts:
Clean retracement toward 3270 → 3180 expected
EMA5/21 rebalancing will support bullish structure
Deeper rejection could retest 3070 zone if volatility spikes
🔸 Conclusion & Action Plan
We open August fully inside the last monthly supply zone. Trend is still bullish, but RSI, FVGs, and EMA distance warn us: this is not the time to chase — it’s time to wait for structure to speak.
📌 Key pivot = 3439.
Above it → Expansion.
Below it → Retracement.
Let August unfold — but stay sharp. The next big move will be born from this compression.
—
What’s your take — are we just getting started or about to cool off?
Drop your thoughts, chart it out, and stay ready for what August brings. ⚔️
—
❤️ Like if you enjoy clean, actionable updates🚀🚀🚀
🔁 Share with traders who love structure over noise
With clarity, confidence, and control,
GoldFxMinds
GOLD trade ideas
XAU/USD | Gold Holding Strong – Watching for Next Bullish Move!By analyzing the gold chart on the 4-hour timeframe, we can see that yesterday, as expected, when the price dropped to around $3357, it faced strong buying pressure and rallied up to $3377. After that, it corrected again, pulling back to $3338 so far, and is currently trading around $3341. If gold manages to hold above $3337, we can expect another bullish move, with potential targets at $3347, $3354, $3364, and $3374.
Please support me with your likes and comments to motivate me to share more analysis with you and share your opinion about the possible trend of this chart with me !
Best Regards , Arman Shaban
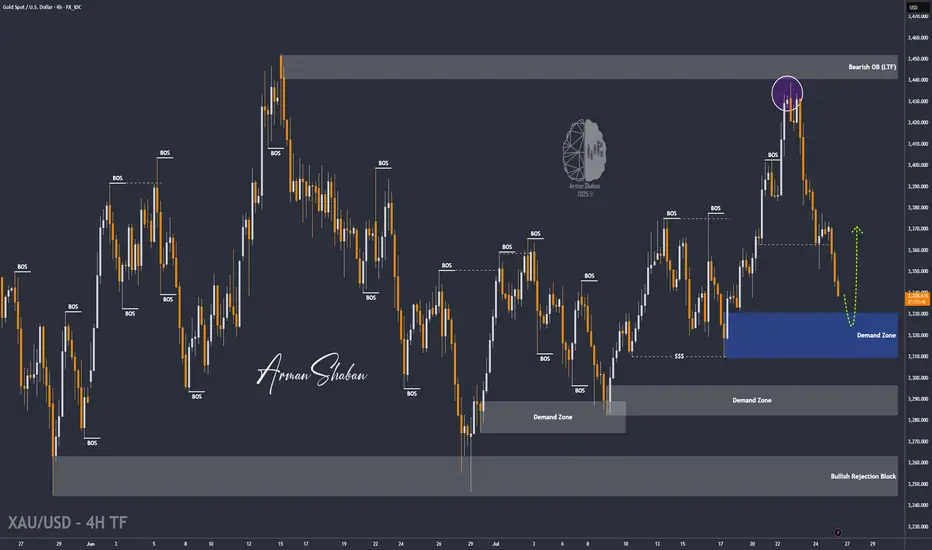
GOLD BUY TRADE IDEA🟡 XAU/USD Smart Money Setup – July 31, 2025
🔍 Key Technical Highlights:
• Demand Zone Entry:
• Price has tapped into a clear demand zone (gray box) around 3,274 – 3,290, signaling potential institutional accumulation.
• The previous inducement low has been swept, aligning with Smart Money Concepts (SMC).
• Liquidity Engineering:
• Equal highs (liquidity pool) visible from late June remain uncollected — a prime upside target.
• Price structure shows internal BOS, suggesting a shift in market sentiment.
• Expected Path:
• A potential multi-leg bullish move is mapped out, targeting the 3,440+ premium zone, completing imbalance fill and stop-run above highs.
• Risk-Reward:
• Stop loss sits just below the demand zone (~3,274), maintaining a favorable risk-to-reward ratio.
⸻
🧠 Smart Money Flow Narrative:
1. Sweep of inducement lows triggers institutional entries.
2. Demand zone holds with bullish reaction — confirmation of intent.
3. Expect higher highs and a rally toward uncollected liquidity above 3,440.
4. Low-risk buy opportunity for both swing and intraday traders.
XAUUSD Update 03 Augt 2025 BOUNCINGAs we knew on last weekend, price has bounced from 3267 level. It wont touch 3245-50 as a support.
From this reaction, we will follow on this week, is the price will break 3378 resistance ?
Is the price will retest 3400 level again and again ?
And if it so, it seemlikes a bullish momentum.
Just becarefull, waiting for the price make a correction first.
Have a blessing week ahead !

XAUUSD Short 2nd EntryElite Analysis
XAUUSD 2nd Entry
Same analysis as before
All rules confirmed
Targeting lower liquidity pools

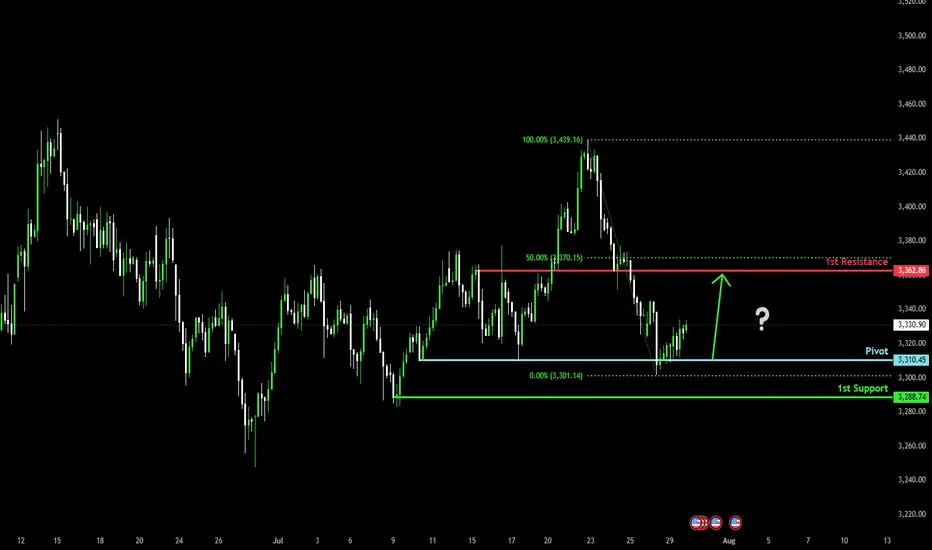
Bullish bounce off?The Gold (XAU/USD) has bounced off the pivot, which acts as a multi-swing low support and could rise to the 1st resistance, which is slightly below the 50% Fibonacci retracement.
Pivot: 3,310.45
1st Support: 3,288.74
1st Resistance: 3,362.86
Risk Warning:
Trading Forex and CFDs carries a high level of risk to your capital and you should only trade with money you can afford to lose. Trading Forex and CFDs may not be suitable for all investors, so please ensure that you fully understand the risks involved and seek independent advice if necessary.
Disclaimer:
The above opinions given constitute general market commentary, and do not constitute the opinion or advice of IC Markets or any form of personal or investment advice.
Any opinions, news, research, analyses, prices, other information, or links to third-party sites contained on this website are provided on an "as-is" basis, are intended only to be informative, is not an advice nor a recommendation, nor research, or a record of our trading prices, or an offer of, or solicitation for a transaction in any financial instrument and thus should not be treated as such. The information provided does not involve any specific investment objectives, financial situation and needs of any specific person who may receive it. Please be aware, that past performance is not a reliable indicator of future performance and/or results. Past Performance or Forward-looking scenarios based upon the reasonable beliefs of the third-party provider are not a guarantee of future performance. Actual results may differ materially from those anticipated in forward-looking or past performance statements. IC Markets makes no representation or warranty and assumes no liability as to the accuracy or completeness of the information provided, nor any loss arising from any investment based on a recommendation, forecast or any information supplied by any third-party.
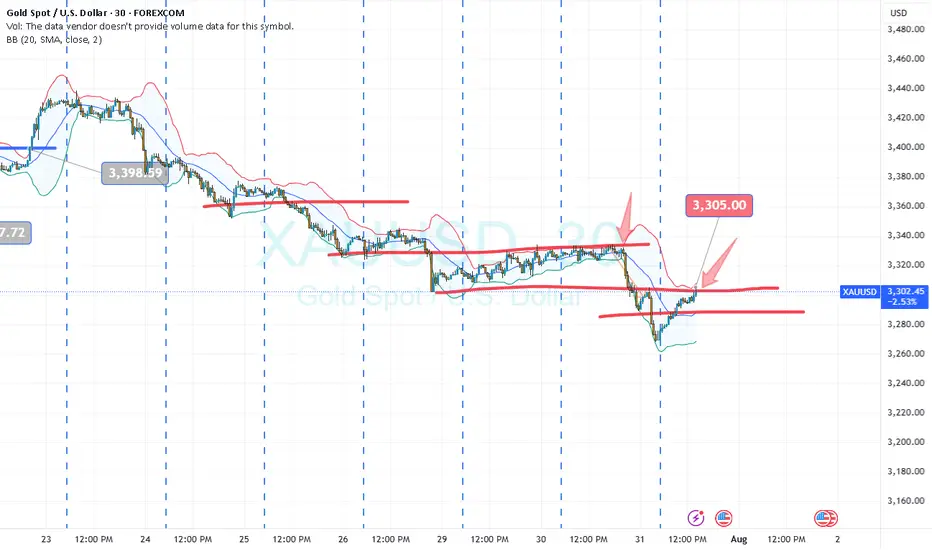
SELL THE RALLIES ON GOLD 🟡 Gold Daily Time Frame Analysis
🔍 Market Structure Overview
Gold has been consolidating in a broad range near its all-time highs, indicating a bullish exhaustion. This prolonged sideways movement is characteristic of a distribution phase, often preceding a potential trend reversal.
The current price action lacks strong directional momentum, as buyers appear exhausted near record highs.
The distribution pattern implies that institutions may be preparing to offload long positions and potentially build short positions for a future bearish move.
---
🟥 Red Rectangle – Resistance Zone (Potential Distribution Area)
Price has repeatedly tested this zone without a successful breakout.
This zone likely contains heavy sell-side liquidity and institutional supply.
Key Resistance Levels within this zone:
$3,400
$3,425
$3,480
This repeated failure to break higher reinforces the possibility of a trend reversal from this area.
---
🟦 Blue Rectangle – Minor Support (Liquidity Engineered Zone)
Gold is reacting to this minor support zone, showing temporary buying interest.
This may indicate that institutions are building liquidity, luring in buyers to drive price back toward the red zone.
Once sufficient liquidity is accumulated, smart money may offload remaining long positions into resistance, and initiate a bearish trend.
Key Support Levels:
$3,300 – immediate minor support
$3,200
$3,100
$3,000 – major psychological and technical support
---
📈 Institutional Price Behavior
This price behavior aligns with Wyckoff Distribution Theory, where:
Price consolidates near the top
Demand weakens
Institutions offload to late buyers
Downtrend begins after liquidity sweep or Upthrust (UTAD)
---
🧠 Conclusion
Gold’s ranging structure near ATH suggests we may be in a distribution phase. The reaction to the minor support implies a liquidity-building move to draw price back to resistance before a potential markdown phase (bearish trend) begins.
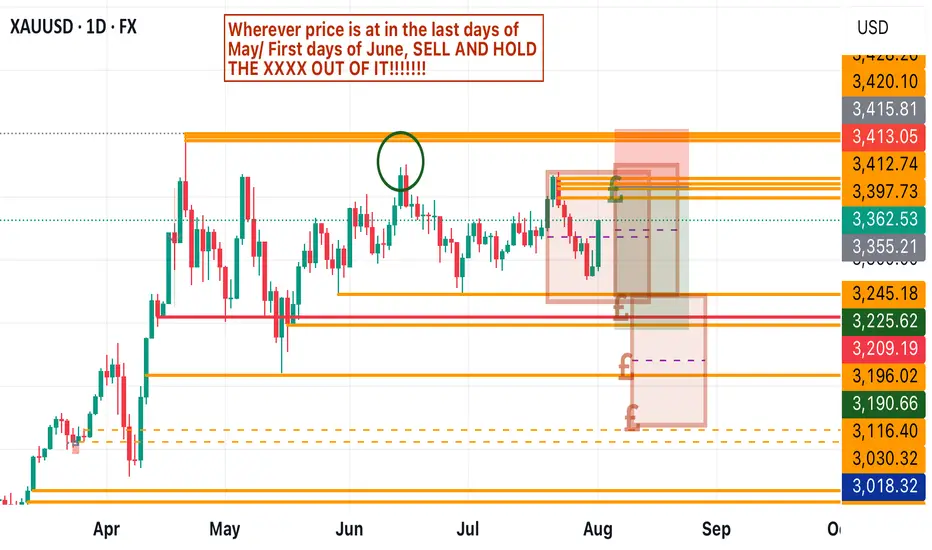
XAUUSDGold (XAUUSD) has been undeniably one of the most rewarding instruments to trade this year. Whether that be longs or shorts.
Well, after the latest drop let’s be clear on one thing…. There is another big one to come.
There is a 4 year cycle of behaviour to not be ignored. Question, what happened this time in the Gold charts 4 years ago?
If you know the answer then you need to be setting up for sells.
Of course there have been many highs made this year and some are anticipating a new ATH before the drop. It is possible based on price action in 2025.
If history is to repeat itself, the open of Asian Session tonight (030825) could see a continuation up of the explosion up of Friday (010825). This should result in the sweeping out of stop losses of any sells that have been held over the weekend.
The closure of the sells will create buying pressure sending price further up to retest at least the most significant swing high. At and from this level and a few more above, we can look out for sustained selling to break below 3300 and beyond.
It is just theory at this point but should be taken into account.
Potential sell areas:
3368-3370
3378-3380
3400-3405
3412-3416
3428-3430
3433-3438
3444-3450
Of course risk management is key. But from the highest point that price reaches early next week could be the start of a very good sell.
All entry zone me should have an initial 1:2RR while holding partial sells with extended TPs as far as 3233,3217,3198,3159,3099.
Good luck 🤞
This is not financial advice and should be taken with a pinch of salt.
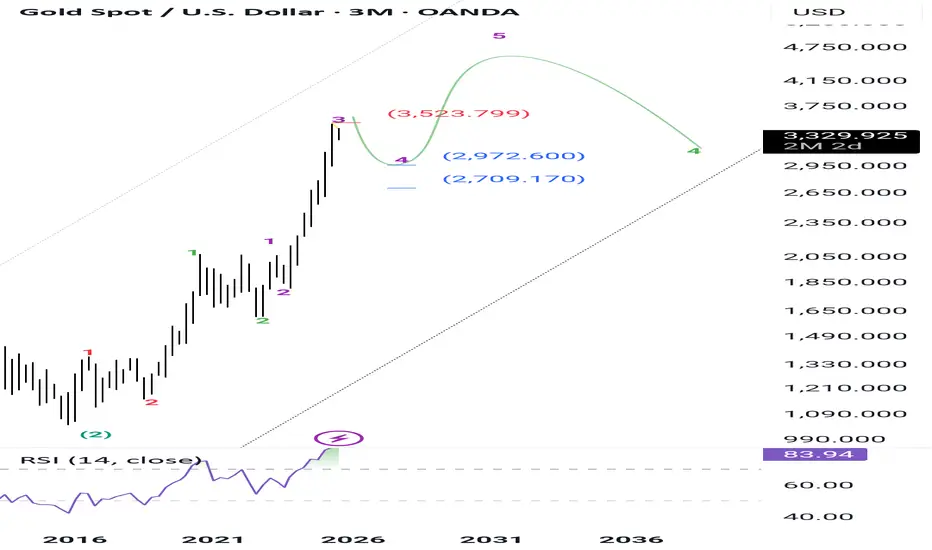
Gold Eliot analysis My predictions about gold in previous years have been quite accurate and calculated. Currently, I think a wave 4 correction, which is a micro-wave, is taking place. As we can see, this micro-wave will probably decrease between $2,700 and $3,000 and then advance to targets above $4,000. Majid Babaei Tehran August 1404
Gold (XAU/USD) - Market Structure Analysis Points to Next MoveThe provided 4-hour chart for Gold (XAU/USD) displays a market structure analysis incorporating concepts like Break of Structure (BOS), Change of Character (CHoCH), Fair Value Gaps (FVG), and defined support and target (resistance) levels. The price has shown a recent bullish trend, marked by higher highs and higher lows, confirmed by BOS signals. Currently, the price is consolidating around the 1st support level after reacting to a FVG.
Current Position: Consolidating around the 1st support level (approximately $3,365.028 - $3,353.094).
Support Levels:
1st support: Immediate support zone.
2nd support: Lower support zone ($3,328.619 - $3,320.000).
GL Zone & Support Zone: Confluence of a Golden Level and support ($3,299.096 - $3,290.067).
MAJOR SUP ZONE: Significant historical support area ($3,280.000 - $3,273.685).
Resistance Levels (Targets):
1st TG: Target/resistance zone ($3,392.891 - $3,402.807), containing a FVG.
2nd TG: Higher target/resistance zone ($3,413.659 - $3,423.805), also containing a FVG.
Market Structure: Evident bullish market structure with BOS confirmations, although a recent CHoCH suggests a potential shift or at least a temporary pause in the aggressive uptrend. Multiple FVGs indicate areas where price might find support or resistance.
Potential Trading Scenarios
Bullish Continuation: If the price respects the 1st support level and moves to fill the lower FVG within the 1st TG, a long opportunity could arise targeting the 2nd TG. Confirmation would be a break above the upper boundary of the 1st TG.
Bearish Retracement: If the 1st support fails to hold, the price could retrace towards the 2nd support level. A break below the 1st support and a failure to hold the FVG within the 1st TG would signal this scenario.
Range Trading: The price could consolidate between the 1st support and 1st TG levels, offering short-term trading opportunities within this range.
Explanation of Specific Elements
BOS (Break of Structure): Indicates a continuation of the current trend. A bullish BOS occurs when the price makes a higher high, confirming the uptrend.
CHoCH (Change of Character): Suggests a potential shift in the market's behavior. A bearish CHoCH after a bullish trend might indicate weakening buying pressure and a possibility of a reversal or a significant pullback.
FVG (Fair Value Gap): Represents an inefficiency in the market where there were aggressive price movements with less trading volume on one side. These gaps can act as future support or resistance levels as the market often tries to fill them.
Support Levels: Price levels where buying pressure is expected to outweigh selling pressure, potentially halting a downtrend.
Target/Resistance Levels (TG): Price levels where selling pressure is expected to outweigh buying pressure, potentially halting an uptrend.
GL Zone & Support Zone (Golden Level): This likely refers to a support level coinciding with a Fibonacci Golden Ratio level, often considered a high-probability reversal zone.
MAJOR SUP ZONE: A significant historical support level where strong buying interest has been seen in the past.
TradingView "Publish Idea" Post Based on the Chart
Title: Gold (XAU/USD) - Bullish Structure Consolidating at Support with Breakout Potential
Analysis:
Gold (XAU/USD) on the 4-hour timeframe shows a clear bullish market structure confirmed by multiple Breaks of Structure (BOS). After a strong upward move, the price is currently consolidating around the 1st support level ($3,365.028 - $3,353.094), which also aligns with a Fair Value Gap (FVG).
The presence of a recent Change of Character (CHoCH) suggests that the aggressive bullish momentum might have temporarily subsided, and we could be seeing a period of accumulation before the next move. The price action within the FVG near the 1st TG ($3,392.891 - $3,402.807) will be crucial.
Potential Scenarios & Trading Plan:
Bullish Continuation: If the 1st support holds and the price breaks above the upper boundary of the FVG within the 1st TG, it would signal a likely continuation of the bullish trend.
Long Entry: Upon a confirmed breakout above $3,402.807.
Target 1: The 2nd TG zone ($3,413.659 - $3,423.805), which also contains a FVG.
Stop Loss: Place below the 1st support level (e.g., below $3,353.000) to manage risk.
Bearish Retracement: Failure to hold the 1st support could lead to a deeper retracement.
Short Entry: On a confirmed break below $3,353.000.
Target 1: The 2nd support zone ($3,328.619 - $3,320.000).
Stop Loss: Place above the 1st support level.
Key Levels to Watch:
Support: $3,365.028 - $3,353.094, $3,328.619 - $3,320.000, $3,299.096 - $3,290.067.
Resistance (Targets): $3,392.891 - $3,402.807, $3,413.659 - $3,423.805.

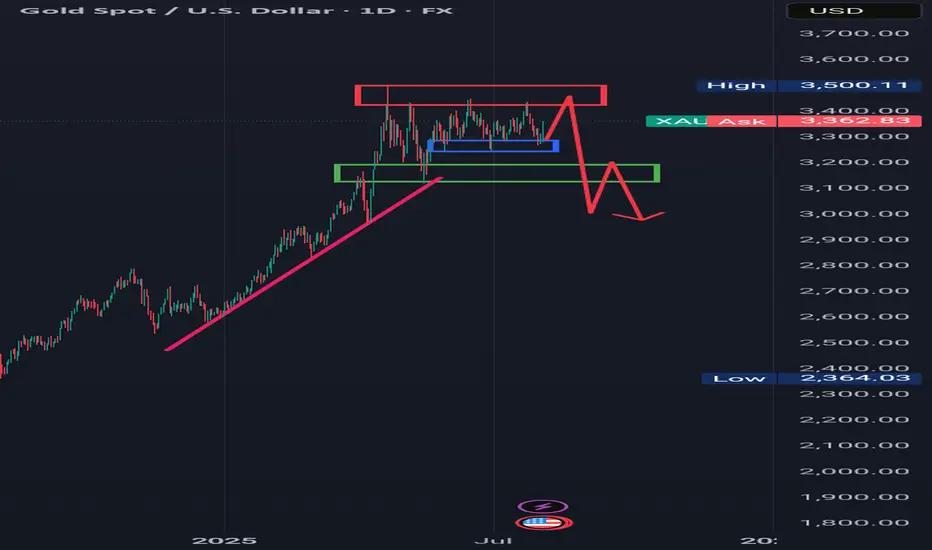
XAUUSDXAUUSD longterm its going to 5K
Short/midterm its going to 3500
H4 still on a consolidation.
The best thing to do is to wait for the end of the summer.

XAU intra?
Hi ,
Broke low at 3305/04 yesterday.
Made low below 3300
Now retesting this area. Good place to place a ticket.
All the best
Not a guru
GOLD REVERSALHello folks, most traders stop out on this idea right? lets get back to previous month opening price, for short idea stoploss above. 3440.
But If you can wait for LONG below. maybe in the next 2 days.
Goodluck. I prefer LONG? I will update once I see volumes on downtrend today or the next day.
I only see short today. the volume is declining/exhausted. I predict reversal atm.
ciao.. see the chart above.
this is not a financial advice.
trade it like its your own business.

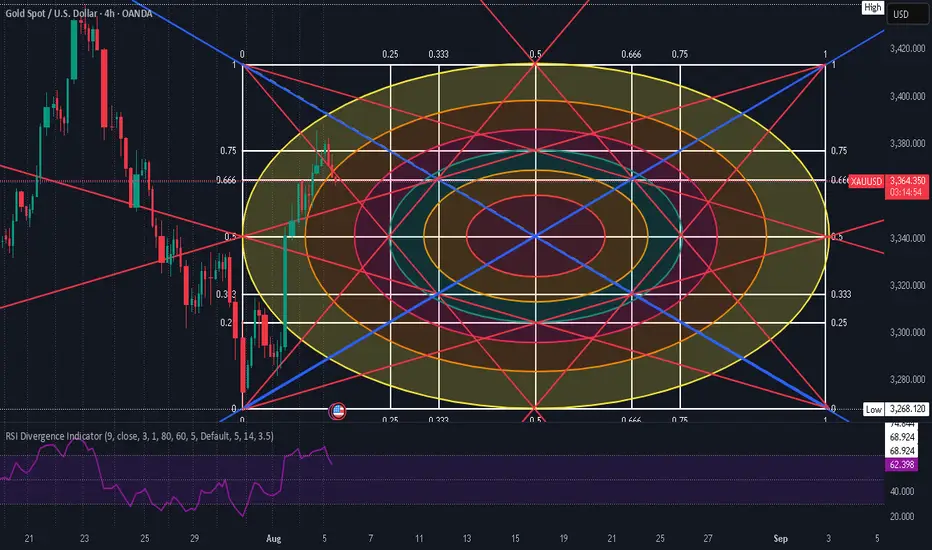
Time is equal to price !Will gold visit again the LL at 3268 or it will pull back from 3340/3344 !
If so we may see gold making a new top at 3400 /3450/3500/3550/3600 .
After data shock, GOLD has bullish conditions againOANDA:XAUUSD rose more than 2% on Friday, hitting a one-week high, as weaker-than-expected U.S. non-farm payrolls data boosted hopes of a Federal Reserve rate cut and the announcement of new tariffs boosted safe-haven demand.
On the economic data front
Gold prices rose more than 2% in U.S. trading on Friday (Aug. 1), hitting a one-week high, as weaker-than-expected U.S. non-farm payrolls data fueled hopes of a Federal Reserve rate cut and safe-haven demand was boosted by the announcement of new tariffs.
The U.S. Department of Labor's Bureau of Labor Statistics reported that nonfarm payrolls increased by just 73,000 jobs in July, well below market expectations of 110,000. June's data was revised down to just 14,000, indicating a significant slowdown in job growth. The unemployment rate rose to 4.2%, indicating a cooling labor market.
The jobs data was weaker than expected, but slightly higher than the market's lowest forecast. This increases the likelihood of a rate cut by the Fed later this year. As a non-yielding asset, gold typically performs better in a low-interest-rate environment.
According to CME Group's FedWatch tool, market participants now expect the Federal Reserve to cut rates twice before the end of the year, starting in September. Earlier this week, the Fed held rates steady at 4.25%-4.50%. Chairman Powell said it was too early to determine whether a rate cut would be forthcoming in September, citing inflation and employment data.
On the trade front
Trump has imposed a new round of tariffs on exports from dozens of trading partners, including Canada, Brazil, India and Taiwan, causing a global market crash.
Countries are scrambling to negotiate a better deal. In times of economic and geopolitical uncertainty, safe-haven gold is in high demand.
So far in 2025, gold prices have risen more than $400, hitting a record high of $3,167.57/oz on April 3, driven by safe-haven demand and central bank buying.
Weak jobs data also sent the dollar lower against major currencies, further supporting gold prices as a weaker greenback makes gold more attractive to investors holding other currencies.
Investors' Attention Turns to September FOMC Meeting
Markets are now focused on the September Federal Open Market Committee (FOMC) meeting. Facing the dual pressures of volatile inflation, slowing employment and escalating global trade tensions, the Fed will have to balance its inflation target with economic growth.
Markets are betting on the Fed to begin a new round of easing, and gold, as a hedge against currency devaluation and economic uncertainty, is expected to continue to benefit.
Gold prices have risen more than 30% year-to-date, reflecting the market’s preference for safe-haven assets. If weak U.S. economic data continues in the coming weeks, or if new geopolitical conflicts emerge, gold prices are expected to continue their upward trend, challenging new highs for the year.
Summary, Commentary
Weak employment, new tariffs and a slumping stock market have all contributed to a strong recovery in gold prices. With the possibility of the US Federal Reserve cutting interest rates in September increasing significantly, gold market sentiment has warmed and risk aversion has returned.
Investors will need to keep a close eye on inflation data, Fed officials’ speeches, and whether Trump continues to stoke trade tensions, which could lead to greater volatility in the gold market.
Against the backdrop of the unexpected non-farm payrolls report and moderate inflation, the market has essentially “locked in” the possibility of a rate cut in September, but whether the cut will be 25 or 50 basis points, and whether there will be further rate cuts in the future, will depend on the interaction between the Fed members’ verbal guidance and market expectations.
Technical Outlook Analysis OANDA:XAUUSD
On the daily chart, affected by the sudden weak data that shocked the market, gold broke most of the technical structure that was leaning towards the downside. Price action was pushed above the EMA21, while the short-term downtrend channel was also broken above and the Relative Strength Index crossed above 50.
These are the initial conditions for a short-term uptrend. But to confirm an uptrend and a new uptrend in the near term, gold needs to continue to break above the 0.236% Fibonacci retracement level (3,371 USD) first, then the target will be around 3,400 USD in the short term.
If gold breaks above $3,400 again, traders should set a new target of $3,430 in the short term, rather than $3,450 which is the all-time high.
Motivationally, the RSI has not reached oversold territory to provide pure reversal support, but it has been pushed by the market shock after the NFP data release, so this rally may not be sustainable in a purely motivational way either.
Overall, gold is now more bullish after a rally on Friday, opening up initial conditions for expectations of a new uptrend. And the notable points will be listed as follows.
Support: 3,323 – 3,310 – 3,300 USD
Resistance: 3,371 – 3,400 – 3,430 USD
SELL XAUUSD PRICE 3376 - 3374⚡️
↠↠ Stop Loss 3380
→Take Profit 1 3368
↨
→Take Profit 2 3362
BUY XAUUSD PRICE 3327 - 3329⚡️
↠↠ Stop Loss 3323
→Take Profit 1 3335
↨
→Take Profit 2 3341

Will Upcoming Data Determine the Next Gold's Direction?Macro approach:
- Gold retreated this week, reversing early gains to trade near four-week lows amid renewed US dollar strength and caution ahead of the Fed's policy decision.
- The retreat was mainly pressured by stronger-than-expected US economic data and a tentative revival in risk appetite, offsetting pockets of safe-haven demand.
- Key drivers included robust US GDP growth for 2Q, a bounce in consumer confidence, and the Fed's steady rates with a more hawkish tone, suggesting cuts may be further out.
- Meanwhile, recent US-EU and US-China trade deals eased some global uncertainty, damping gold's appeal as a hedge.
- Market participants also eyed the labor market's continued cooling, but resilient consumer spending further buoyed the dollar.
- Gold may remain volatile, with potential upside if upcoming US PCE inflation and NFP reports disappoint expectations. Any escalation in trade tensions or signals of Fed policy easing could renew support for gold prices.
Technical approach:
- XAUUSD fluctuated within the range of 3285-3560, which is below the broken ascending trendline. The price between the two EMAs awaits an apparent breakout to determine the next trend.
- If XAUUSD breaks below the support at 3273, confluence with EMA78, the price may plunge to retest the following support at 3167.
- On the contrary, remaining above the support at 3273 may lead XAUUSD to retest the resistance at around 3560.
Analysis by: Dat Tong, Senior Financial Markets Strategist at Exness

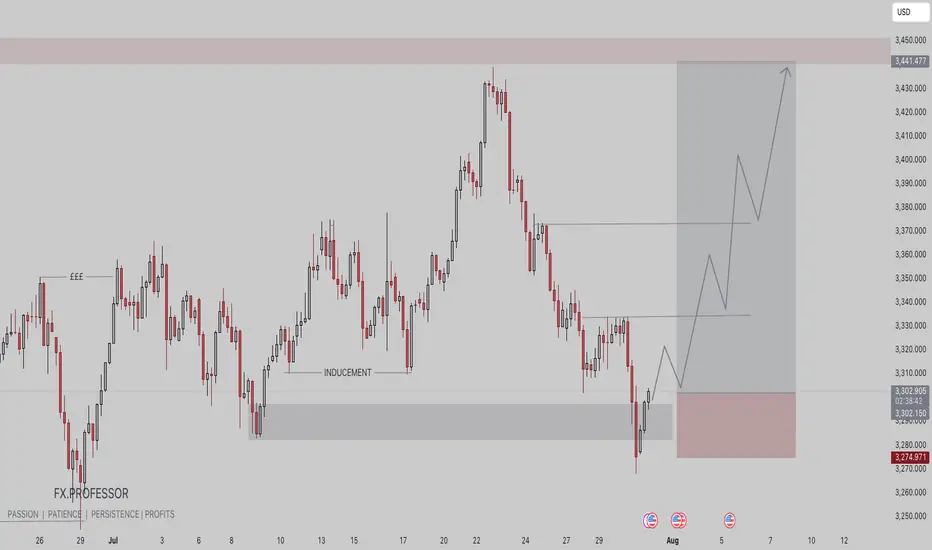
Gold’s Biggest Day of 2025: Collapse or New High Incoming?🟡 Gold Pre-FOMC Update | Patience Paid Off
In my previous analysis released on Monday, we highlighted the significance of the 3310 key red level on gold. I mentioned that if we got a daily candle close below this zone, it could trigger further downside.
That scenario didn’t play out — price closed above 3310, and that’s exactly why we stayed out of any short positions. No guessing, no forcing. Just patience.
On the flip side, I also said we need a daily close above 3350 to even consider going long. And as you can see, for the past two days, price has been ranging tightly between 3310 and 3330 — with relatively low trading volume across the board.
After 9 years of optimizing this strategy, one core principle remains unchanged:
🛡️ Capital protection and maximum risk control always come first.
And I can confidently say — those filters are working beautifully. I hope you’re benefiting from this approach too.
Now technically speaking, everything is lining up for a bullish DXY and bearish gold —
But tonight’s FOMC meeting and Powell vs. Trump drama will be the final trigger.
Let’s watch closely. Smart trading is patient trading. 🧠⚖️
🔁 This analysis will be updated whenever necessary.
Disclaimer:This is not financial advice. Just my personal opinion.

XAUUSD – Is gold getting ready to bounce?Right now, gold is reacting around the 3,280 support zone after breaking down from its previous ascending channel. While the broader trend is still under bearish pressure, the recently released JOLTS data came in lower than expected, signaling that the U.S. labor market may be cooling — a mildly positive sign for gold.
From a technical view, price is showing signs of forming a short-term bottom near 3,229 and is starting to rebound. If gold can hold above this support and break through 3,339, a recovery toward the 3,360–3,400 zone could unfold.
That said, this bounce is likely just a technical correction. Without more bearish news for the dollar, gold still risks being rejected around the FVG area and heading lower again.
Trading idea: Consider short-term Buy opportunities if price stays above 3,280 and forms a clear reversal pattern. Stop-loss below 3,229. Short-term targets: 3,339–3,360.
What about you? Leaning towards buying the dip or staying with the downtrend?

GOLD (XAUUSD) -Monthly Analysis & Trading Plan (Aug 2025)GOLD (XAUUSD) -Monthly Analysis & Trading Plan (Aug 2025)
Title: XAUUSD: Correction in Progress, Patience is Key for the Next Move
Chart: XAUUSD Monthly (1M)
Analysis Type: ICT/SMC, Price Action, & Moving Average
Summary:
After a historic and powerful bull run that saw Gold (XAUUSD) breach all-time highs in the first half of 2025, the market has entered a significant corrective phase. The massive red candle in June signaled a strong reversal of momentum, and the current July candle confirms that sellers remain in control, albeit with less intensity. This is a critical juncture for long-term traders, and a strategic approach is required.
Key Observations & Analysis
1. **Price Action & Market Structure:**
The move from late 2024 through May 2025 was a textbook "impulsive leg." The sharp reversal in June 2025, with a powerful bearish candle, likely acted as a **liquidity grab** or a **high-volume distribution event**, trapping late buyers. The market is now in a clear **break in market structure (BOS)** to the downside on this long-term timeframe, suggesting the correction is not over.
2. **ICT/SMC Concepts:**
* **Imbalance/Fair Value Gap (FVG):** The rapid bullish move created significant imbalances on the monthly chart. Price often returns to fill these gaps. The current correction is likely heading to fill or test these inefficiencies.
* **Order Block (OB):** The massive bullish move in late 2024/early 2025 likely created a strong bullish order block. The current sell-off is heading toward this potential institutional demand zone.
* **Liquidity:** The lows from late 2024 and early 2025 will be key liquidity pools. Smart money will likely be targeting these areas for a potential reversal or accumulation.
3. **Moving Average Analysis (MMA):**
* The price is currently trading above both the purple and yellow moving averages, which are still pointing upward. This confirms the long-term trend remains bullish, and the current move is a correction within that trend.
* The **purple moving average** is a key support level to watch. A test of this level would be a high-probability event, and its reaction will be crucial for the next major move.
Suggested Entry & Exit Levels
1. Aggressive Entry (Short)
Rationale
The bearish momentum, though slowing, is still the dominant force. An aggressive trader could look for a continuation of the short-term bearish trend.
Entry/b]
A short entry could be considered on a pullback to the recent highs around **$3,400 - $3,500** if a strong bearish candlestick pattern forms on a lower timeframe (e.g., weekly or daily).
Stop Loss
A tight stop-loss placed just above the recent high, for example, **$3,600**. This is a high-risk entry, so position sizing should be small.
Target
The first major target would be the **moving average support level**, roughly in the **$3,000 - $3,100** zone. The ultimate target for a full correction would be the order block from late 2024, around **$2,800**.
2. Conservative Entry (Long)
Rationale
The long-term trend is still bullish. The current move is a correction. The most prudent approach is to wait for a high-probability long entry at a key support level.
Entry/b]
Wait for price to reach the **purple moving average support zone (around $3,000 - $3,100)**. Look for a clear reversal signal on this level, such as a large bullish "pin bar" or "engulfing candle" on the monthly or weekly chart. This would be a high-probability demand zone for a reversal.
Stop Loss
A stop-loss should be placed below this key support level, perhaps around **$2,850 - $2,900**, giving the trade room to breathe.
Target
The first target for a new bullish leg would be the New swing high around **$3,800**. The ultimate long-term target would be a new all-time high above **$4,000**.
Conclusion
The Gold market is in a crucial phase. The bullish party from earlier in 2025 is over for now, and a healthy correction is underway. **The most logical and safe approach is to wait for the market to complete its corrective move.** Do not attempt to catch a falling knife. Instead, be patient and wait for price to reach a key institutional demand zone (our moving average support or the late 2024 order block) and show a clear sign of reversal. This will present a high-probability, low-risk long entry for the next impulsive move up.
Disclaimer
This is not financial advice. Please perform your own due diligence and risk management. Trading involves a significant risk of loss.

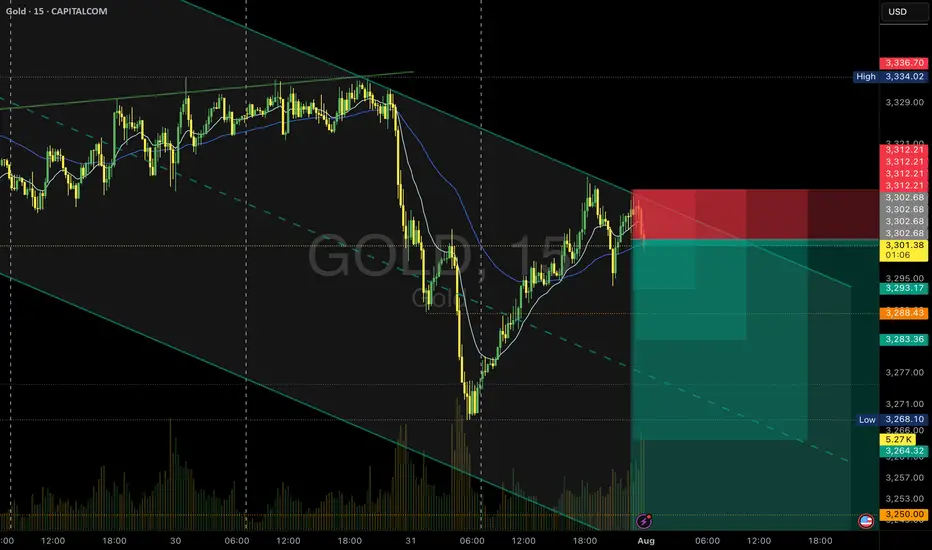
Gold Sell Setup - M15PEPPERSTONE:XAUUSD
Timeframe: m15
Risk Level: Medium
🔹 Setup:
Price is testing the upper boundary of the descending channel.
📈 Entry:
Current price zone: 3302.5
🎯 Targets (TP):
TP1: 3393
TP2: 3283
TP4: 3264
TP6: 3244
⛔ Stop Loss (SL):
3312.2
#XAUUSD #GOLD #SELL #Signal #MJTrading
Psychology Always Matters:
Gold Intraday Trading Plan 8/5/2025Gold didn't retrace deep enough to 3333 yesterday but bounced from 3345 and touched 3385. The short term bullish trend is still valid right now but we could see sign of slowing down. If further slowing is observed, the drop followed may be very big.
Therefore, I will execute strict management on buying order right now. I am looking for buying signals from 3365, targeting 3400. If there is selling signals from 3400, I will sell toward 3365.

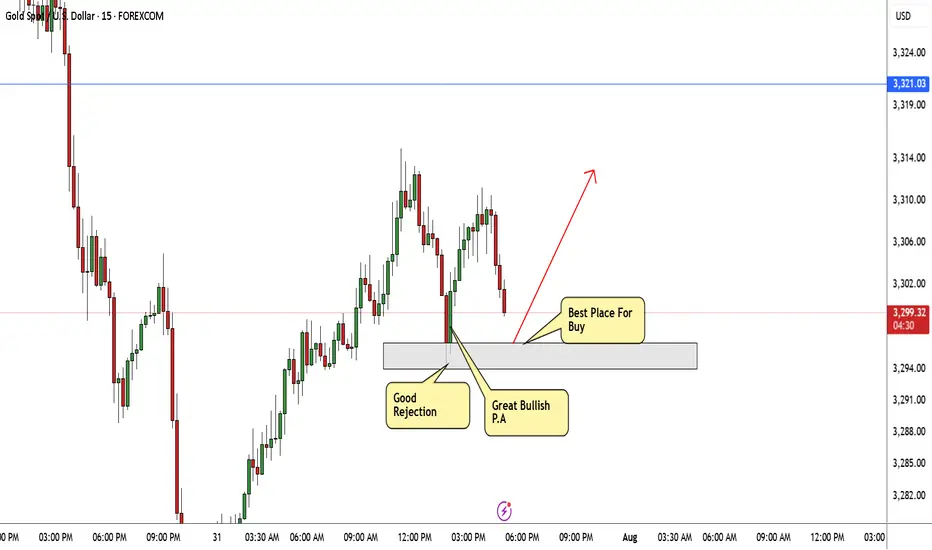
GOLD Bullish Today , Long Scalping Entry Valid To Get 150 Pips !Here is My 15 Mins Gold Chart , and here is my opinion , we finally above 3296.00 and we have a 30 Mins Candle closure above it , so i`m waiting the price to go back and retest this res and new support and give me a good bullish price action to can enter a buy trade and we can targeting 100 to 150 pips .
Reasons To Enter :
1- New Support Created
2- Bullish Price Action
3- Bigger T.F Giving Good Bullish P.A .
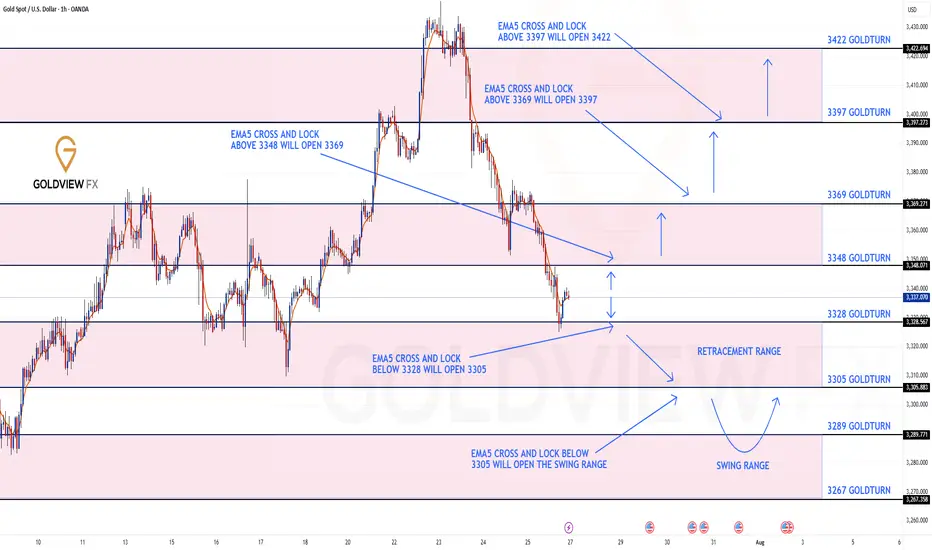
GOLD 1H CHART ROUTE MAP UPDATE & TRADING PLAN FOR THE WEEKHey Everyone,
Please see our updated 1h chart levels and targets for the coming week.
We are seeing price play between two weighted levels with a gap above at 3348 and a gap below at 3328 . We will need to see ema5 cross and lock on either weighted level to determine the next range.
We will see levels tested side by side until one of the weighted levels break and lock to confirm direction for the next range.
We will keep the above in mind when taking buys from dips. Our updated levels and weighted levels will allow us to track the movement down and then catch bounces up.
We will continue to buy dips using our support levels taking 20 to 40 pips. As stated before each of our level structures give 20 to 40 pip bounces, which is enough for a nice entry and exit. If you back test the levels we shared every week for the past 24 months, you can see how effectively they were used to trade with or against short/mid term swings and trends.
The swing range give bigger bounces then our weighted levels that's the difference between weighted levels and swing ranges.
BULLISH TARGET
3348
EMA5 CROSS AND LOCK ABOVE 3348 WILL OPEN THE FOLLOWING BULLISH TARGETS
3369
EMA5 CROSS AND LOCK ABOVE 3369 WILL OPEN THE FOLLOWING BULLISH TARGET
3397
EMA5 CROSS AND LOCK ABOVE 3397 WILL OPEN THE FOLLOWING BULLISH TARGET
3422
BEARISH TARGETS
3328
EMA5 CROSS AND LOCK BELOW 3328 WILL OPEN THE FOLLOWING BEARISH TARGET
3305
EMA5 CROSS AND LOCK BELOW 3305 WILL OPEN THE SWING RANGE
3289
3267
As always, we will keep you all updated with regular updates throughout the week and how we manage the active ideas and setups. Thank you all for your likes, comments and follows, we really appreciate it!
Mr Gold
GoldViewFX