GOLD Range-Bound Before Fed – Breakout Above 3349 Unlocks 3374GOLD | Bullish Momentum Builds Ahead of Fed Decision – Key Range Between 3349 and 3312
Fundamental Insight:
Gold is slightly higher as the U.S. dollar weakens ahead of the Fed’s rate decision. Markets await signals on future policy, which could drive sharp moves in gold.
Technical Outlook:
Gold remains bullish while above 3320, with upside potential toward 3349.
A 1H close above 3349 confirms breakout momentum, opening the path toward 3374, and potentially 3401.
A break below 3320, especially below 3312, would invalidate the bullish setup and trigger downside toward 3285, then 3256.
Currently range-bound between 3349 and 3312 — watch for breakout confirmation to determine the next trend direction.
Key Levels:
• Support: 3320 – 3285 – 3256
• Resistance: 3349, 3374 – 3401
Bias: Bullish above 3320
📍 Watch Fed volatility – breakout expected soon
GOLD trade ideas
Do you think gold is on a correction?
Hi my dears
Gold looks set to hit lower targets if it breaks the orange dotted line
What do you think?
The weekly timeframe has confirmed the bearish trend.
If you liked my analysis, just like me by liking and commenting.

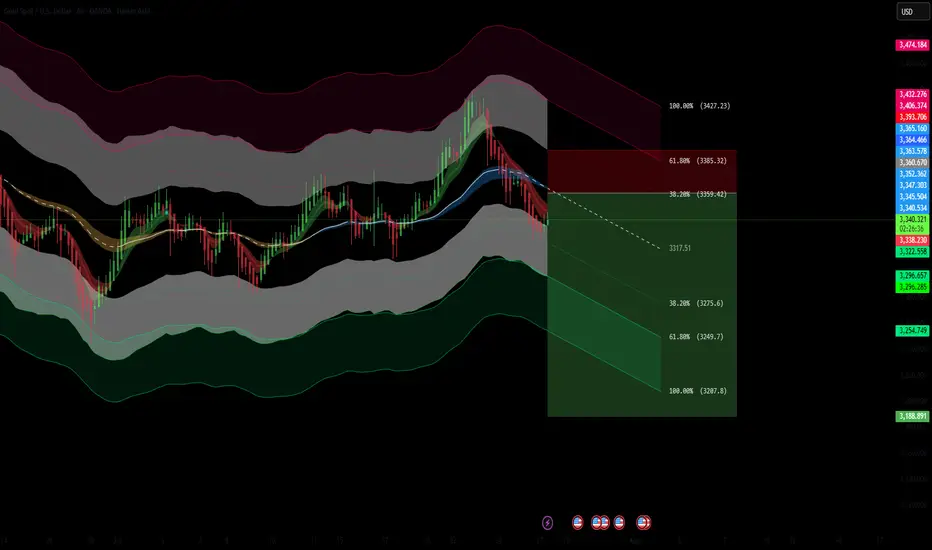
XAUUSD – 4H Short Setup AnalysisGold (XAUUSD) has broken below the dynamic support zone of the Keltner Channel structure and is currently trading beneath the 200 EMA zone, signaling bearish momentum. Price has rejected the upper resistance band near 3385, forming a lower high and triggering a short entry at the 38.2% Fibonacci retracement zone.
📉 Trade Idea (Short Bias)
Entry: Around 3360
TP1: 3317 (key support zone)
TP2: 3275 (38.2% Fib ext)
TP3: 3208 (100% extension target)
SL: 3385 (61.8% Fib retracement)
Confluences:
Price rejection from upper channel
200 EMA trend resistance
Clean bearish structure with momentum confirmation
Fib confluence adds precision to entry and target levels
If momentum sustains below 3360, further downside is likely toward the 3200 zone.
Excellent Selling opportunities deliveredGold delivered excellent re-Sell opportunities and as soon as DX started gaining value after GDP numbers, I was confident in Selling direction. I have Sold Gold on #3,324.80 towards #3,318.80 first, then #3,310.80 extension. Then I have Bought Gold (aggressive set of Scalping orders from #3,302.80 - #3,303.80 belt) closed on #3,306.80 and pre-Fed set of Selling orders on #3,294.80 - #3,296.80 closed below on #3,280's. Final order was #3,270.80 Buy which I kept towards #3,292.80 Resistance. All in all spectacular session for me and my Traders.
Technical analysis: As discussed, as long as #3,300.80 - #3,305.80 former Resistance holds, I was aware that Gold was more likely to push towards #3,270’s for a #2-Month Low’s test, still however within the Hourly 4 chart’s Buying accumulation zone. This week was / is packed with Fundamental announcements and real trend should be revealed (as today’s session Fundamental catalyst interfered and was already digested by markets), since today’s Price-action delivered the session High test around #3,300.80 benchmark and most likely market will close above it, triggering most of the late Sellers Stop-losses and as Bond Yields reversed and DX printed another series of Bullish candles above the Hourly 4 chart’s Support, Gold again reversed above #3,300.80 psychological barrier and is comfortably seen Trading above it. This shows how unstable market has become and that I should expect side Swings on Short-term, but those are not cause for an alarm as underlying Medium-term trend remains Bullish and I am there ready with my key entry points to Profit on this perfect Price-action for my current Trading model.
My position: I do not expect Gold to continue soaring with DX on such numbers and my practical suggestion is to Sell every High's that Gold deliver (in & out as I prefer to do).

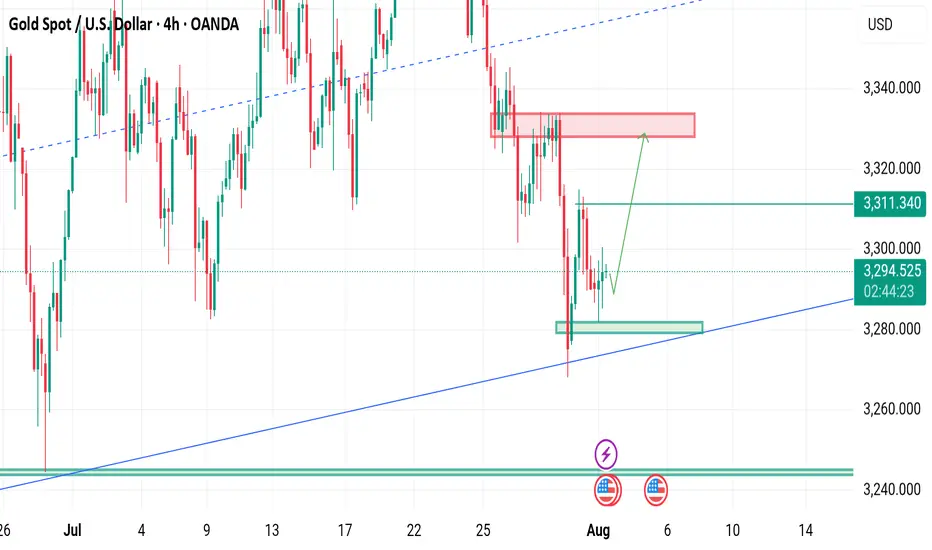
XAUUSD - 4/8/25Theres alot happening that is influencing Gold. But just following the market structure, we see a HTF BoS towards more bearish action. However friday's news did bring a big push up with huge imbalance in the Dollar as well as Gold.
I identified the zone that broke structure above and looking for price to touch this zone before going back down to take out any imbalance. t
The current TP is quite way down at the moment targeting the HTF equal low liquidity, but I will trail my SL.
if this Zone that broke structure is taken out then my bias will shift to bullish trades to retest the ATH.

Excellent Selling opportunities deliveredGold delivered excellent re-Sell opportunities and as soon as DX started gaining value after GDP numbers, I was confident in Selling direction. I have Sold Gold on #3,324.80 towards #3,318.80 first, then #3,310.80 extension. Then I have Bought Gold (aggressive set of Scalping orders from #3,302.80 - #3,303.80 belt) closed on #3,306.80 and pre-Fed set of Selling orders on #3,294.80 - #3,296.80 closed below on #3,280's. Final order was #3,270.80 Buy which I kept towards #3,292.80 Resistance. All in all spectacular session for me and my Traders.
Technical analysis: As discussed, as long as #3,300.80 - #3,305.80 former Resistance holds, I was aware that Gold was more likely to push towards #3,270’s for a #2-Month Low’s test, still however within the Hourly 4 chart’s Buying accumulation zone. This week was / is packed with Fundamental announcements and real trend should be revealed (as today’s session Fundamental catalyst interfered and was already digested by markets), since today’s Price-action delivered the session High test around #3,300.80 benchmark and most likely market will close above it, triggering most of the late Sellers Stop-losses and as Bond Yields reversed and DX printed another series of Bullish candles above the Hourly 4 chart’s Support, Gold again reversed above #3,300.80 psychological barrier and is comfortably seen Trading above it. This shows how unstable market has become and that I should expect side Swings on Short-term, but those are not cause for an alarm as underlying Medium-term trend remains Bullish and I am there ready with my key entry points to Profit on this perfect Price-action for my current Trading model.
My position: I do not expect Gold to continue soaring with DX on such numbers and my practical suggestion is to Sell every High's that Gold deliver (in & out as I prefer to do).
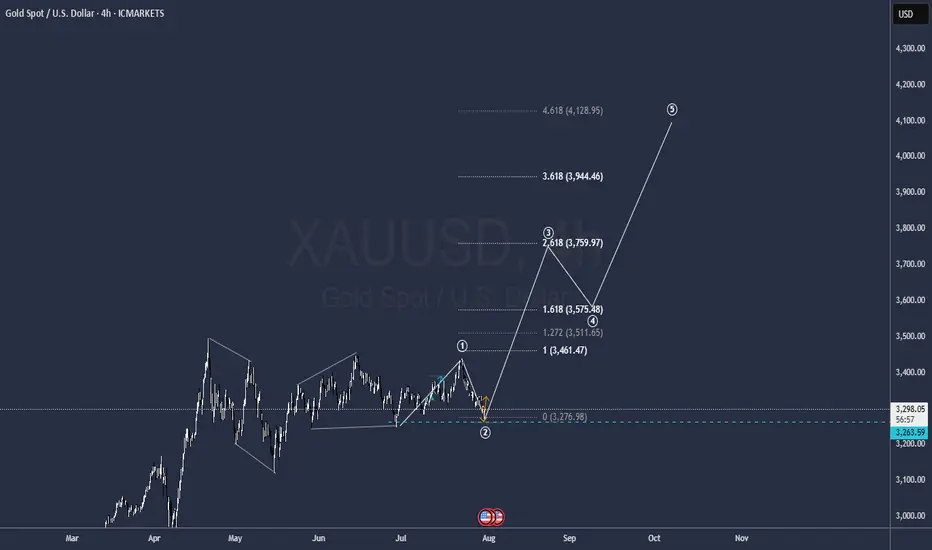
GOLD to all time highsIt is ready
a bitch wave one correction seems to be over so get ready to hit 4.000
GG
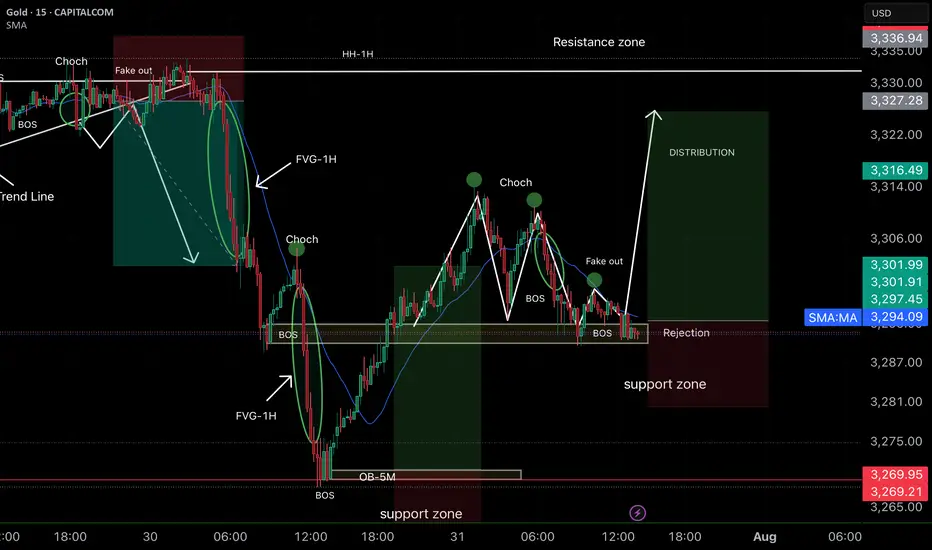
Smart Money Concepts (SMC) ✅ Analysis strengths:
• Correct identification of BOS (Break of Structure) and CHoCH, which indicate a change in direction.
• The support zone is marked and respected with rejection, reinforcing the probability of a rebound.
• The projection toward the distribution zone and HH of 1H is consistent, as there are inefficiencies (FVG) pending mitigation.
• The previous fake out clears liquidity and creates room for strong bullish momentum.
Weekly Analysis on GoldFor next week trading session i will be focusing on waiting for buy trade set up since this week market shows that a strong bullish momentum already appeared.

GOLD MARKET ANALYSIS AND COMMENTARY - [Aug 04 - Aug 08]This week, the price of OANDA:XAUUSD fell sharply from $3,345/oz to $3,268/oz after the FED Chairman said that the FED has no plans to cut interest rates at the upcoming September meeting. However, at the end of the week, the US Bureau of Labor Statistics announced that the number of non-farm jobs (NFP) in the US reached only 73,000 jobs in July, much lower than the forecast, and the unemployment rate increased higher, up to 4.2%. This pushed the price of gold up sharply from $3,281/oz to $3,363/oz.
The weak labor market has significantly changed expectations for the Fed's interest rate.
With a relatively light economic data calendar next week, investors will continue to monitor Friday's jobless claims report. Meanwhile, some analysts predict that the risk of global economic uncertainty after President Donald Trump announced new tariffs will continue to boost safe-haven demand for gold.
📌Technically, the resistance level for gold next week will be the round resistance of 3,400 USD/oz, followed by 3,440 USD/oz. Meanwhile, the support level is around 3,268 USD/oz.
Perspective on the H4 chart, gold is currently in a corrective recovery cycle testing the Trendline, it is likely that early next week there will be an increase around 3375 and then a correction decrease again.
Notable technical levels are listed below.
Support: 3,323 – 3,310 – 3,300USD
Resistance: 3,371 – 3,400 – 3,430USD
SELL XAUUSD PRICE 3394 - 3392⚡️
↠↠ Stop Loss 3398
BUY XAUUSD PRICE 3310 - 3312⚡️
↠↠ Stop Loss 3306

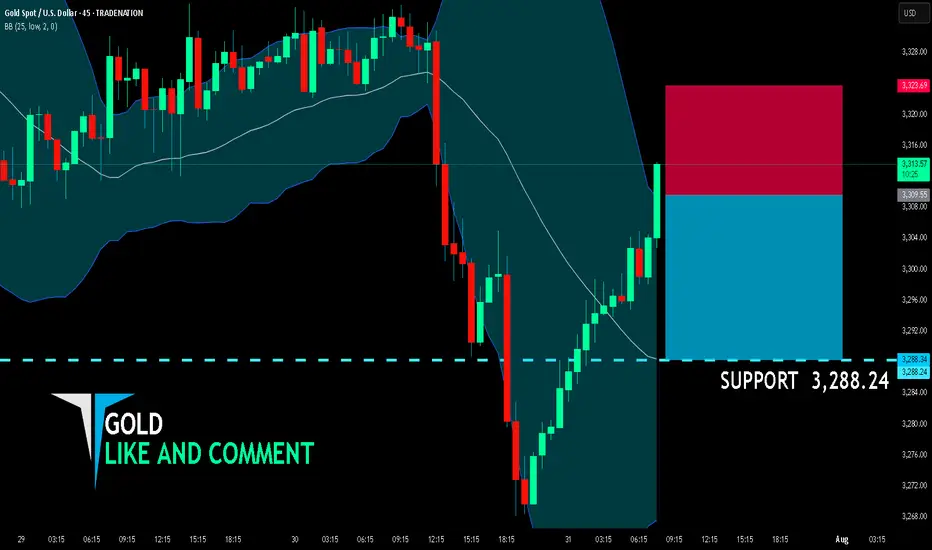
GOLD BEST PLACE TO SELL FROM|SHORT
GOLD SIGNAL
Trade Direction: short
Entry Level: 3,309.55
Target Level: 3,288.24
Stop Loss: 3,323.69
RISK PROFILE
Risk level: medium
Suggested risk: 1%
Timeframe: 45m
Disclosure: I am part of Trade Nation's Influencer program and receive a monthly fee for using their TradingView charts in my analysis.
✅LIKE AND COMMENT MY IDEAS✅
GOLD 1H: Fibo speaks louder than words - $3365 in focusGold is testing the upper zone near $3362–3365, which is just above the 0.5 Fibonacci level ($3353) from the previous impulse. The price has already bounced from the top of the channel, indicating potential exhaustion of the current upward move.
Technicals:
- MA50 and MA200 are below the price — bullish trend intact
- RSI is cooling down from overbought territory
- Fibo 0.5 ($3353) was breached, but no clear confirmation yet
- Channel resistance remains unbroken
Plan:
- If price rejects $3365, targets are $3340 and $3314
- If price holds above $3365, next move could be toward $3377+
- EMA structure supports further upside, but caution is needed at this zone
Gold isn’t shouting - it’s whispering key levels. Listen closely.

XAUUSD SHORTElite analysis
Price took out liquidity at the top
Price is confirming change of direction
Executed in lower time frame
Targeting lower liquidity pools

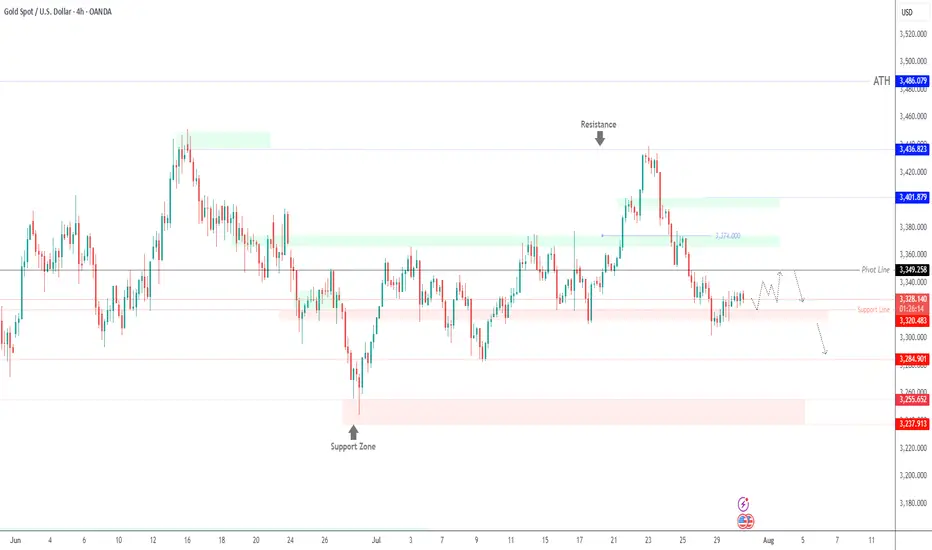
XAUUSD Weekly Outlook | $3,285 Key Level and Structure SetupHere’s my outlook on gold (XAUUSD) for the week of August 4–9, 2025.
Last week’s move was shaped by strong early dollar momentum, a 3% U.S. GDP report midweek, and Friday’s sentiment shift after the surprise tariff announcement.
Price is now sitting near the $3,380 supply zone, a structure that’s been in play since April. I highlight:
✅The key demand zone ($3,245–$3,285)
✅The broken descending trendline is now acting as support
✅Potential reaction around $3,360 early in the week
✅$3,285 remains my key level going forward. If ever price comes close, I’m watching for signs of strength or breakdown there to guide my setups.
I’ll update my thoughts in the comments as price action unfolds.
Disclaimer:
Based on experience and what I see on the charts, this is my take. It’s not financial advice—always do your research and consult a licensed advisor before trading.

XAUDUSD SELL LIMITSymbol: XAU/USD
Timeframe: 15 Minutes (15m)
Trade Direction: Short (Sell)
Exact Entry Price:
3,295.254
Entry Rationale: This point is located within the FVG (Fair Value Gap) and at the 78.0% Fibonacci level (Optimal Trade Entry - OTE zone), which has a high potential for a price reaction and attracting sell orders.
Exact Stop Loss:
3,305.953
Stop Loss Rationale: This price is set slightly above the high of the bearish Order Block and also above the Swing High at 3,302.658 to protect the trade from a potential liquidity grab (Stop Hunt).
Exact Take Profit (TP1):
3,270.916
Take Profit Rationale: This target is set at the recent low. This area acts as a sell-side liquidity pool and is the next logical target for the price after pulling back to the supply zone.

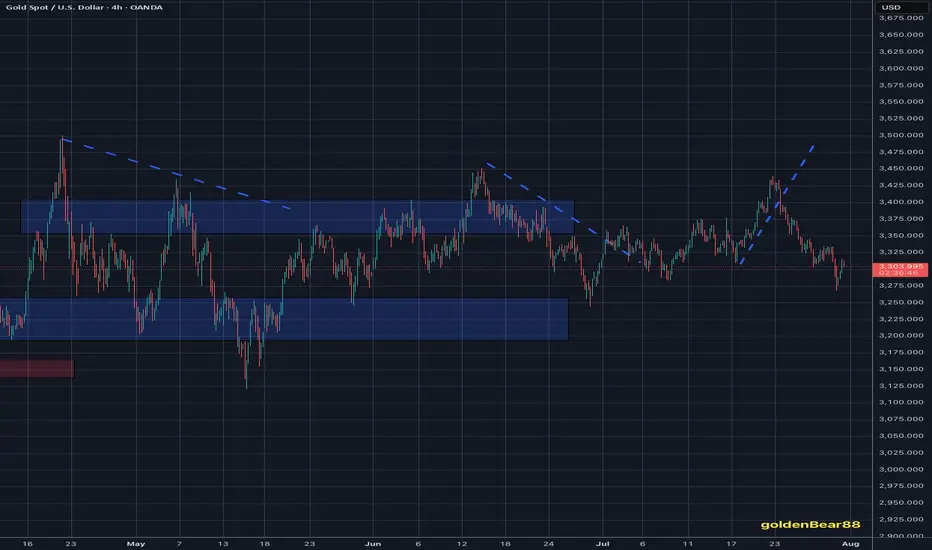
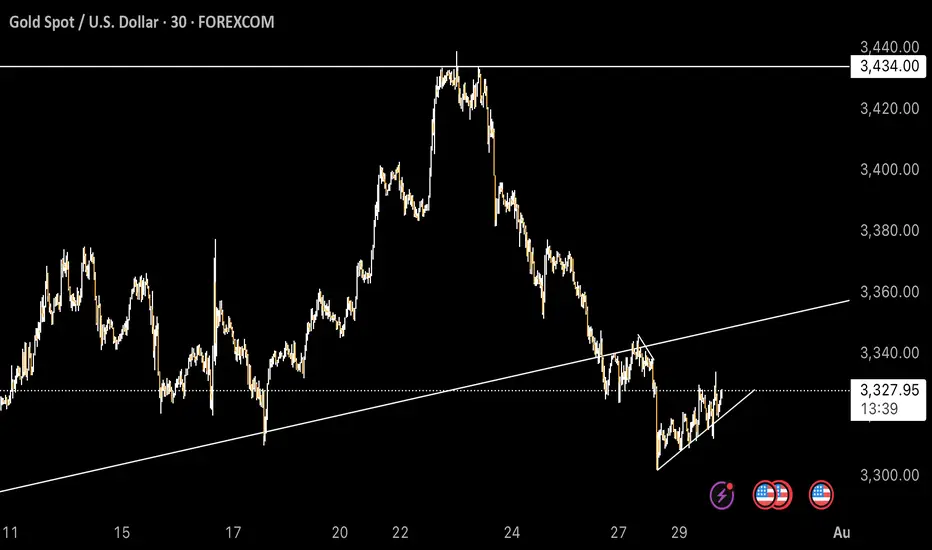
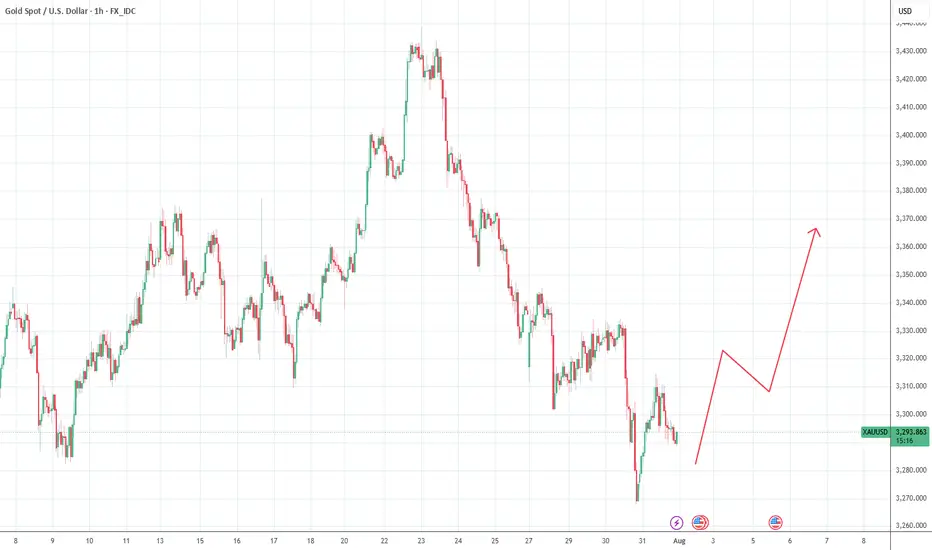
Gold next move (Read Description). Hello, Traders.
As we achieved more than 400 pips on last trade, Now I’m back with new idea for next move.
As you can see the gold is dropping since last few days.
Now the trend is bearish according Higher Time Frames and Bullish trend in Lower Time Frames, We will have to follow the Higher Time Frames to find the next move.
The market is creating the trend line buy according to H1,M30 and also respecting the trend line.
Keep in mind the trend is bearish, the gold will drop.
If the price doesn't breaks the 3347, then next move will be around 3284. If the price breaks the 3347 then gold will fly, trend will be change.
Kindly share your ideas and drop positive comments, Thanks.
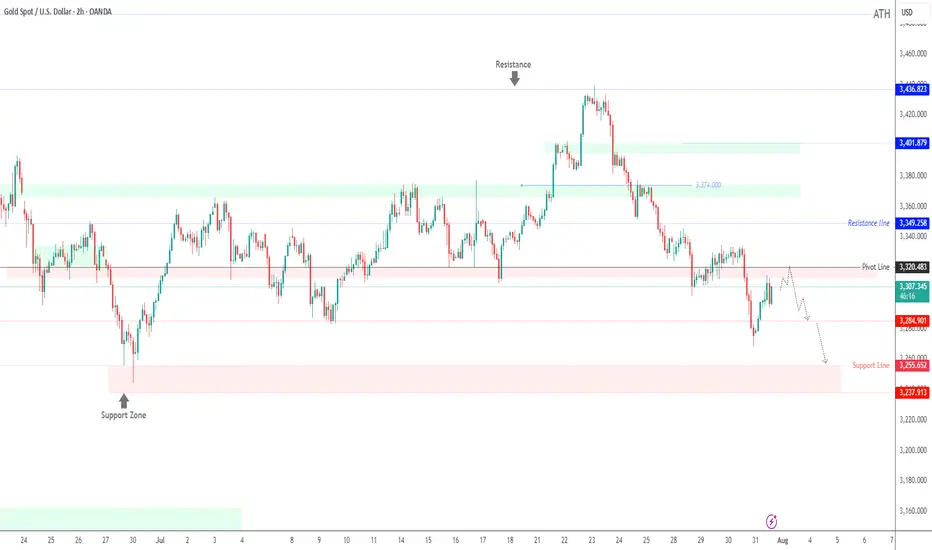
GOLD | Gold Eyes Pivot at 3347 – NY Session Close KeyGOLD | Gold Eyes Pivot at 3347 – NY Session Close Key
🕯Gold slipped slightly on Tuesday due to a stronger dollar, but remains close to a two-week high amid growing expectations of a U.S. rate cut in September.
⏺ Price has begun to retreat from the 3380 resistance, now heading toward the pivot level at 3347.
We’re watching for a potential reversal from 3347, especially if a 4H candle closes above this level during the New York session — this could trigger a bullish recovery toward 3365, and possibly retest 3380.
⏺ A confirmed breakout above 3380 would open the path for further upside toward 3402, but only if strong momentum is sustained.
If price closes below 3347 on the 1H, and this is confirmed by a 4H candle, it would likely reactivate bearish pressure toward the 3320 support.
• Resistance: 3365 – 3380 – 3402
• Support: 3320 – 3313

NFP ON DECK TODAY Gold is currently holding the Range of 3275-3310.
What's possible scanarios we have?
we have NFP data on deck today, expect potential volatility.
Until the release, gold may continue to range between 3275 and 3315.
This trade is totally unexpected how can gold react on numbers.
•If the H4 & D1 chart breaks below 3270, we could see a further drop toward the 3250 zone.
• Ifthe H4 & D1 chart flips above 3310, we could see a further Upside climb the 3335 -3345 zone.
Stay alert. Key levels in play.
#XAUUSD
Xauusd shortHigh probability short opportunity has risen on xauusd the reason being that price was consolidating in the rising wedge pattern and it manipulated the upper liquidity of the trend line ,so you may enter at the market price or put order above the current price

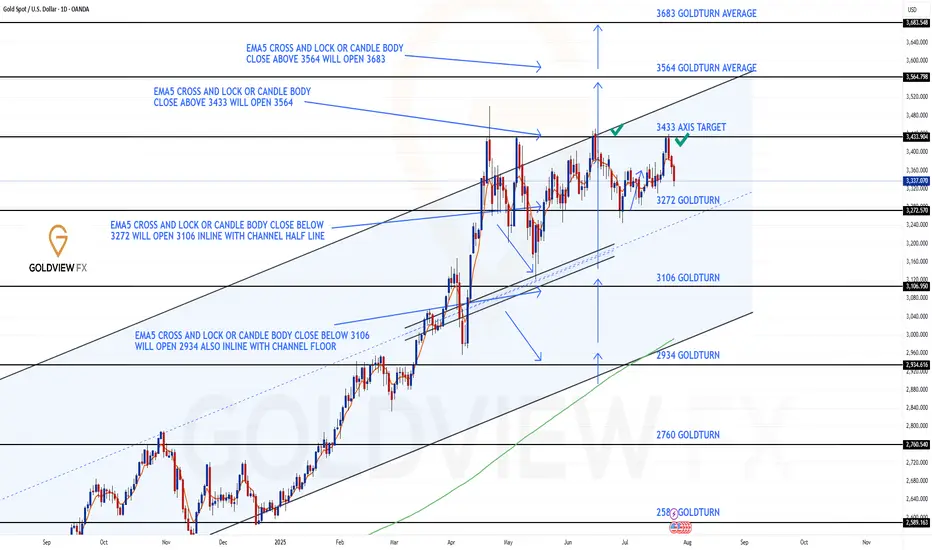
GOLD DAILY CHART ROUTE MAPHey Everyone,
Daily Chart Update – Bounce + Rejection: Structure Still Dominates
Just a quick follow up on our range structure, we got exactly what we were anticipating.
Price gave us the perfect bounce off 3272, launching into 3433 for THE test of resistance. That move delivered another clean 160+ pip rotation, once again showing how laser accurate the structure has been.
As expected, 3433 held as resistance, and the lack of a break and hold above confirms another clean rejection. The range between 3272 support and 3433 resistance remains firmly in play, and structure continues to govern price action to the pip.
Here’s where we are now:
🔹 Range Still Active
Price continues to rotate inside our 3272–3433 box. Until we see a clean break and close beyond either boundary, we’ll keep playing the range.
🔹 No Breakout = No Change
The failure to break and lock above 3433 confirms rejection. We’re still looking for EMA5 lock for potential breakout confirmation, until then, range trades rule.
🔹 Precision Holds
Both 3272 and 3433 have now been tested and held perfectly. The respect these levels continue to show reaffirms their importance in our roadmap.
Updated Key Levels
📉 Support – 3272
Continues to act as a major pivot. Valid long entries remain on dips into this zone, unless a breakdown occurs.
📈 Resistance – 3433
Now officially tested and confirmed. Watching closely for any future breakout attempts or another rotation lower.
Thanks again for all the amazing support. Sticking to the plan, trading the structure, and staying disciplined.
Mr Gold
GoldViewFX
Gold Slips After Powell Speech Below 3320 Bearish Pressure BuildGOLD Overview
Market Context:
Gold declined from the 3333 level, as anticipated in yesterday’s analysis, ahead of Fed Chair Powell’s speech. Powell reiterated that it is still too early for rate cuts, citing persistently high inflation, which supported the U.S. dollar and pressured gold.
Technical Outlook:
As long as gold trades below the 3320–3310 zone, the bearish momentum is expected to continue, with the next target at 3285. A confirmed break and stability below 3285 could open the way toward 3255.
To regain bullish traction, the price must stabilize above 3320.
Support Levels: 3285 • 3255
Resistance Levels: 3333 • 3349
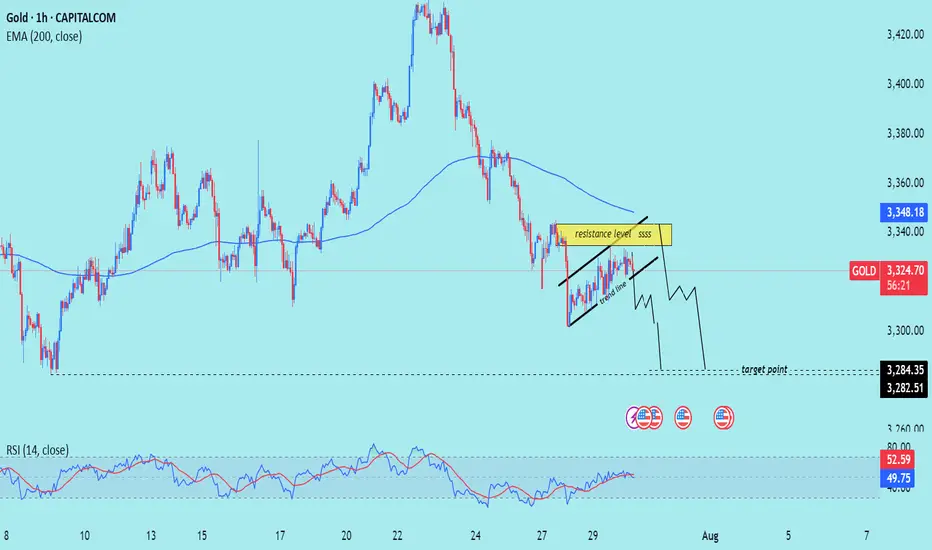
XAU/USD) Bearish Trend Read The captionSMC Trading point update
Technical analysis of Gold (XAU/USD) on the 1-hour timeframe, using a combination of trend lines, EMA, RSI, and price structure.
---
Technical Breakdown:
1. Price Structure:
Gold is forming a rising channel (black trend lines) within a short-term uptrend, but this is happening below the 200 EMA, which generally indicates bearish momentum.
A resistance zone is highlighted near the top of the channel, suggesting sellers might defend this level.
2. Key Level:
Resistance Level: Around 3,330–3,335 zone.
Target Point: Price is expected to break down from the channel and reach support levels near 3,284.35 and 3,282.51.
3. Moving Average (EMA 200):
Current price is below the 200 EMA (3,348.42), reinforcing a bearish bias.
4. RSI (14):
RSI is near 52.58, indicating neutral-to-slightly-overbought territory. No strong divergence is visible, but RSI is not confirming a bullish trend either.
5. Projection (Hand-drawn Path):
The drawn path shows a potential breakdown from the channel with a bearish impulse targeting lower support zones.
Mr SMC Trading point
---
Trade Idea Summary:
Bias: Bearish
Confirmation Needed: Break below channel support
Entry Zone: Near the resistance of the rising channel (~3,330–3,335)
Target Zone: 3,284.35 – 3,282.51
Invalidation: Sustained break above 3,348 (above EMA 200)
plesse support boost 🚀 this analysis)