GOLD trade ideas

XAUUSD ANNASIS OUTLOOK BEARISH MOVE POSSIBLE 5/8/2025 XAUUSD Bearish Watch
Sell zone: 3377–3380
Bearish targets: 3370 → 3365 → 3360
Invalidation: Above 3394
#XAUUSD #GoldSetup #TradingPlan

Analysis For The Next WeekHello Traders,
I hope you had joyful weekend, the market is going to open tonight so we are back with new idea for next week.
As you know gold was dropping for last two weeks and suddenly pumped almost 650 pips after the impact of NFP News. We saw the high pressure in the market on Friday due to news impact.
Gold has broken the buy trend line D1,H4. According to D1,H4 gold still wants to drop till 3251.
If price respects area 3372-3393, then gold will drop. If price breaks the area 3400 then it will pump and it can make another All Time High. As you know 3501 is the All Time High (ATH). Price can break if there will be a breakout for bullish moment.
Keep in touch and drop positive comments here, Thanks.

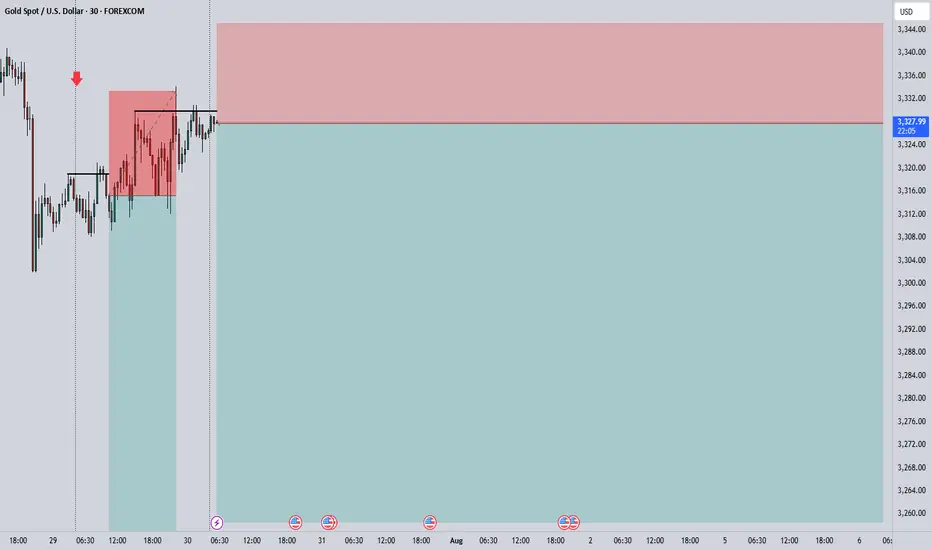
Gold Trend Reversal: MSS Completed Eyes on OB and Breaker Block!The gold market has executed a Market Structure Shift (MSS) in the New York session, indicating a trend reversal. Initially, the market made a Break of Structure (BoS) to the upside, but later dropped sharply and closed below the MSS level, confirming a bearish shift. Currently, the market is likely entering a retracement phase and may look to fill its Pending Demand (PD) arrays.
There are two critical levels from which the market could potentially drop again:
1. The first is an Order Block (OB).
2. The second is a Breaker Block (BB).
Keep a close watch on these two levels. If the market returns to either and presents bearish confirmation signals, it could resume the downward move towards swing lows.
Do Your Own Research (DYOR).

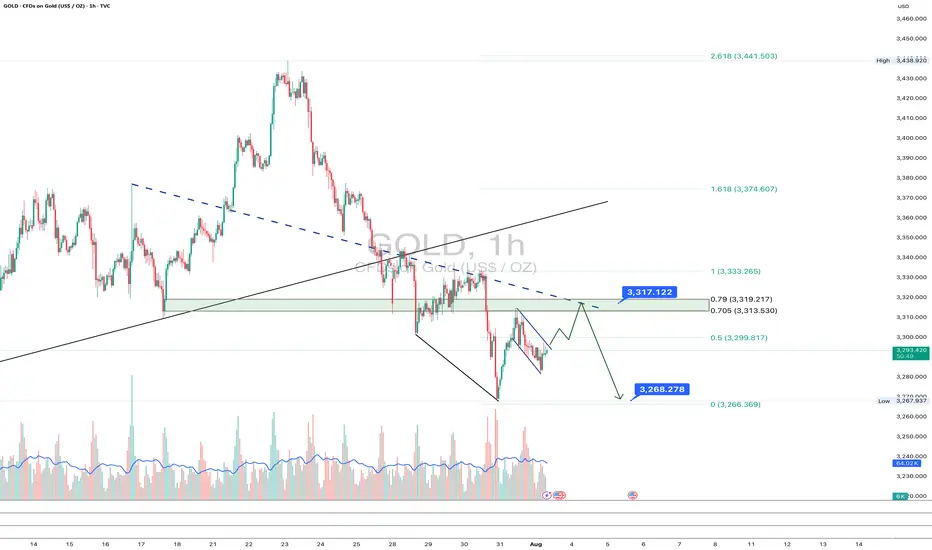
Gold: final pullback or bull trap?On the 1H chart, gold (GOLD) is forming a bullish flag after a sharp decline, which may just be a corrective move within a broader downtrend. The price is now approaching the key resistance zone around $3313–$3317 - this area holds the POC, broken trendline, and the 0.705–0.79 Fibonacci retracement from the last drop. This is the decision-making zone.
If bulls fail to push above it, we expect a move down toward $3268 - the next strong support and potential buy zone, also confirmed by Fibonacci and local demand. Stochastic divergence and slowing volume suggest a possible rebound from that level. However, if the price breaks and holds above $3317, this would indicate a local trend reversal, with targets at $3333 and $3374.
Watch the $3317 zone closely - bulls have yet to prove this is more than just a bounce.
XAUUSD idea 29/07/25We are waiting for our asset to reach our action zone, and based on the reaction, we’ll decide on our next moves.ALWAYS WAIT FOR A CONFIRMATION TO SEE IF THE PRICE VALIDATES THE ZONE.and you what is your vision of the EURUSD its interests me! i wait you in the commentary

XAUAUSD ideaWe are waiting for our asset to reach our action zone, and based on the reaction, we’ll decide on our next moves.ALWAYS WAIT FOR A CONFIRMATION TO SEE IF THE PRICE VALIDATES THE ZONE.and you what is your vision of the EURUSD its interests me! i wait you in the commentary

Gold is in very nice bearish opportunity ahead.Gold is in very nice bearish opportunity ahead. The level of 3000$ should be good for testing as a strong support for a next bull run. My tp now after confirmation is in betwwen a zone 3000-3050$.

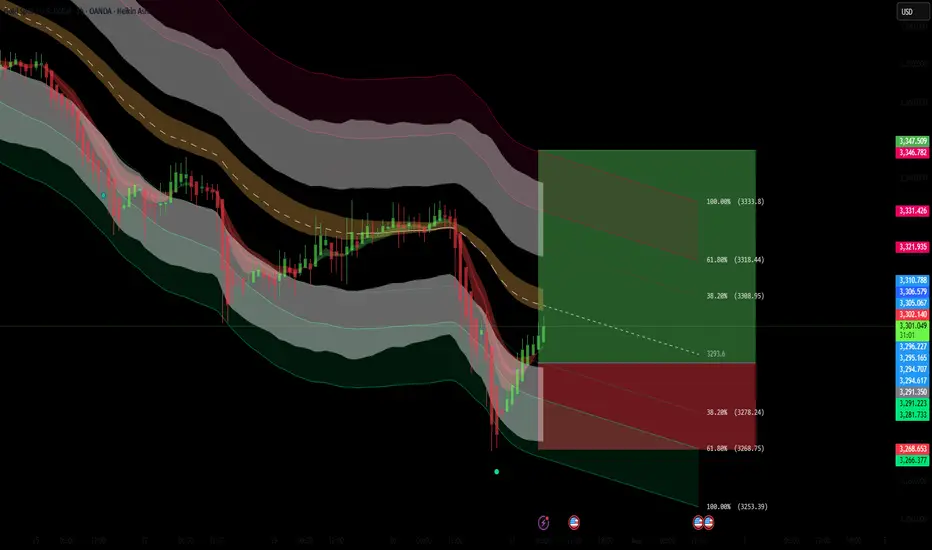
XAUUSD Long Setup – 1HGold (XAUUSD) has shown strong bullish rejection from the lower volatility band after a sharp selloff. The appearance of a Heikin Ashi reversal candle, suggests a short-term reversal is forming. Price has reclaimed key structure and is now targeting a reversion back to the mean, supported by Fibonacci retracement levels.
Entry: 3293.55
Target Zone: 3308.91 → 3333.76 (Fib 38.2% – 100%)
Stop Loss: 3253.35
Confluences:
✅ Bullish engulfing + Heikin Ashi trend shift
✅ Oversold bounce from lower channel extremity
✅ Fib retracement aligns with key structural resistance zones
✅ Custom signal confirmation (green dot)
✅ Clean R:R toward upper band and previous POI
Short-term counter-trend long targeting liquidity grab and mean reversion toward the 3308–3333 zone. Risk tightly managed with SL below local swing low.
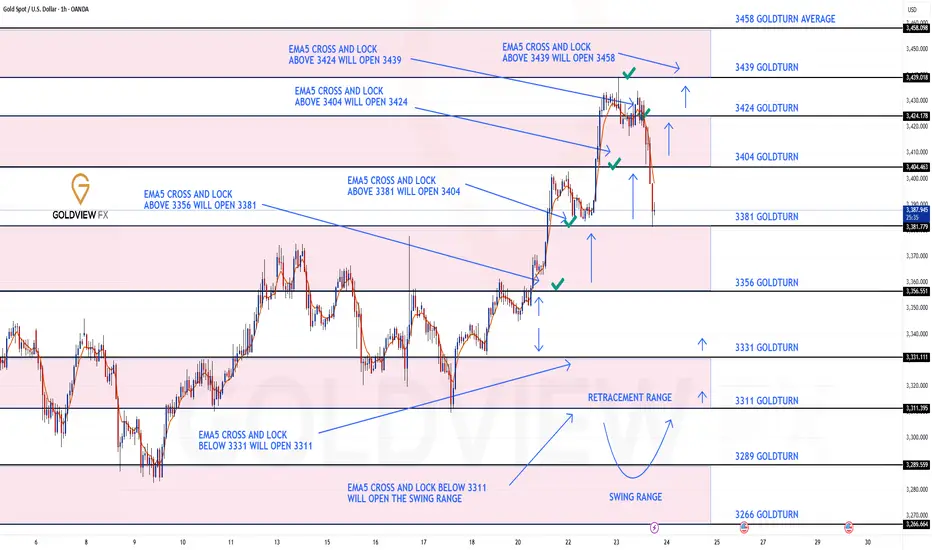
GOLD ROUTE MAP UPDATEHey Everyone,
Another PIPTASTIC day on the charts with our analysis once again hitting gold!!!
After completing all our bullish targets yesterday we stated that we will now look for EMA5 lock above 3424 to open the next bullish level at 3439.
- This played out perfectly completing 3439 to perfection!!
We are now seeing no further lock above 3439 confirming the rejection, which we are seeing now. We will now look for lower Goldturns to be tested for support and bounce inline with our plans to buy dips.
We will keep the above in mind when taking buys from dips. Our updated levels and weighted levels will allow us to track the movement down and then catch bounces up.
We will continue to buy dips using our support levels, taking 20 to 40 pips. As stated before, each of our level structures gives 20 to 40 pip bounces, which is enough for a nice entry and exit. If you backtest the levels we’ve shared every week for the past 24 months, you’ll see how effectively they were used to trade with or against short/mid-term swings and trends.
The swing ranges give bigger bounces than our weighted levels, that’s the difference between the two.
BULLISH TARGET
3356 - DONE
EMA5 CROSS AND LOCK ABOVE 3356 WILL OPEN THE FOLLOWING BULLISH TARGETS
3381 - DONE
EMA5 CROSS AND LOCK ABOVE 3381 WILL OPEN THE FOLLOWING BULLISH TARGET
3404 - DONE
EMA5 CROSS AND LOCK ABOVE 3404 WILL OPEN THE FOLLOWING BULLISH TARGET
3424 - DONE
EMA5 CROSS AND LOCK ABOVE 3424 WILL OPEN THE FOLLOWING BULLISH TARGET
3439 - DONE
EMA5 CROSS AND LOCK ABOVE 3439 WILL OPEN THE FOLLOWING BULLISH TARGET
3458
BEARISH TARGETS
3331
EMA5 CROSS AND LOCK BELOW 3331 WILL OPEN THE FOLLOWING BEARISH TARGET
3311
EMA5 CROSS AND LOCK BELOW 3311 WILL OPEN THE SWING RANGE
3289
3266
As always, we will keep you all updated with regular updates throughout the week and how we manage the active ideas and setups. Thank you all for your likes, comments and follows, we really appreciate it!
Mr Gold
GoldViewFX
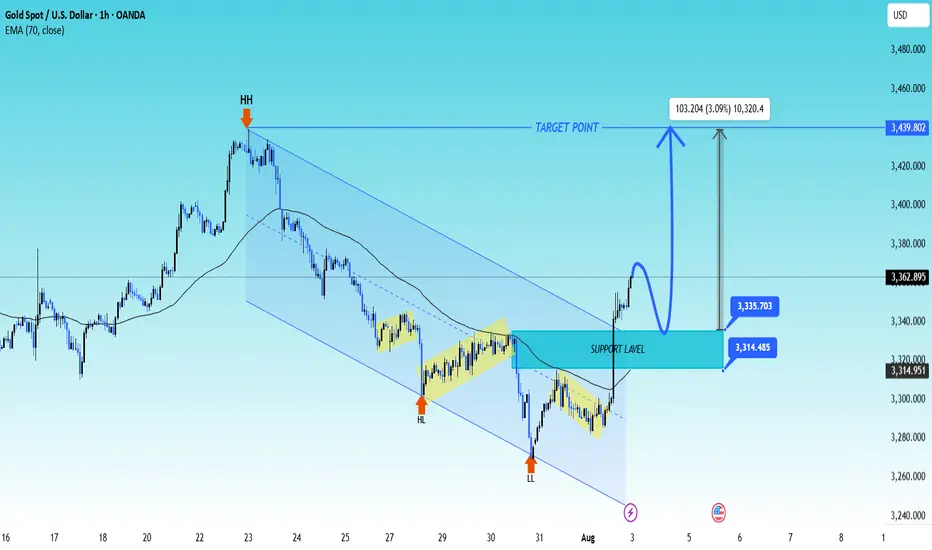
XAU/USD – Bullish Breakout Toward 3,440 Target🔹 Trend & Structure:
Market formed a Higher High (HH) followed by a Lower Low (LL), indicating bearish correction within a falling channel.
Price then created a Higher Low (HL) suggesting a potential trend reversal.
🔹 Channel Breakout:
Price broke above the descending channel, confirming bullish momentum.
A strong bullish candle closed above the 70 EMA, showing further strength.
🔹 Support Zone:
A support level between 3,314.485 – 3,335.703 is now established, which was previous resistance turned support.
🔹 Target Projection:
Using measured move strategy, the projected bullish target is around 3,439.802, a 3.09% move from the breakout zone.
🔹 Volume & Momentum:
Sharp bullish impulse indicates increased buying interest, supported by possible retest before continuation.
📈 Conclusion:
Bullish breakout confirmed. Ideal strategy:
🔹 Entry: On retest of the support zone (3,335 area)
🔹 Stop-loss: Below 3,314
🔹 Take-profit: Near 3,439
✅ Strategies used:
Trendline & Channel Analysis
Support/Resistance.
EMA (70) confirmation.
Price Action (HH, LL, HL)
Measured Move Target.
How to accurately capture golden trading opportunities?Bullish trend is still the main trend of gold at present. After rising to 3368 at the opening today, it fell under pressure and fluctuated. Technically, it has tested the pressure level and needs to be adjusted. The overall high-level carrying capacity has also declined, so it is not advisable to chase the rise too much. In terms of operation, it is recommended to wait for the price to stabilize before buying more. Judging from the current gold trend, the upper short-term resistance is in the 3380-3385 area, and the key pressure is at the 3395-3400 line; the lower short-term support is in the 3365-3355 area, and the key support is in the 3350-3345 range. The overall suggestion is to arrange long orders on dips around the support area, and try to maintain a stable wait-and-see attitude in the middle position. I will prompt the specific operation strategy at the bottom, please pay attention in time.
Gold Trading Strategy: Buy in batches as gold retreats to the 3365-3350 area, targeting the 3380-3385 area. If this resistance zone is broken, hold and look for upward movement.

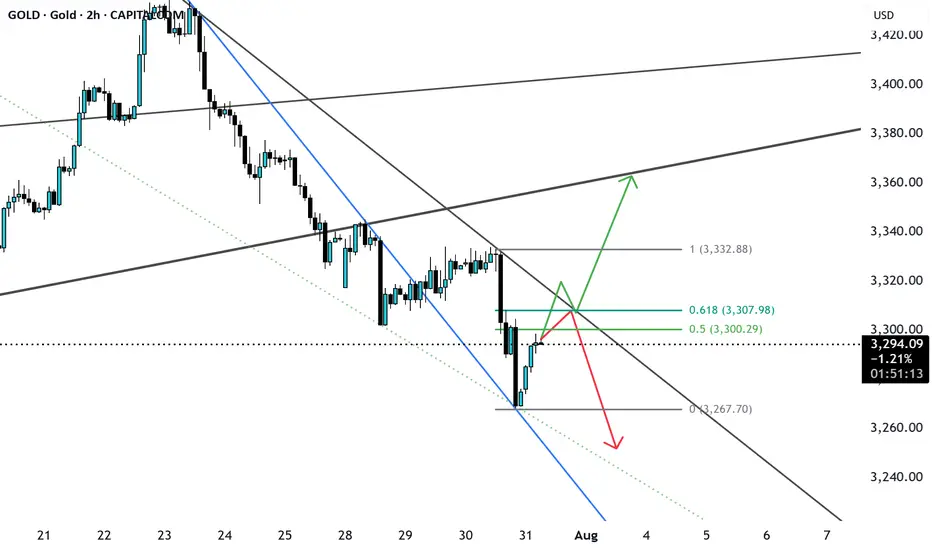
GOLD possible ScenarioCurrently gold has broken a major trendline and currently trading in bearish momentum, currently consolidating or pullback from support and may get rejected from 0.5 or 0.618 if bearish ahs to continue 3240-3250, if breaks the fib level along with trendline resistance can easily price can reach 3340 major resistance level. let us see.
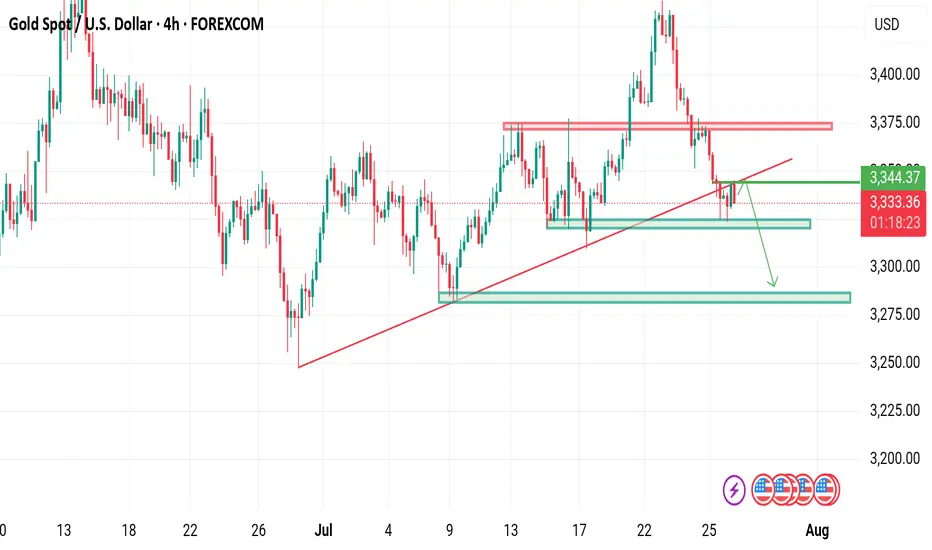
XAUUSD - Short XAUUSD Short Trade Idea – 4H Chart
Price has made a strong move up, but it's now entering an area where sellers were in control before.
Why I'm looking to short:
Price is retesting a supply zone where the last big drop started
It’s also near a resistance level and rejected from there
The downtrend is still valid with lower highs
There's a good chance price could drop to grab liquidity below
*** Target areas:
First target: around 3288
Final target: around 3250, where we have a demand zone
*** Invalidation:
If price breaks and closes above 3385, this short idea is no longer valid.
XAUUSD below trend Gold is currently below rising channel
What's possible scanarios we have?
▪️if H4 closed above 3345 ,I will be on bullish side till 3370-3380.
▪️if H4 candle closing below 3330 this Parallel moves upside will be invalid and we have targets at 3290 on mark I'm expecting selling move
#XAUUSD
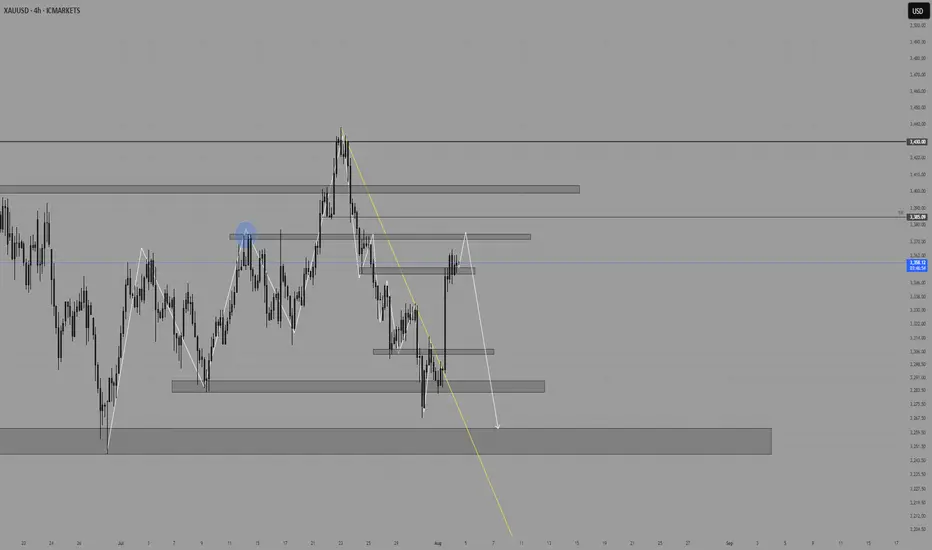
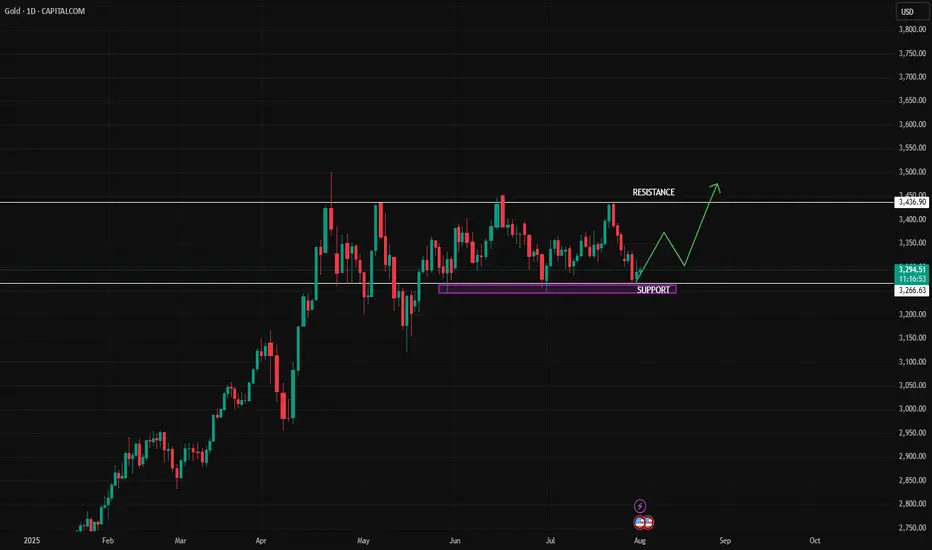
**"Gold Price Rebounding from Support:Potential Move Toward 3436This chart shows the **price movement of Gold (XAU/USD)** on a **daily timeframe**.
### Key Points:
* **Support Zone** : Around **\$3,266**, this is the area where price has bounced up multiple times, meaning buyers step in here.
* **Resistance Line**: Around **\$3,436**, this is the level where price has been rejected before, meaning sellers are strong here.
* **Current Price**: Around **\$3,293**.
### What the Chart Suggests:
* Price is near the **support** zone again.
* If the support holds, the green arrow shows a possible move **upward**.
* Price may first move up slightly, pull back, and then try to **break above resistance** at \$3,436.
Gold is in a sideways range. It's near a strong support level and might go up from here toward the resistance level, as shown by the green line.
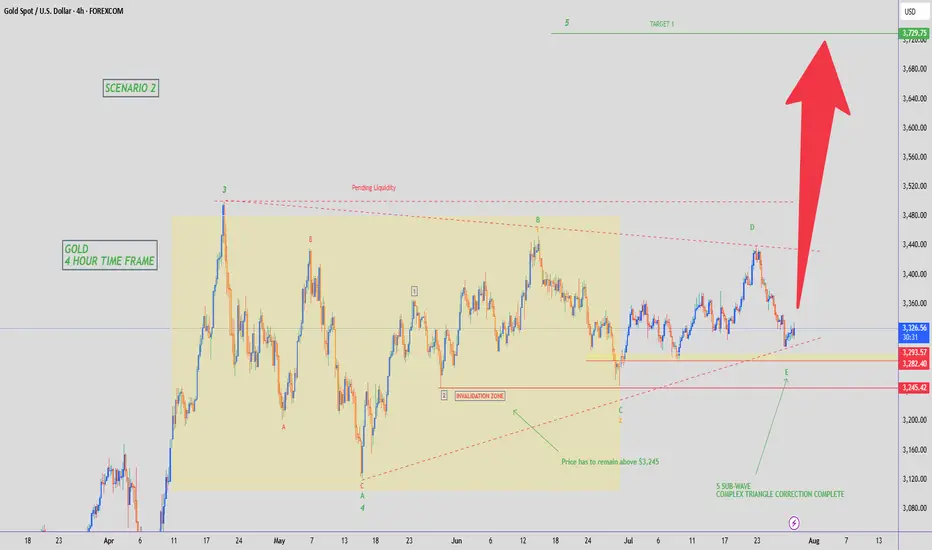
GOLD - WAVE 5 BULLISH TO $3,734 (UPDATE)Quick & simple ‘Elliott Wave Theory’ analysis for our Gold ALTERNATIVE SCENARIO.
⭕️Complex 5 Sub-Wave Correction.
⭕️Buyers Remain Above $3,245.
⭕️Pending LQ at $3,500.
How to accurately grasp the gold trading opportunitiesGold was greatly affected by the positive non-farm payroll data, and it rose strongly, with the increase completely covering all the losses this week. The current gold trend has completely reversed the previous bull-short balance. After breaking through the 3300 level and rising to around 3355, it maintains strong upward momentum, and the possibility of further testing the 3360-3375 area cannot be ruled out. Due to the strong positive data, if everyone fails to chase the long position or set a breakout long position in time in the first wave of the market, the subsequent pullback opportunities may be relatively limited, so it is necessary to maintain an active strategy in operation. It is recommended to continue to be bullish when it retreats to the 3335-3320 area, and the upper target is the 3360-3375 pressure range.

XAUUSD Update CONSOLIDATIONAfter bullish rejection, Gold make a new lower and break 3283 support level.
Now it seemslike bounce to make a correction and retest 3305 resistance.
If 3305 reject, price will continue moving downside and retest 3245 support.
If it break 3245...it will continue to find it support, near 3205 support zone.
Have a blessing day !

Gold Price Analysis July 30Gold (XAUUSD) Consolidating in a Triangle Pattern – Preparing for a Big Breakout
Currently, gold is moving within a triangle consolidation pattern, reflecting the market’s indecision as investors await a series of important economic data from the US this week. This hesitation suggests that a breakout from the triangle pattern could trigger a strong FOMO effect, creating a significant price movement in either direction.
The current price action is similar to a “bull flag” or “pennant” pattern, where a breakout could lead to a clearer and more decisive trend. If the support zone in the pattern fails to hold, the possibility of a sell-off is high.
Trading scenario:
🔻 Activate SELL order:
When price breaks the triangle bottom around 3324
Downside target: 3285, further is the strong support zone at 3250
🔺 Activate BUY order:
When price breaks and holds above the resistance zone 3333
Or: when there is a bearish rejection signal and candle confirmation at the area 3385

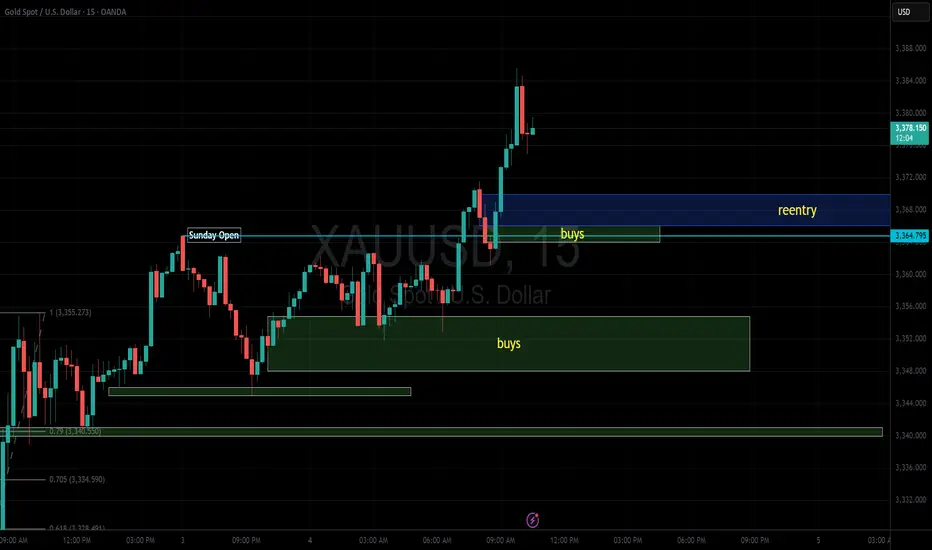
XAUUSD 8/4/25 followupPrice closed strongly above Sunday's open so I am just looking for retracements to the upside from here.
Today's GOLD Analysis : MMC Structural Analysis + Reversal ZoneThis analysis is rooted in MMC – Mirror Market Concepts, a framework designed to track institutional behavior through liquidity patterns, QFL (Quick Flip Levels), trendline shifts, and volume bursts. The current 4H Gold chart demonstrates a smart money footprint that provides actionable insight for intraday and swing traders.
🔍 Detailed Technical Breakdown:
🟦 1. Previous Supply Completed | Demand Zone Reversal
At the lower end of the chart, price entered a key blue zone around $3,250–$3,280, previously a supply zone now flipped into demand. This zone represents where institutional buyers absorbed liquidity, forming the base for a bullish impulse.
The strong reaction from this zone, marked by long-wick candles and immediate reversal, indicates exhaustion of selling pressure.
This reversal is confirmed by a QFL structure, meaning price created a fast liquidity sweep before flipping direction.
MMC recognizes this as a high-probability area of reversal, a point where smart money typically enters.
📈 2. Trendline Breakout & Structure Shift
A descending trendline, representing bearish market control, was decisively broken to the upside. This shift marks:
End of the corrective phase
Beginning of a bullish structural change
Buyers now control the short-term narrative
The breakout was not only clean but also supported by a volume burst, which is a classic MMC indicator that institutional traders are entering the market.
🔶 3. Volume Burst Confirmation
Volume behavior plays a critical role in MMC. We see a clear volume spike post-breakout. This suggests that:
The breakout is not false
Buyers were aggressively positioned
A sustainable move is in development
This supports the validity of the trendline breakout and confirms the idea that price is ready to test higher liquidity zones.
🟢 4. Current Price Structure: Bullish Channel
After the breakout, the market formed a bullish channel, where price is steadily climbing while respecting parallel boundaries.
The channel support line acts as a dynamic entry point for retracement buys
MMC strategy uses this structure to identify scaling entries at channel lows or after successful pullbacks into key reversal zones
🟩 5. Mini Reversal Area (Short-Term Resistance Zone)
Price is currently testing a minor supply zone or what MMC defines as a "Mini Reversal Area". This is a reaction zone before continuing toward the major target above.
There are two possible reactions:
Short-term rejection, leading to a pullback into the lower channel support zone
Minor consolidation, forming a base for a breakthrough toward major resistance
🟦 6. Major & Minor Supply Zones Above
Marked in light blue and green, these zones represent areas where previous selling volume and distribution occurred.
The major supply zone (approx. $3,440–$3,470) is the next institutional target
The minor zone sits between $3,400–$3,420 and may cause initial resistance or a base for another impulse
These levels are prime for partial profit-taking or scouting short-term reversal trades.
📊 Trade Management Insights:
🛒 Buy Opportunities (Long Bias):
On pullback into channel support near $3,340–$3,350
On bullish confirmation from mini reversal area
On break and retest above minor resistance at $3,420
🛑 Stop-Loss Suggestion:
Below the channel support or below the blue demand zone (approx. $3,245)
🎯 Profit Targets:
TP1: $3,400 (first resistance)
TP2: $3,420 (minor supply)
TP3: $3,450–$3,470 (major institutional level)
🧠 Mirror Market Concepts (MMC) Highlights:
QFL Structures = Institutional Reversal Points
Volume Burst = Confirmation of Breakout Validity
Trendline Breakout = Momentum Shift
Channel Structure = Controlled Climb Pattern
Mini Reversal Zone = Key Decision Point Before Continuation
🧭 TradingView Summary for Minds Community:
This GOLD chart beautifully aligns with the MMC method — spotting smart money involvement early and aligning with their flow. After confirming structural reversal via trendline and QFL, the setup now looks poised for continuation toward the $3,440–$3,470 zone, making it a perfect chart to watch for buy-the-dip setups.
