xauusdxauusd Focus on red line
From the price level of 3368 and above, gold is expected to pull back at least until the Stochastic on the M30–H1 timeframes reaches oversold levels.
After that, a bullish continuation is likely, pushing the price up to around 3400.
This area will be a critical decision point — determining whether the market will continue its uptrend or reverse into a downtrend.
If the H4 chart prints a reversal candlestick pattern, it would indicate the beginning of a bearish trend, which could potentially lead to a downward movement of up to 20,000 points.
GOLD trade ideas

SMC ✅ Strengths:
• Previous mitigation of institutional interest zones (1H FVG).
• BOS (Break of Structure) indicating bullish intent.
• Entry located at the 5M OB, which coincides with support and fake out (consistent with liquidity re-entry).
• TP is aligned with the previous resistance and distribution zone, which provides a good RR (2.23).
Good luck Traders

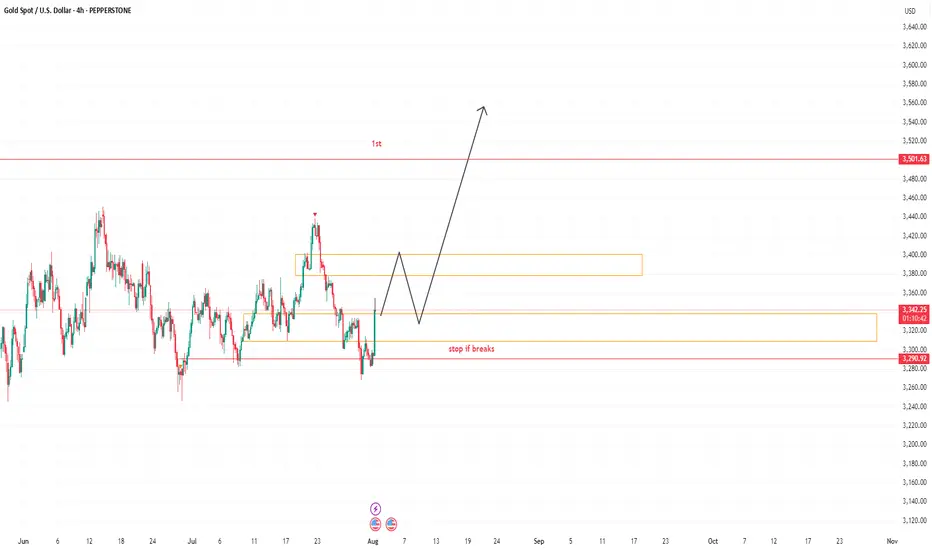
GOLD CONTINUATION PATTERNHello folks, here we go again, This idea stuck in my head only today and its friday. rather shared it or none, but see the charts for stops and target. this might be your lucky day on my page.
Here is my idea, take it if you love to swing or watch it fade. Congrats were on 800 community or I got more followers because of this. and Previous idea we made a lot thats 1200 pips good for a month trade. lets see this August. my target is labeled this chart first at 3500 zone. next target will be posted on my notes or updated the idea. no charts until it breaks that labeled on chart. until it goes higher again.
You will never see this kind of idea for a month again. So follow on my page, I have some for you if you have small accounts.d m here
My goal is to target the highest TP will be above this new highs.
Is Gold 3400 Still Far Away?
💡Message Strategy
The spot gold market experienced a V-shaped reversal trend.Driven by unexpectedly weak U.S. non-farm payrolls data and risk aversion triggered by Trump's new tariff policy, gold prices rose nearly 2% on Friday to a one-week high of $3,347.66 per ounce, up 0.4% for the week. The Federal Reserve kept interest rates unchanged, but weak employment data rekindled expectations of a September rate cut, increasing the appeal of gold as a non-yielding asset.
At the same time, Trump's decision to impose tariffs of 10%-41% on many countries has exacerbated market concerns about global trade tensions and boosted the safe-haven demand for gold.
📊Technical aspects
The 1-hour moving average of gold has begun to turn upward, and the 1-hour moving average of gold has a double bottom structure. However, gold should not have such a large pullback for the time being. After the non-farm payrolls on Friday, gold fell back to the 3335 line and then began to fluctuate upward at a high level. The 3335-3345 area was also an important platform support in the early stage. Therefore, gold will mainly be bought on dips above 3335 next week.
💰Strategy Package
Long Position:3345-3355,SL:3325,Target: 3380-3400

XAUUSD Long SetupXAUUSD has shown good sign on the zone and possible movement has been shown in the analysis. Consider it take the setup with keeping your risk management in consideration.
maintain selling pressure around 3300, GOLD ⭐️GOLDEN INFORMATION:
Gold prices extended their slide for a fourth straight session, falling over 0.60%, as the U.S. and European Union reached a weekend trade agreement that halved proposed tariffs on EU goods—from 30% to 15%. XAU/USD is currently trading around $3,312, after earlier touching a high of $3,345.
The trade breakthrough lifted market sentiment, boosting risk appetite. Meanwhile, the U.S. Dollar is regaining strength, with the Dollar Index (DXY)—which measures the greenback against a basket of six major currencies—rising 0.99% to 98.64.
⭐️Personal comments NOVA:
Gold price maintains selling pressure around 3300, continuing the downtrend
⭐️SET UP GOLD PRICE:
🔥SELL GOLD zone: 3353- 3355 SL 3360
TP1: $3345
TP2: $3332
TP3: $3317
🔥BUY GOLD zone: $3287-$3285 SL $3280
TP1: $3295
TP2: $3307
TP3: $3320
⭐️Technical analysis:
Based on technical indicators EMA 34, EMA89 and support resistance areas to set up a reasonable SELL order.
⭐️NOTE:
Note: Nova wishes traders to manage their capital well
- take the number of lots that match your capital
- Takeprofit equal to 4-6% of capital account
- Stoplose equal to 2-3% of capital account
Gold Trade Plan 31/07/2025Dear Traders,
3304-3307 is very important area for Gold,
Pay close attention to the 3303-3307 zone. If you see a rejection in this area, you can enter a sell position.
if Fix above 3305------> 3351
IF Fix below 3305----->3267 (again)
Regards,
Alireza

XAUUSD Weekly Outlook – August 4–8, 2025New Month. New Week. New Questions.
Will the market reward hesitation — or bold reaction?
Will POTUS pump price with policy noise, or will smart money fade the manipulation?
August is historically a quieter month for hedge funds — but don’t mistake silence for safety. It's also the time when the Fed retreats to Jackson Hole, reflecting and recalibrating. Will September bring another rate cut… or another twist?
Stay sharp. This isn’t a month to sleep on.
"Last week's game plan played out nearly to perfection — well, almost! Let’s dive in and break down where gold could be headed next week."
Gold kicks off August with a strong breakout above $3360, powered by a weakening U.S. dollar, rising global risk appetite, and persistent institutional demand. With Jackson Hole on the horizon and shifting Fed expectations, volatility is set to spike. The big question: will gold extend above premium, or retrace to rebalance?
After the last rejection near 3440, price broke cleanly below its ascending channel. Now, gold appears to be forming a potential lower high around the broken trendline — a rejection here could trigger a drop toward the key $3250 support zone.
🟡 XAUUSD – August Macro Outlook
💰 Price: $3362
📅 Date: August 3, 2025
📈 Bias: Bullish but extended — high in premium
🔸 Monthly Overview
📊 Trend: Bullish continuation (CHoCH April 2023)
🧱 Supply Zone: 3350–3439 → monthly wick trap
⚠️ RSI 80+, price nearing 100% Fib extension
🔮 Breakout above 3439 → 3505 / 3610 next
🔻 Rejection → pullback to 3270 / 3180
🔸 Weekly Outlook
💥 Structure: Strong bullish, EMA stack intact
🟥 Final HTF Supply: 3350–3439 (currently testing)
🟦 Demand Below: 3270 → 3215 → 3070
🎯 Targets if breakout: 3505 → 3560 → 3610
🔸 Daily Structure
⚔️ Now testing: 3355–3375 → last valid supply
🎭 Above that → internal trap at 3398–3412
🧨 Final ceiling at 3430–3439 — breakout or reversal?
🔸 H4 / H1 Key Zones
🟥 Supply: 3360–3375 / 3385–3398 / 3430–3439
🟫 Flip Long Zone: 3322–3310
🟦 Bullish Demand: 3285–3260 → 3222–3205
⚠️ RSI elevated, watch for reaction not breakout
🔹 Execution Plan
✅ Above 3439 → Expansion to 3505 / 3610
🔁 Pullback to 3325 / 3285 → Sniper long zones
🔻 Rejection from 3375 → Short scalp → Target 3320
📌 3439 = Key Monthly Pivot
🟢 Hold above → New expansion wave
🔴 Fail below → Retrace toward value
Extended:
🔸 Scenario 1: Breakout and Expansion
If bulls push through 3375 with conviction and break above 3439, gold enters a fresh leg of macro price discovery. This would activate a clean expansion path toward:
3405 (short-term extension)
3505 → 3560 → 3610 (Fibonacci projections)
3740 (full trend extension if momentum persists)
This scenario requires solid bullish confirmation, especially on H4 or D1 structure. Traders should look for LTF OB re-entries or bullish flags above 3350 to join the trend safely.
🔸 Scenario 2: Rejection and Retrace
If gold rejects from the 3360–3375 zone and fails to hold above it, a controlled retracement is likely. Key downside targets include:
3325 → first flip zone for re-entry
3285 → origin of the latest rally (strong buy zone)
3215–3180 → high-timeframe demand and imbalance fill
Only a breakdown below 3260 would threaten the bullish structure and shift bias toward neutral or bearish.
🔸 Conclusion
Gold is approaching its inflection point. The macro trend is intact, but momentum is stretched, and the market now demands clear validation.
📌 3439 remains the weekly pivot:
Above → Expansion toward 3500+
Below → Retracement to reclaim value
For next week, the most probable path is early consolidation inside 3360–3375, followed by a decisive reaction — either continuation toward 3405+, or a corrective drop toward 3325/3285 to reset structure.
Disclaimer: For educational context only.
#XAUUSD #Gold #SmartMoney #TradingAnalysis #SMC #USD #GoldOutlook

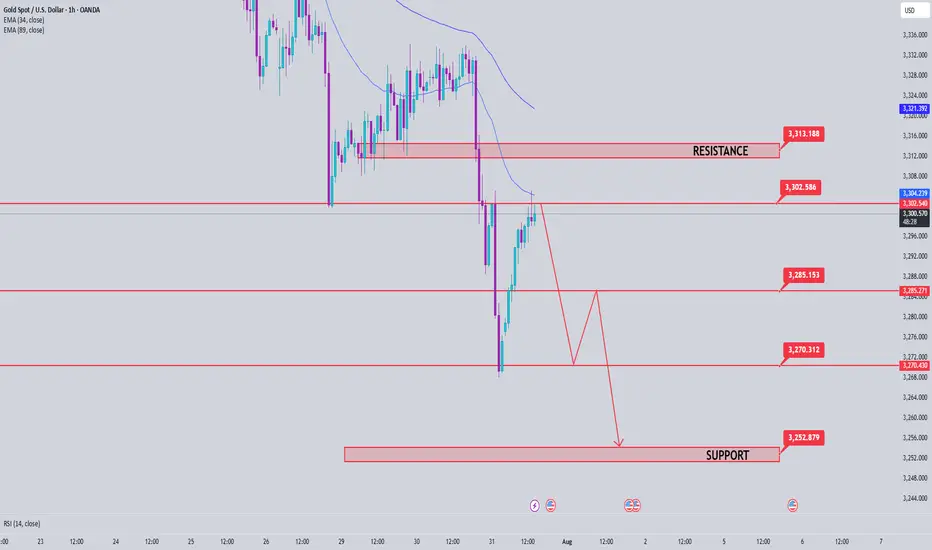
Gold price analysis July 31XAUUSD – Bearish pressure still prevails, watch for SELL in the direction of the trend
Yesterday's session witnessed a strong decline when the D1 candle closed with selling pressure up to 60 prices, forming a key candle that shapes the trend. When the market forms a main candle, the 25% and 50% candle body areas are often important price areas to continue trading in the direction of the main trend.
In the current context, the priority strategy will be to sell in the direction of the downtrend when the price rebounds to the resistance areas and there is a rejection signal.
🔹 Important resistance areas:
3301 – 3312 – 3333
🔸 Target support areas:
3285 – 3270 – 3250
🎯 Trading strategy:
Prioritize SELLing at the resistance area of 3301–3312 when there is a price reaction (rejection).
Target: 3250
BUY only considered when 3313 area is broken decisively.
Staying disciplined and sticking to the reaction price zone will be key in the context of the market moving in a clear trend.
Gold OutlookAfter our last idea, I'm looking to see gold sell down and then resume the upward trend. This is my personal conviction, always remember, I do not own the market

XAU / USD Weekly ChartHello traders. Just wanted to repost this weekly chart that shows the scalp trade set ups I will be looking for this week. All wicks get filled, albeit even partially if not full. Saying that, I will be monitoring the market to see how the overnight sessions play out. I will post some lower time frame analysis as we get into the week, or when I am gonna take a trade. New month, so trade carefully. Big G gets my thanks.. Be well and trade the trend. Wishing everyone a profitable trading week. I am gonna try to post the charts right as , or before I take any trades. Thank you so much for checking out my weekly chart analysis.

XAU/USD) Bearish Trend Read The captionSMC Trading point update
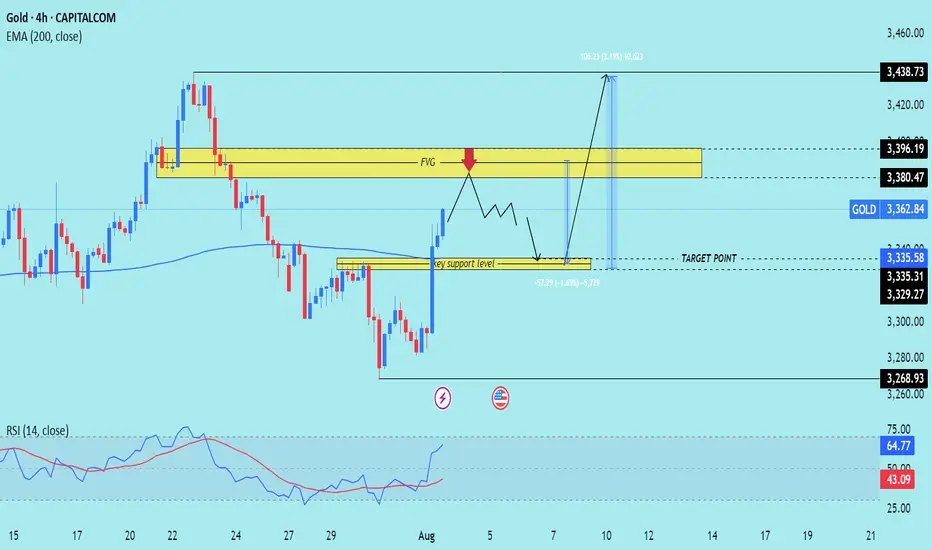
Technical analysis of (XAU/USD) on the 4-hour timeframe, showing both a potential retracement and a bullish continuation.
---
Technical Breakdown:
1. Current Market Structure:
Price recently made a strong bullish push from the key support level (~3,329–3,335), breaking structure to the upside.
It is now approaching a Fair Value Gap (FVG) and resistance zone between 3,380.47 and 3,396.19.
2. Key Zones Identified:
FVG / Resistance Zone: 3,380.47–3,396.19 — where price might initially reject (red arrow) due to unfilled imbalance and previous supply.
Key Support Zone: 3,329.27–3,335.31 — potential area of re-entry or demand if price pulls back.
EMA 200 (Blue): Currently at 3,335.58, aligning with key support.
3. Price Path Scenarios:
Primary Expectation: Price may tap into the FVG, face rejection, then pull back into the key support level for a higher low.
From there, it is projected to bounce back strongly toward the ultimate target at 3,438.73, marking a 3.19% upside move.
4. RSI (14):
RSI at 64.77, indicating strong bullish momentum but not yet in overbought territory. Favorable for continuation, but a short-term correction is possible.
Mr SMC Trading point
---
Trade Idea Summary:
Bias: Bullish (after a short-term rejection)
Entry Zones:
Watch for rejection at 3,380–3,396
Look to enter on a retest of 3,335–3,329 support
Target Zone: 3,438.73
Invalidation: Sustained breakdown below 3,329 or bearish engulfing with high volume
EMA & RSI Support: EMA 200 backs bullish bias; RSI confirms momentum
Please support boost 🚀 this analysis)
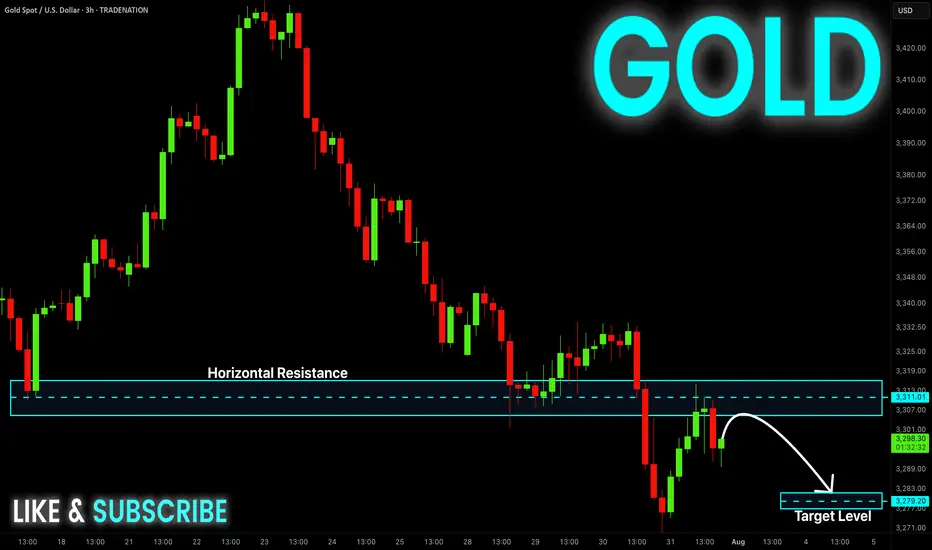
GOLD Local Short! Sell!
Hello,Traders!
GOLD made a retest
Of the horizontal resistance
Of 3313$ and we are already
Seeing a bearish reaction and
We will be expecting a further
Bearish move down
Sell!
Comment and subscribe to help us grow!
Check out other forecasts below too!
Disclosure: I am part of Trade Nation's Influencer program and receive a monthly fee for using their TradingView charts in my analysis.
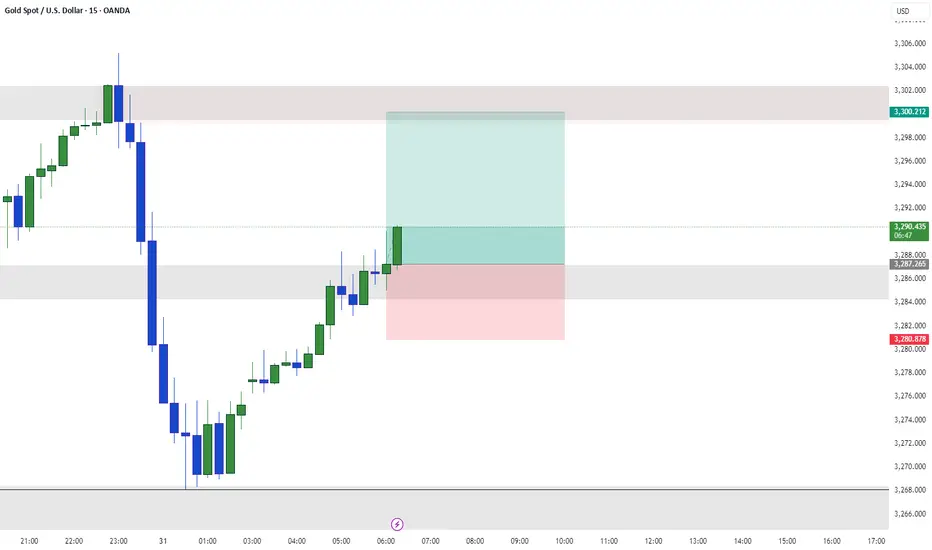
Gold Spot / U.S. Dollar Analysis (15-Minute Chart)Key Levels
Support Levels:
Immediate: 3,294.000 (S/L level)
Next: 3,280.000
Resistance Levels:
Immediate: 3,304.000 (Entry level)
Next: 3,308.000, 3,316.250, 3,320.000
Profit Targets:
Tiered levels up to 3,328.000 (highest target).
Price Action & Trends
Current Trend:
The price is bullish (+0.84% today) but hovering near the entry level (3,299.000) and testing 3,302.700.
The presence of multiple profit targets above suggests a bullish bias in the trade setup.
Critical Observations:
Price recently dipped to 3,294.000 (S/L) but rebounded, indicating buying interest at support.
The 3,304.000 level (entry) now acts as resistance. A breakout above could target 3,308.000+.
Volume & Momentum:
Not visible in the screenshot, but the upward movement suggests moderate bullish momentum.
Trade Setup Analysis
Entry: 3,299.000
Stop-Loss: 3,294.000 (5 USD below entry)
Profit Targets:
3,304.000 (Breakeven+)
3,308.000 → 3,328.000 (Scalping opportunities).
Risk-Reward Ratio:
If targeting 3,328.000, the RR is ~5:1 (29 USD profit vs. 5 USD risk).
Actionable Insights
Bullish Scenario:
Hold if price sustains above 3,304.000 (entry resistance).
Next target: 3,308.000.
Bearish Caution:
If price falls below 3,294.000 (S/L), exit to limit losses.
Watch for rejection at 3,304.000 (potential reversal).
Market Context:
Gold is sensitive to USD strength and geopolitical events. Monitor broader trends for confirmation.

Beyond the Chart – GOLD Market Technical Analysis🧠 OANDA:XAUUSD Market Outlook: Gold (XAU/USD)
✅ Bullish Case (Upside Bias)
• Price has reclaimed multiple Fair Value Gaps (FVGs) on the way up.
• Holding above the 0.382 Fib level (3293) indicates moderate bullish momentum.
• A confirmed breakout above 3301 (0.5 Fib) may open the path to key resistance levels:
• 3308 (0.618 Fib)
• 3314 (0.705 Fib)
• 3319 (0.786 Fib)
📌 This move is likely a retracement rally within a broader downtrend — unless price reclaims above 0.786 with strength, confirming a shift in structure.
⸻
🛠️ Trading Plan
• Bullish Setup: Long above 3301, targeting 3308 → 3314, with tight stops.
• Bearish Setup: Look for rejection patterns at 3308–3314 zone, targeting a move back to the 3280 area.
⸻
📘 Disclaimer: This is educational content and not financial advice. Always do your own analysis and manage your risk accordingly

GOLD FOMC Ok it will be rising this previous FOMC 90 minutes but then will fall fasta and sharp
Sell levels 3305 / 3310 SL above .618
Targets 3277 3263
Reversal spectation on 3263 towars all time highs 3550 and 3650

XAUUSD: Market Analysis and Strategy for July 29Gold Technical Analysis:
Daily chart resistance: 3345, support: 3285
4-hour chart resistance: 3340, support: 3300
1-hour chart resistance: 3330, support: 3308.
After last week's sharp decline, gold continued its decline yesterday, breaking below its opening low and continuing its downward trend, reaching a low near 3300. In the short term, selling pressure is strong, but the rebound is weak, with a rebound high of 3330.
In terms of intraday trading, yesterday's low of 3301 was followed by a rebound. Focus on the resistance range of 3330-3338. Selling is recommended if the price is trading sideways between 3330-3338, with a defense of 3340. If it falls below 3300, the next target will be 3285.
Sell: 3338
Buy: 3302
Sell: 3300

GOLD H4 | Could the price reverse from here?XAU/USD is reacting off the sell entry at 3,382.85, which is a pullback resistance and could reverse from this level to the take profit.
Stop loss is at 3,432.37, which is a swing high resistance.
Take profit is at 3,333.65, which is a pullback support that is slightly above the 50% Fibonacci retracement.
High Risk Investment Warning
Trading Forex/CFDs on margin carries a high level of risk and may not be suitable for all investors. Leverage can work against you.
Stratos Markets Limited (tradu.com ):
CFDs are complex instruments and come with a high risk of losing money rapidly due to leverage. 65% of retail investor accounts lose money when trading CFDs with this provider. You should consider whether you understand how CFDs work and whether you can afford to take the high risk of losing your money.
Stratos Europe Ltd (tradu.com ):
CFDs are complex instruments and come with a high risk of losing money rapidly due to leverage. 66% of retail investor accounts lose money when trading CFDs with this provider. You should consider whether you understand how CFDs work and whether you can afford to take the high risk of losing your money.
Stratos Global LLC (tradu.com ):
Losses can exceed deposits.
Please be advised that the information presented on TradingView is provided to Tradu (‘Company’, ‘we’) by a third-party provider (‘TFA Global Pte Ltd’). Please be reminded that you are solely responsible for the trading decisions on your account. There is a very high degree of risk involved in trading. Any information and/or content is intended entirely for research, educational and informational purposes only and does not constitute investment or consultation advice or investment strategy. The information is not tailored to the investment needs of any specific person and therefore does not involve a consideration of any of the investment objectives, financial situation or needs of any viewer that may receive it. Kindly also note that past performance is not a reliable indicator of future results. Actual results may differ materially from those anticipated in forward-looking or past performance statements. We assume no liability as to the accuracy or completeness of any of the information and/or content provided herein and the Company cannot be held responsible for any omission, mistake nor for any loss or damage including without limitation to any loss of profit which may arise from reliance on any information supplied by TFA Global Pte Ltd.
The speaker(s) is neither an employee, agent nor representative of Tradu and is therefore acting independently. The opinions given are their own, constitute general market commentary, and do not constitute the opinion or advice of Tradu or any form of personal or investment advice. Tradu neither endorses nor guarantees offerings of third-party speakers, nor is Tradu responsible for the content, veracity or opinions of third-party speakers, presenters or participants.

XAUUSD Long - DiscretionaryElite Analysis - Discretionary Trade
Not Rules Based Execution
Executed in a lower OB in lower time frame
Targeting upper liquidity pools
I believe we are bullish on gold until structured liquidity, than we will see an violent drop.
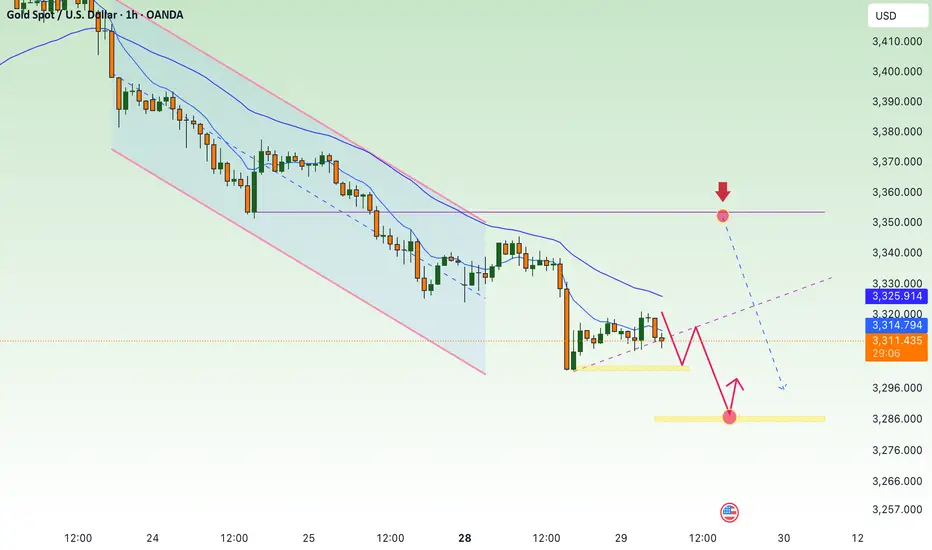
Bounce From Final Liquidity or Start of a Bullish Move? Bounce From Final Liquidity or Start of a Bullish Move?
After the FOMC event, gold completed a sweep of the final liquidity zone at 3269–3271 and rebounded strongly, in line with the broader bullish trend. The price has now recovered sharply and is gradually returning to the liquidity zones left behind after yesterday’s sharp drop.
📍 At the moment, gold is reacting around 3295, which aligns with a CP (Compression Point) Zone on the M30 chart. We're seeing a slight pullback here, and another retracement could occur before a strong upward continuation — potentially breaking out of the descending trendline that’s formed over recent days.
📊 Trading Plan & Key Levels
✅ BUY ZONE – Trend Continuation Setup
Entry: 3286–3284
Stop Loss: 3278
Take Profits:
3290 → 3294 → 3298 → 3304 → 3308 → 3312 → 3316 → 3320 → 3330 → …
💡 This is a prime area to look for re-entries into the dominant bullish move. Price action left a clean liquidity zone below after the aggressive upside reaction — ideal for riding the next wave.
❌ SELL ZONE – Only Valid Below VPOC
Entry: 3328–3330 (Volume Point of Control)
Stop Loss: 3335
Take Profits:
3324 → 3320 → 3315 → 3310 → 3305 → 3300
🔻 This is a high-probability short only if price stays below 3330. If gold closes above this VPOC region, the structure shifts to bullish and we should look for sells higher up — around 335x–337x zones.
📅 Monthly Candle Close – Watch for Indecision
As it’s the last trading day of the month, note that the past two monthly candles have printed doji-like wicks, signalling indecision and liquidity grabs. The market is still waiting for a clearer signal from the Fed on the first potential rate cut of the year.
🚫 Avoid emotional trading. This is a highly reactive environment, so careful risk management is key.
🧭 Final Thoughts
Gold continues to respect market structure and liquidity theory. The first major test lies at the 3313 resistance level — if broken, it opens the door to stronger bullish momentum toward the broader VPOC zone.
⏳ Be patient and only act when price confirms your bias.

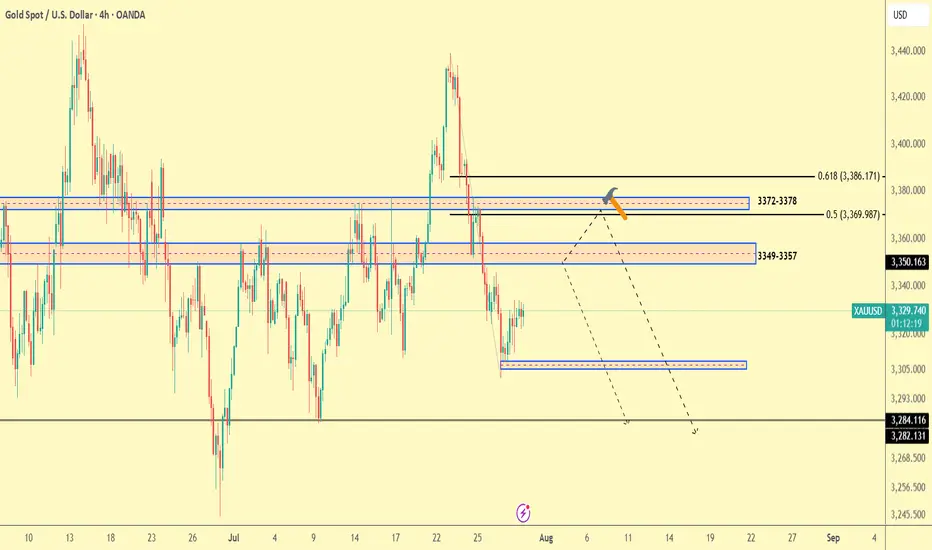
Gold Trade plan 30/07/2025Dear Traders,
This chart represents the XAU/USD (Gold / U.S. Dollar) pair on a 4-hour timeframe. The market is showing a series of Fibonacci retracements and key levels, with potential price action zones marked for future movements.
Key Levels:
Resistance Zones: At 3,422.105 (near the green line), followed by the 3,386.171 level (Fibonacci 0.618).
Support Zones: Major support is visible near 3,282.131 (bottom of the chart), with additional minor support levels at 3,305.000 and 3,293.000.
Mid-range Support: Around 3,369.987.
Potential Price Action:
The price recently dropped from higher levels, breaking below the previous support levels. The market seems to be testing lower support zones.
A potential move down towards 3,284.116 or 3,282.131 is likely if the current support levels do not hold.
Conversely, if price action holds the current support zone (3,329.040), a retest of the higher resistance at 3,350.163 could occur.
Fibonacci Levels:
Retracement Levels: The Fibonacci retracement is drawn with key levels, particularly around 3,372-3,378 and 3,349-3,357, acting as strong support or resistance.
Extensions: There is potential for the price to move towards the 3,420 region if resistance levels break.
Strategy Suggestion:
Short Position: Targeting lower levels near 3,282.131 or 3,284.116.
Long Position: If price holds above 3,329.040, target resistance at 3,350.163 and beyond.
Regards,
Alireza!
Gold Market Outlook – 1H ChartGold (XAU/USD) continues to show bearish momentum with lower highs and consistent structural breakdowns. Price is currently consolidating just above a key support zone (~3315), forming a descending triangle pattern — often a bearish continuation signal.
If the support breaks, the next liquidity zones lie around 3270–3250, with a deeper target near 3225, as highlighted by the green demand areas. Fundamental catalysts ahead (as shown by US economic events) could act as triggers.

XAUUSD: Buy ideaOn XAUUSD we have a very nice buy candle. Indeed, this candle reassures us of a high probability of an upward trend....
