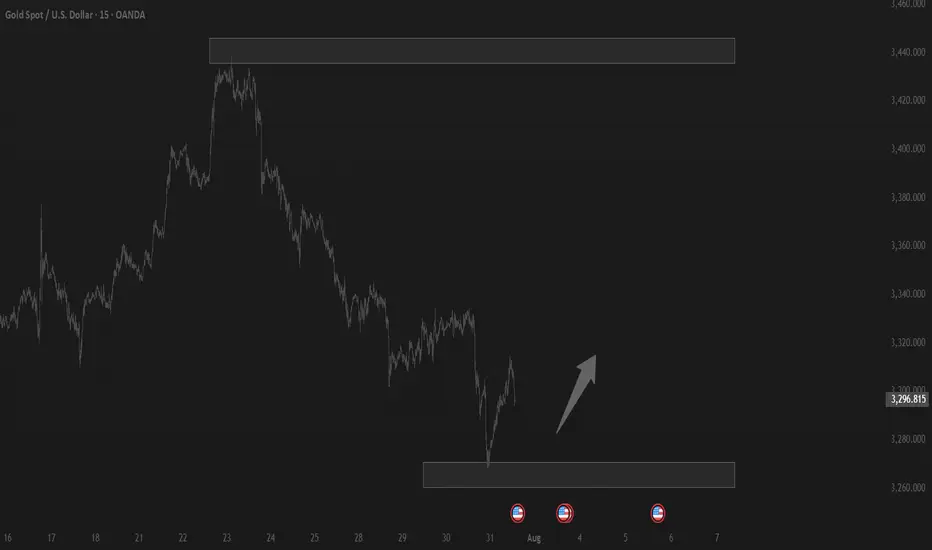
GOLD M15 OUTLOOKAccording to M15 analysis gold market going in buy from today now market running in side wave from last few Hours now wait for good opportunity market will be touch SUPPORT ZONE you can buy from there dont be greedy use money management
TRADE AT YOUR OWN RISK
REGARD ALBERT
GOLD trade ideas

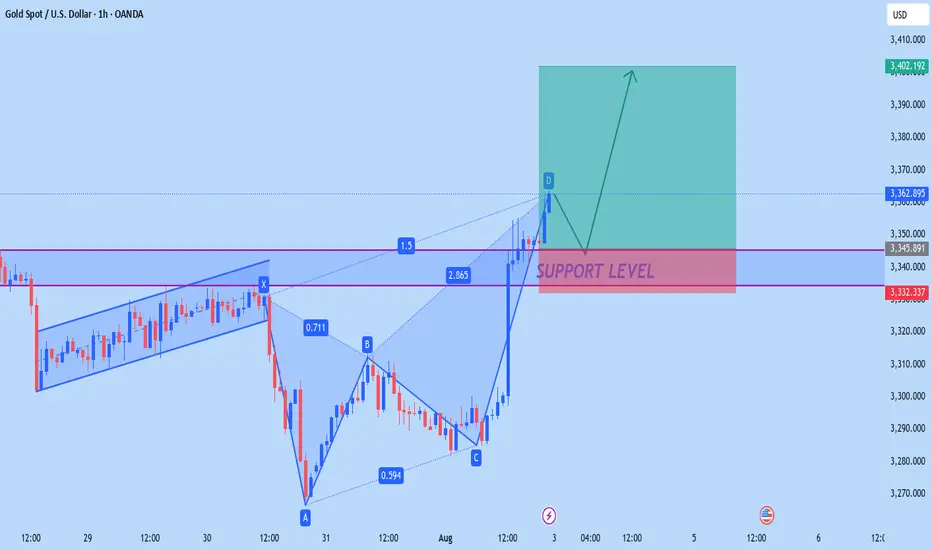
XAUUSD NEW OUTLOOKAccording to H1 analysis gold market going in buying pressure from last 2 day
now market break the resistance zone and make it RBS (RESISTANCE BECOME SUPPORT) so now market close at support level market will touch the Support zone IF you want to buy gold then you have to best chance to buy from SUPPORT level dont be greedy use money management
TRADE AT YOUR OWN RISK
Gold is rising slowly, so can we adjust our direction?
When we first entered the market, we saw slogans everywhere, such as "Investing is risky, enter with caution." However, few people actually put this into practice. In the gold market, risk control comes first, followed by investment mentality, and finally, trading methods and strategies. Only by protecting your principal can you achieve profitability; otherwise, everything is just empty talk.
A logical explanation for gold's medium-term upward trend!
Gold rebounded sharply last Friday due to the weaker-than-expected US non-farm payroll report, and the market quickly adjusted its expectations for the Federal Reserve's policy direction, shifting to a more dovish stance. Although the market reaction seemed to indicate very weak data, the overall situation was not as bad as expected. The problem is that the market had previously bet on strong data, and pricing in a more hawkish outlook following the Fed's interest rate meeting has led to even weaker data, so even slightly weaker data could trigger a rapid repricing.
Next, the market's focus will turn to key economic data and speeches by Federal Reserve officials, particularly in the run-up to the September FOMC meeting. As long as incoming data remains benign, Fed Chairman Powell is expected to open the door to a September rate cut at the Jackson Hole annual meeting. From a broader perspective, gold is expected to maintain its upward trend as real interest rates are expected to continue declining. However, a short-term correction is still possible if interest rate expectations become hawkish.
A Gold Trend Perspective!
Unfortunately, gold prices only reached a low of 3350 today before rising again. With no signs of a pullback near the US market close, our bullish dip buying opportunity at 3343 is somewhat difficult to enter. It appears that the upward trend will continue to test the key resistance level of 3380. If there are no dip buying opportunities, consider shorting!
The current hourly chart has broken through the support level, leading to a choppy morning session. The upward trend is likely to test the resistance level of 3380, while the support level of 3350 is key today. For the time being, we will use this range for range trading in the evening session. If there are any further market fluctuations, we will provide a new strategy in real time!
Gold: Short around 3380-82, defend at 3390, target at 3352-55! If it retreats back to around 3350 but does not break through, you can enter a long position!

XAUUSDXAU/USD represents the exchange rate between one troy ounce of gold (XAU) and the US dollar (USD). It shows how much in US dollars is required to purchase one ounce of gold. This pair is widely traded across forex and commodities markets and is considered a key indicator of global economic stability and investor sentiment.
Historically, gold was pegged to the US dollar under the Bretton Woods Agreement from 1944 to 1971. During this period, one ounce of gold was fixed at $35, and the US government guaranteed the convertibility of dollars into gold. In 1971, President Richard Nixon ended the gold standard, allowing gold to trade freely on global markets. This led to significant volatility in the price of gold, which began to reflect real-time market forces such as supply, demand, inflation, and geopolitical events.
In the decades that followed, gold experienced several major price movements. In 1980, gold surged to around $850 per ounce due to high inflation and geopolitical instability. It then declined and remained relatively low through the 1990s, reaching a low near $270 in 2000. Starting in the mid-2000s, gold began a strong upward trend driven by concerns about inflation, financial crises, and central bank policies, culminating in a peak near $1,920 in 2011 during the Eurozone crisis and Federal Reserve monetary easing.
In 2020, gold hit a new all-time high around $2,070 during the global uncertainty of the COVID-19 pandemic. Since then, it has continued to be influenced by economic data, interest rate decisions, inflation trends, and geopolitical developments. In 2024 and 2025, gold has remained strong, supported by central bank buying and expectations of future rate cuts. As of August 2025, the current price of gold has reached $3,363 per ounce, reflecting heightened demand and ongoing macroeconomic uncertainty.
XAU/USD is influenced by many factors, including the strength of the US dollar, inflation expectations, geopolitical risks, and investor demand for safe haven assets. When the dollar weakens or global uncertainty increases, gold typically gains value. Traders and investors often use gold to hedge against economic instability, inflation, or currency devaluation.
Today, gold remains one of the most important assets in global markets, and XAU/USD continues to be a major pair for both short-term traders and long-term investors.

XAUUSD
XAUUSD Updated in 5M :
The gold signal is marked on the chart based on the latest price changes and the supply and demand in the market. These points include the entry point, stop loss, and take profit
Gold big data is here! Gold prices are igniting the market!Market News:
Spot gold fluctuated narrowly in early Asian trading on Wednesday (July 30), currently trading around $3,325 per ounce. London gold prices recovered some of their losses on Tuesday after falling for the fourth consecutive day, as the US dollar gave up some of its earlier gains, boosting international demand for gold. Declining US Treasury yields and a weak US labor market report also prompted investors to buy gold. The gold market is currently at a critical turning point. Fundamental buying and selling factors are in fierce competition: on the one hand, easing global trade tensions are suppressing safe-haven demand; on the other hand, falling US Treasury yields and expectations of a possible Federal Reserve shift are providing support. Meanwhile, progress in US-China trade negotiations, Trump's tough stance on Russia and the Middle East, and ongoing geopolitical tensions continue to add further uncertainty to the future of the gold market. Furthermore, attention will be paid to the Bank of Japan and Bank of Canada's interest rate decisions, the US second-quarter GDP data and the July ADP employment data. Second-quarter GDP data from Germany and the Eurozone also warrant attention.
Technical Review:
Gold bottomed out and rebounded, stopping at the 3310 level before rising sharply above the 30 mark. The daily chart closed with a small positive candlestick pattern. The 10/7-day moving averages remain converging, suppressing the 57 level above. The RSI stopped below the 50-day moving average and adjusted downward, with the price trading below the middle Bollinger Band at 40. A four-hour chart golden cross formed and pointed upward. The hourly MACD momentum bar is above zero, while the RSI is flattening, indicating a neutral trend. Gold technically remains in a wide range of fluctuations. The trading strategy is to sell high and buy low. Plan to buy low at 3318/06 and sell high at 3346/58. The release of important data today will affect the original technical trend of gold and silver, increasing volatility. Be aware of market risks.
Today's Analysis:
Although gold rebounded yesterday, the momentum wasn't particularly strong, with the upward trend remaining erratic. Bullish volume remains insufficient. Today's key events will be the non-farm payroll report and the Federal Reserve's interest rate decision. Pre-market activity is unlikely to see a significant upturn, so we'll have to wait for the data to provide direction. Expect volatility before the release! The slope of gold's 1-hour rebound doesn't necessarily indicate a deep V-shaped pattern. Gold hasn't yet reversed, and a second bottom is possible. Only if gold doesn't break a new low during this second bottoming out could a double bottom form. Gold is still expected to decline in the Asian session. If gold rebounds and comes under pressure, continue selling. A deep V-shaped reversal is only possible if gold breaks through and stabilizes at the 3345 level. Until then, continue selling at high prices.
Trading strategy:
Short-term gold: Buy at 3310-3313, stop loss at 3300, target at 3340-3360;
Short-term gold: Sell at 3343-3346, stop loss at 3355, target at 3310-3300;
Key points:
First support level: 3310, Second support level: 3292, Third support level: 3284
First resistance level: 3338, Second resistance level: 3346, Third resistance level: 3358

05/08/25 Gold Swing LevelsTuesday 05/08/25 levels are marked; expecting a downtrend
Trade parameters
Entry on 5 min chart
Sl: 30-50pips
TP: 2-4x SL

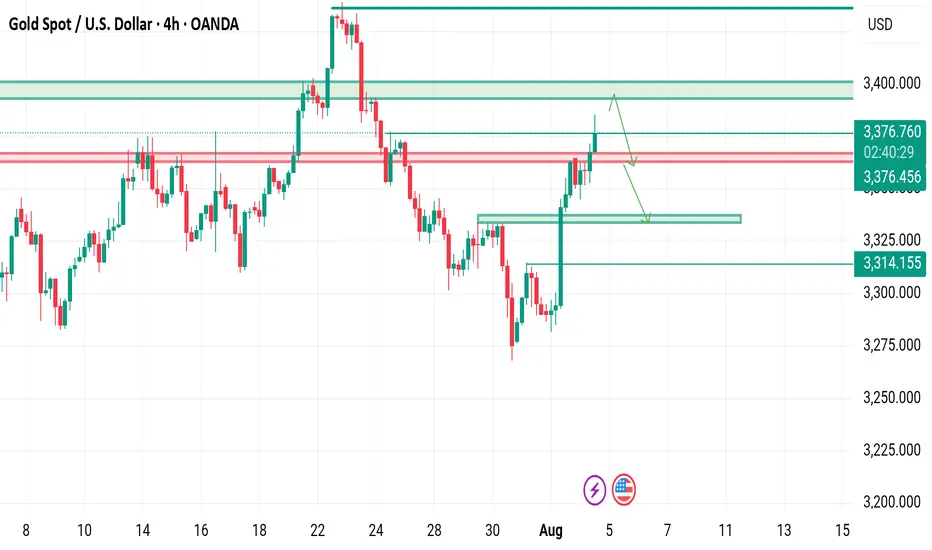
XAUUSD needs Retest H4 TIMEFRAME SETUP
We shared daily our XAUUSD for deep insights and knowledge.
Currently we have range of 3345-3380 area also we have proper CHOCH on H4 at 3335 support area As I mentioned in our previous commantary we have bullish momentum which is almost near our milestone.
What possible scenarios we have ?
• Atm i took sell from 3385 with minimal risk
Sell from 3395-3400
TARGETS 3370 then 3350 milestone.
• above 3405- 3408 our selling will be invalid and we'll took buy to ATH
Will the bull market continue? A sense of crisis.Can gold continue last week's rally? Will it be another flash in the pan? In early Asian trading on Monday, gold rose to 3370 before falling slightly to around 3345 and currently fluctuating around 3360.
On Monday, focus on the 3340-3335 area. This was support before last Friday's rebound, and it also served as a key resistance level that has now become a support point. After last week's strong performance, don't rush into buying. Wait for a pullback to confirm the trend, or for an upward breakout in the European session before considering entering the market before the US market opens. In volatile markets, try to control the pace and avoid frequent in-and-out moves.
The 4-hour chart shows that gold is currently facing resistance near 3370, but this strong upward move is likely to correct in the European session, preparing for a subsequent secondary rally. This period has been range-bound, not a strong, one-way trend. Even if bullish, don't chase the market; wait for confirmation after a pullback before taking action.
Quaid believes that support today lies in the 3340-3335 range. A pullback near this area is a good opportunity to go long. The early Asian session's surge is a continuation of last Friday's bullish trend. The 3340-3335 area served as support before Friday's final rally and a key level for top-to-bottom reversals. If the price breaks through 3370 and stabilizes above it, it could potentially reach 3375-3385. However, after reaching the high, Quaid believes a pullback is highly likely, with a focus on the 3330-3310 area.
Trading Strategy:
Go long near 3330, stop-loss at 3320, and profit range at 3360-3370.
Short near 3375, stop-loss at 3385, and profit range at 3330-3320-3310.

Gold Trading Opportunity
---
### ⚡️ **– Harmonic Setup You Don’t Want to Miss**
🚨 **"We’re standing at the edge of a golden reversal!"**
The *Gartley* and *Deep Crab* harmonic patterns have formed with stunning precision, signaling a powerful potential drop*. This level is not just a number—it’s a pressure point where a reversal pattern converges with a high-volume **supply zone**, amplified by a strong **RSI overbought signal**.
💼 With disciplined **risk management** and clearly defined **stop-loss and multi-tier targets**, we’re positioning ourselves for a calculated and confident short move.
This is not guesswork—it’s a textbook setup backed by structure, momentum, and sentiment.
🔥 Don’t chase the market. Let it come to you. This setup rewards patience and precision.
---

Gold The Week Ahead Key Support and Resistance Levels
Resistance Level 1: 3386
Resistance Level 2: 3410
Resistance Level 3: 3438
Support Level 1: 3315
Support Level 2: 3295
Support Level 3: 3268
This communication is for informational purposes only and should not be viewed as any form of recommendation as to a particular course of action or as investment advice. It is not intended as an offer or solicitation for the purchase or sale of any financial instrument or as an official confirmation of any transaction. Opinions, estimates and assumptions expressed herein are made as of the date of this communication and are subject to change without notice. This communication has been prepared based upon information, including market prices, data and other information, believed to be reliable; however, Trade Nation does not warrant its completeness or accuracy. All market prices and market data contained in or attached to this communication are indicative and subject to change without notice.

POSSIBLE BEARISH CONTINUATION ON GOLDBased on price action, Gold presents a very bearish sentiment from the daily point of view.
The indicated supply region may be the area of interest for the build up of the sells if indeed Gold is bound for the monthly lows.
Confirmation is needed for an entry.
Trading balanceTrading balance The price of the asset has rebounded from the balance zone. With the prospect of growth into the resistance zone.
Xausd techinical analysis.Xausd techinical analysis next move posibale at h1 time frame not finchinical advice.

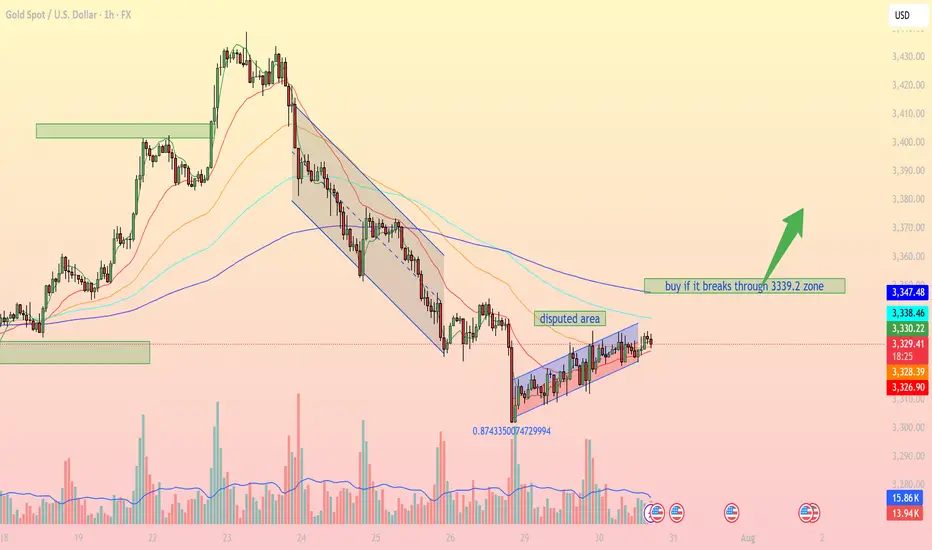
Accumulation pattern awaiting breakout confirmationIntraday Outlook: Accumulation pattern awaiting breakout confirmation
On the 1H timeframe, XAUUSD is forming a clear consolidation pattern within a narrow ascending channel after falling from a prior distribution zone. Buyers are attempting to regain control, but strong resistance remains around the 3,339 – 3,347 USD area.
1. Technical Breakdown:
Trendline & Channel: Price is currently moving inside a small rising channel, indicating a short-term bullish bias, though momentum remains limited.
EMA Dynamics: EMA 20, 50, and 100 are beginning to converge, signaling a potential breakout. A bullish EMA crossover (EMA20 > EMA50) could confirm stronger upward momentum.
Disputed Area: This zone represents heavy indecision between bulls and bears. A clear breakout above or below is needed for directional clarity.
Fibonacci Level: The 0.874 retracement level from the recent low shows strong buyer interest, potentially forming a short-term bottom.
2. Key Support & Resistance Levels:
3,339.2 USD Major resistance – needs to be broken for bullish continuation
3,347.4 USD Next resistance if breakout occurs
3,328.2 USD Immediate support (current price zone)
3,326.7 USD Strong support if price retraces
3. Suggested Trading Strategies:
Scenario 1 – Breakout Buy Strategy:
Entry: Buy if price breaks and closes above 3,339.2 USD on the 1H chart.
Stop Loss: Below 3,328 USD.
Take Profit: First target at 3,347, extended targets at 3,358 and 3,372 USD.
Scenario 2 – Pullback Long Entry:
If price fails to break resistance, consider buying the dip near the 3,326 – 3,328 USD support zone for a better risk-reward setup.
Scenario 3 – Breakdown Sell Setup:
If price breaks below 3,326 USD and exits the channel, a bearish move towards 3,295 – 3,300 USD becomes likely.
Gold is in a key consolidation phase, with the 3,339 USD resistance acting as the decisive breakout zone. Traders should closely monitor price action, volume, and EMA behavior to catch the next directional move.
Follow for more trading strategies like this. Save this post if you find it useful!
July 30, 2025 - XAUUSD GOLD Analysis and Potential Opportunity🔍 Key Levels to Watch:
• 3384 – Resistance
• 3375 – Key resistance
• 3365 – Resistance
• 3345 – Resistance
• 3336 – Resistance
• 3325 – Key support
• 3310 – Support
• 3300 – Psychological level
• 3283 – Major support
• 3275 – Support
• 3265 – Support
📈 Intraday Strategy:
• SELL if price breaks below 3325 → target 3320, then 3315, 3310, 3300
• BUY if price holds above 3330 → target 3336, then 3345, 3350, 3356
👉 If you find this helpful or traded using this plan, a like would mean a lot and keep me motivated. Thanks for the support!
Disclaimer: This is my personal view, not financial advice. Always use proper risk control.

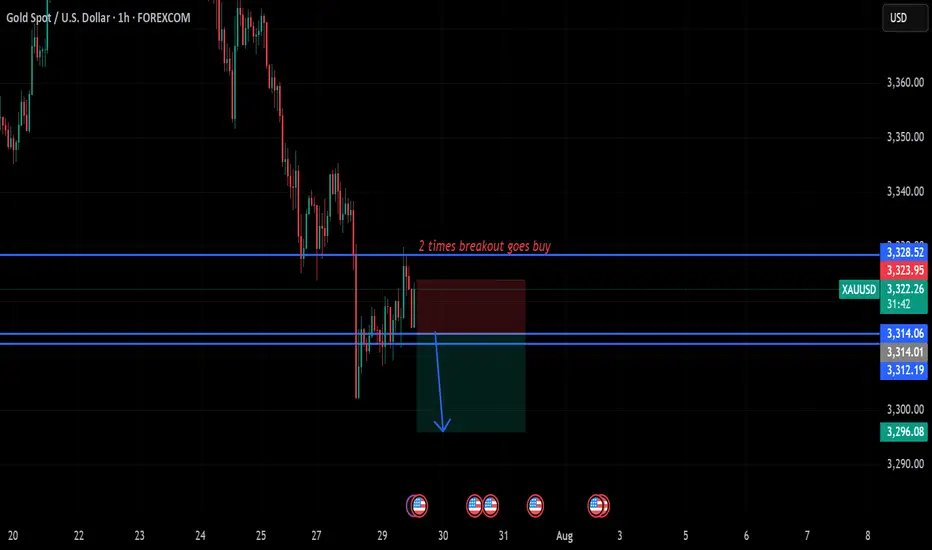
gold on sideways#XAUUSD price await double breakout above 3328.6 for bullish to take place. But now we await for any breakout to take trade.
Below 3314 holds sell continuation, target 3296, stop loss 3324.
Above 3328.6 on 2 times breakout will start bullish till 3340.
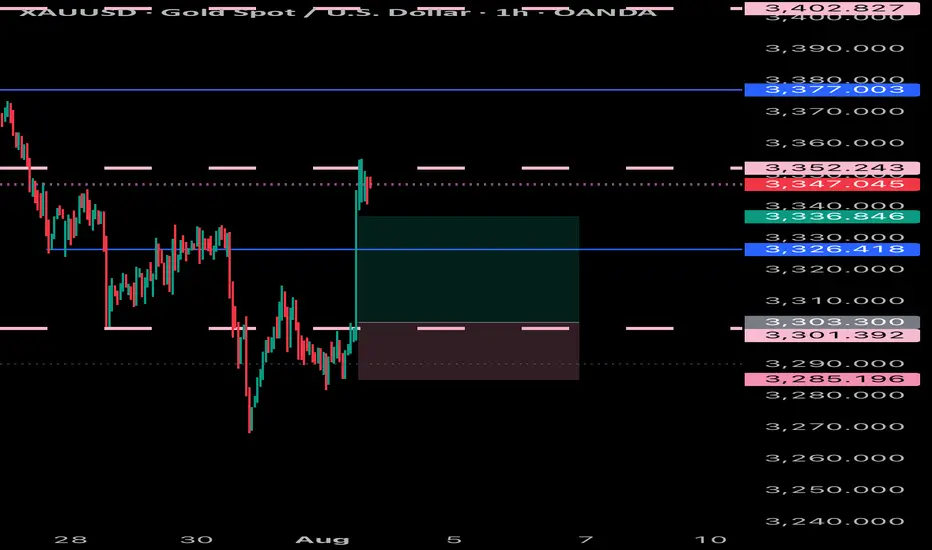
August 4, 2025 - XAUUSD GOLD Analysis and Potential OpportunitySummary:
Gold is currently in a sideways-to-bullish structure. Strong resistance remains around 3440–3450; if this level fails to break, it offers a high-probability shorting opportunity. Near-term focus is on the 3350 support level — if it breaks, bearish momentum may pick up and selling the pullback becomes ideal. If 3350 holds, consider buying the dip and targeting a test of 3375. Stay flexible and responsive to price action at key levels. Manage risk accordingly.
📍 Key Levels to Watch:
• 3400 – Resistance
• 3384 – Resistance
• 3375 – Key resistance
• 3365 – Resistance
• 3350 – Psychological level
• 3345 – Support
• 3334 – Key support
• 3323 – Support
• 3310 – Support
📈 Intraday Strategy
SELL if price breaks below 3350 → target 3340, then 3334, 3323, 3315
BUY if price holds above 3365 → target 3370, then 3375, 3384, 3394
👉 If you find this helpful or traded using this plan, a like would mean a lot and keep me motivated. Thanks for the support!
Disclaimer: This is my personal view, not financial advice. Always use proper risk control.

SUPER BUY GOLD XAUUSD Gold has ripped all levels of take profit and has gone up and gave us a small amount of drawdown with huge gains in return, simple trading price action and (M&Ws)
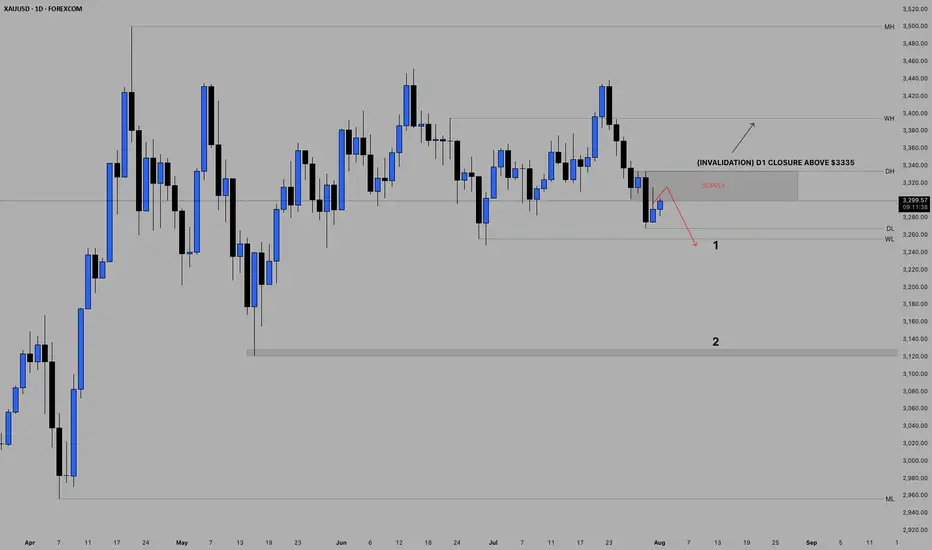
Is the gold correction over?✏️Yesterday's D1 candle closed above the Breakout 3363 zone. This shows that the buyers in the US session are still strong. There is a possibility of a liquidity sweep in the Tokyo and London sessions, then in the New York session, Gold will recover and increase again. The uptrend is really broken when Gold confirms a close below 3345. In this case, we have to wait for 3320 to confirm the BUY point. The gold uptrend at this time also needs new momentum to be able to move towards ATH 3500.
📉 Key Levels
Support: 3345-3320
Resistance: 3373-3418
Buy zone: 3345 (bullish wave structure maintained); BUY DCA break 3373
Buy zone: 3320 (Strong support zone)
Target: 3417
Leave your comments on the idea. I am happy to read your views.

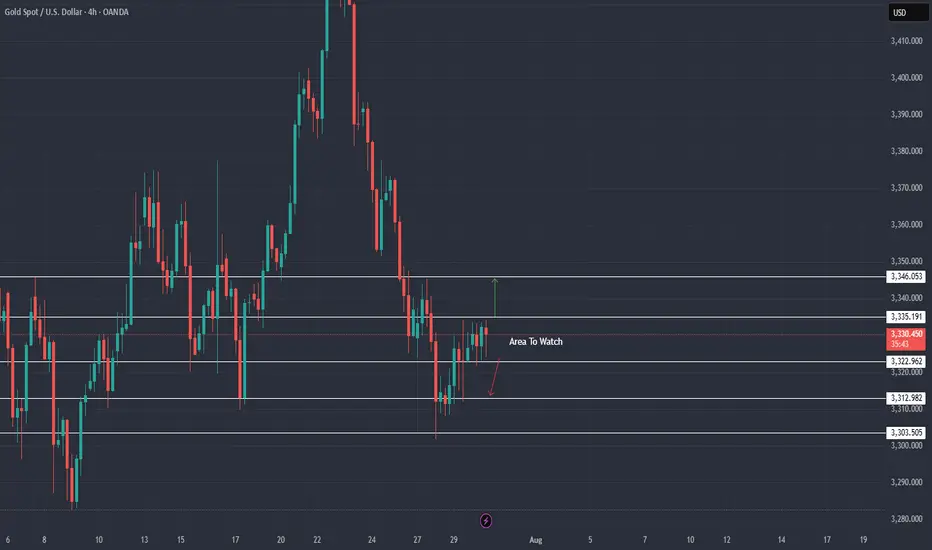
XAU / USD 4 Hour ChartHello traders. We have news thins morning, we have Trump and Powell this afternoon. I am not trading the news, but I did mark the area we need to break out of. I can see this going either way. I will check back later. Be well and trade the trend. Beware the volatility and trade safely today. Big G gets a shout out.
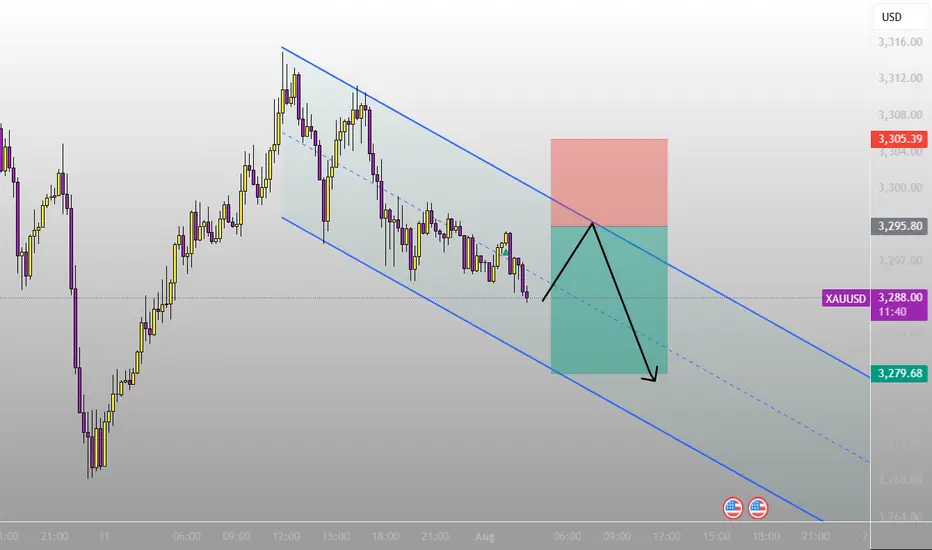
XAUUSD analysis - 1H FVG and OB setupsOn the 1H timeframe, price is currently approaching two key supply zones (OB 1H):
🔴 First OB zone: around 3354 – 3360
🔴 Second OB zone: around 3368 – 3370
We're watching these zones for potential short setups, only with confirmation on the lower timeframes (5M or 3M).
If price reacts to one of these OBs, we expect a move down toward the green 1H demand zone around 3280 – 3290, where a long setup may later form.
📌 Key scenarios:
1️⃣ Price hits the first OB → confirmation → short
2️⃣ Price moves to the second OB → confirmation → short
3️⃣ Target for both setups = green OB around 3280
4️⃣ No entry without confirmation from LTF
❗️ Do NOT enter without lower timeframe confirmation.

GOLD - One n Single Area, what's next??#GOLD... market just reached at his ultimate area as we discussed in our last week analysis and in Friday analysis as well.
The area is 3309-10
Keep close and don't be lazy here.
NOTE: we will go for cut n reverse below 3309 in confirmation.
Good luck
Trade wisley
