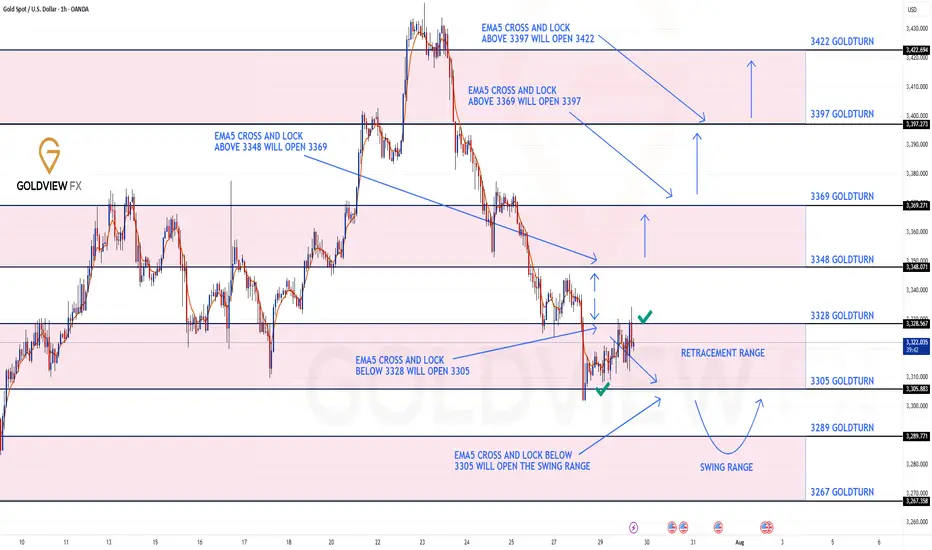
GOLD ROUTE MAP UPDATEHey Everyone,
Quick follow up on our 1H chart route map:
What can I say.....pure perfection on our chart analysis as everything played out exactly as expected.
Yesterday, we identified the first level of the swing range at 3289, which delivered a clean full swing into 3305.
Today, we hit Level 2 of the swing range at 3267, and once again, it played out flawlessly with another full swing up to 3305.
A perfect finish to the day. Great work all around!
We are now looking for support above the swing range and a break above 3305 to track the movement up or further retest and break below the 1st level of the swing range may open the the 2nd level at 3267 again.
We will keep the above in mind when taking buys from dips. Our updated levels and weighted levels will allow us to track the movement down and then catch bounces up.
We will continue to buy dips using our support levels taking 20 to 40 pips. As stated before each of our level structures give 20 to 40 pip bounces, which is enough for a nice entry and exit. If you back test the levels we shared every week for the past 24 months, you can see how effectively they were used to trade with or against short/mid term swings and trends.
The swing range give bigger bounces then our weighted levels that's the difference between weighted levels and swing ranges.
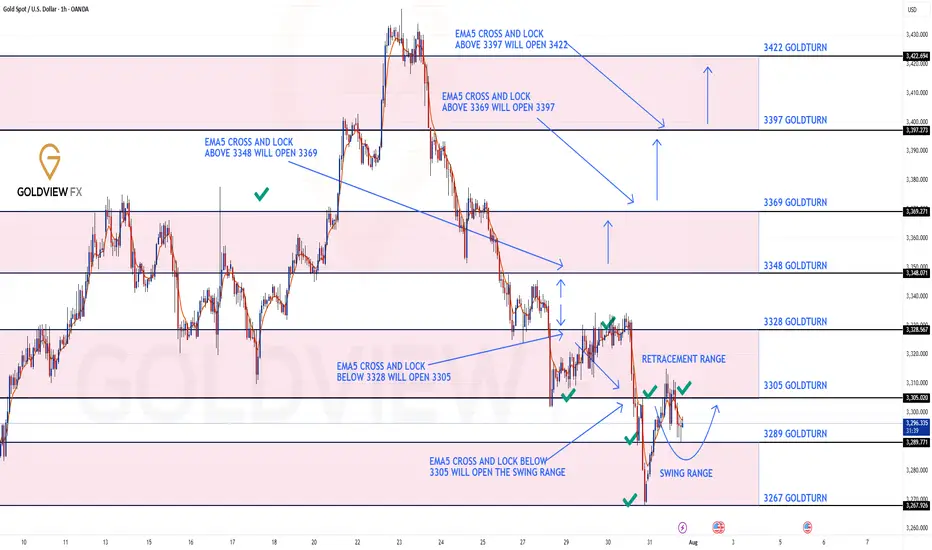
BULLISH TARGET
3348
EMA5 CROSS AND LOCK ABOVE 3348 WILL OPEN THE FOLLOWING BULLISH TARGETS
3369
EMA5 CROSS AND LOCK ABOVE 3369 WILL OPEN THE FOLLOWING BULLISH TARGET
3397
EMA5 CROSS AND LOCK ABOVE 3397 WILL OPEN THE FOLLOWING BULLISH TARGET
3422
BEARISH TARGETS
3328 - DONE
EMA5 CROSS AND LOCK BELOW 3328 WILL OPEN THE FOLLOWING BEARISH TARGET
3305 - DONE
EMA5 CROSS AND LOCK BELOW 3305 WILL OPEN THE SWING RANGE
3289 - DONE
3267 - DONE
As always, we will keep you all updated with regular updates throughout the week and how we manage the active ideas and setups. Thank you all for your likes, comments and follows, we really appreciate it!
Mr Gold
GoldViewFX
GOLD trade ideas
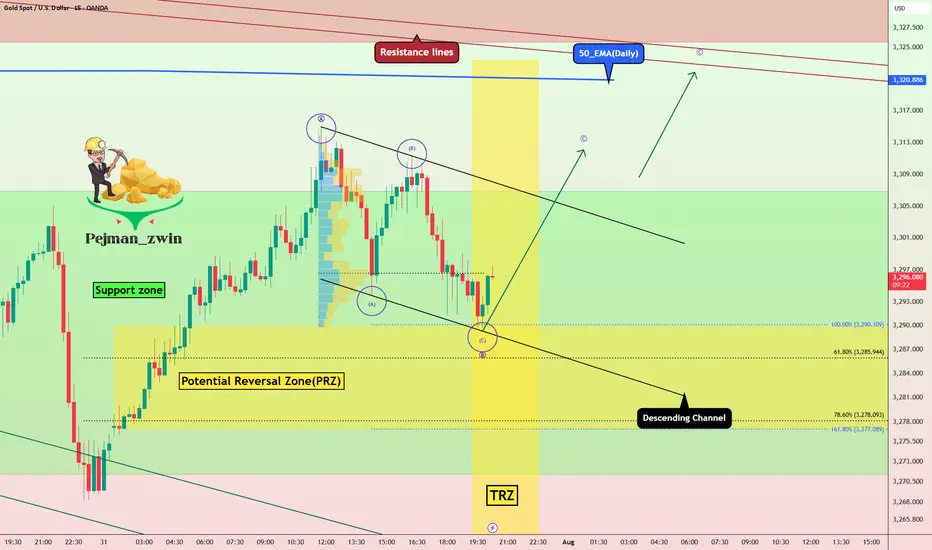
Gold in PRZ + TRZ: Is a Bullish Reversal Brewing(Short-term)?Gold , as I expected in yesterday's idea , fell to the Potential Reversal Zone(PRZ) and started to rise again .
Today's Gold analysis is on the 15-minute time frame and is considered short-term , so please pay attention .
Gold is currently trading in the Support zone($3,307-$3,275) and near the Potential Reversal Zone(PRZ) and Time Reversal Zone(TRZ) .
In terms of Elliott Wave theory , it seems that Gold can complete the microwave C of wave B at the lower line of the descending channel.
I expect Gold to trend higher in the coming hours and rise to at least $3,311 .
Note: Stop Loss (SL) = $3,267
Gold Analyze (XAUUSD), 15-minute time frame.
Be sure to follow the updated ideas.
Do not forget to put a Stop loss for your positions (For every position you want to open).
Please follow your strategy; this is just my idea, and I will gladly see your ideas in this post.
Please do not forget the ✅ ' like ' ✅ button 🙏😊 & Share it with your friends; thanks, and Trade safe.
Gold Potential UpsidesHey Traders, in today's trading session we are monitoring XAUUSD for a buying opportunity around 3,270 zone, Gold is trading in an uptrend and currently is in a correction phase in which it is approaching the trend at 3,270 support and resistance area.
Trade safe, Joe.
GOLD ROUTE MAP UPDATEHey Everyone,
Following yesterday’s move into the 3305 retracement range, we got the expected reaction without an EMA5 lock, which further confirmed the rejection from that level and led to a clean bounce into 3228 just like we analysed.
From here, we anticipate price to range between 3328 and 3305. EMA5 cross and lock above 3328 or below 3305 will be key to confirming the next directional move.
We’ll continue to monitor for that confirmation and adjust accordingly.
We will keep the above in mind when taking buys from dips. Our updated levels and weighted levels will allow us to track the movement down and then catch bounces up.
We will continue to buy dips using our support levels taking 20 to 40 pips. As stated before each of our level structures give 20 to 40 pip bounces, which is enough for a nice entry and exit. If you back test the levels we shared every week for the past 24 months, you can see how effectively they were used to trade with or against short/mid term swings and trends.
The swing range give bigger bounces then our weighted levels that's the difference between weighted levels and swing ranges.
BULLISH TARGET
3348
EMA5 CROSS AND LOCK ABOVE 3348 WILL OPEN THE FOLLOWING BULLISH TARGETS
3369
EMA5 CROSS AND LOCK ABOVE 3369 WILL OPEN THE FOLLOWING BULLISH TARGET
3397
EMA5 CROSS AND LOCK ABOVE 3397 WILL OPEN THE FOLLOWING BULLISH TARGET
3422
BEARISH TARGETS
3328 - DONE
EMA5 CROSS AND LOCK BELOW 3328 WILL OPEN THE FOLLOWING BEARISH TARGET
3305 - DONE
EMA5 CROSS AND LOCK BELOW 3305 WILL OPEN THE SWING RANGE
3289
3267
As always, we will keep you all updated with regular updates throughout the week and how we manage the active ideas and setups. Thank you all for your likes, comments and follows, we really appreciate it!
Mr Gold
GoldViewFX
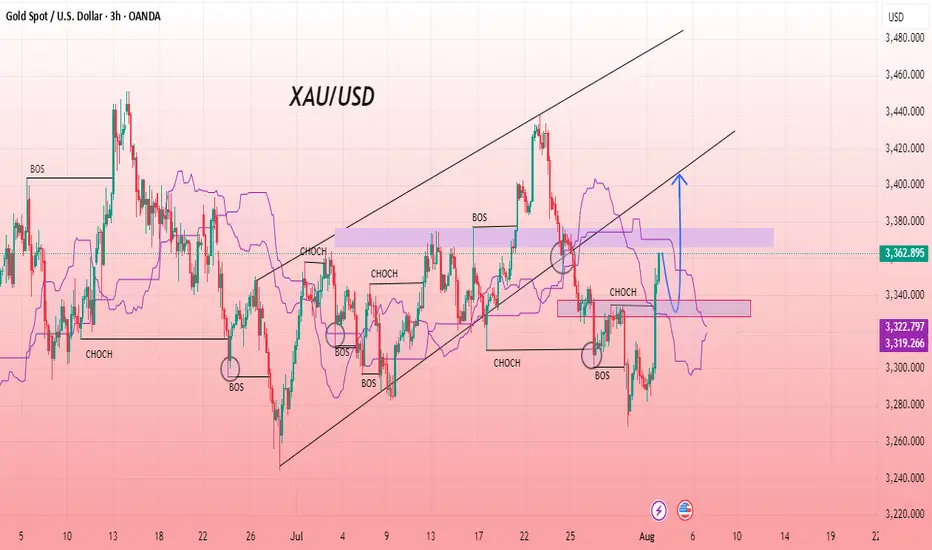
XAU/USD Bullish Setup Building MomentumGold has reclaimed bullish momentum after a strong bounce from the recent demand zone around 3319–3322. The chart shows a clear Change of Character (CHOCH) and subsequent Break of Structure (BOS), suggesting buyers are regaining control. Price is now trading above the Ichimoku cloud, further confirming bullish pressure. The upward arrow highlights the potential path toward the next key resistance area near 3380–3400. As long as price sustains above the previous structural break and the cloud base, continuation toward the upside remains likely. Market structure favours buying opportunities on dips, with bulls targeting a higher move in the short term.
Entry Buy: 3334
Target Point: 3404
If you found this analysis helpful, don’t forget to drop a like and comment . Your support keeps quality ideas flowing—let’s grow and win together! 💪
GOLD 4H CHART ROUTE MAP UPDATE & TRADING PLAN FOR THE WEEKHey Everyone,
Please see our updated 4h chart levels and targets for the coming week.
We are seeing price play between two weighted levels with a gap above at 3371 and a gap below at 3293. We will need to see ema5 cross and lock on either weighted level to determine the next range.
We will see levels tested side by side until one of the weighted levels break and lock to confirm direction for the next range.
We will keep the above in mind when taking buys from dips. Our updated levels and weighted levels will allow us to track the movement down and then catch bounces up.
We will continue to buy dips using our support levels taking 20 to 40 pips. As stated before each of our level structures give 20 to 40 pip bounces, which is enough for a nice entry and exit. If you back test the levels we shared every week for the past 24 months, you can see how effectively they were used to trade with or against short/mid term swings and trends.
The swing range give bigger bounces then our weighted levels that's the difference between weighted levels and swing ranges.
BULLISH TARGET
3371
EMA5 CROSS AND LOCK ABOVE 3371 WILL OPEN THE FOLLOWING BULLISH TARGETS
3424
EMA5 CROSS AND LOCK ABOVE 3424 WILL OPEN THE FOLLOWING BULLISH TARGET
3499
EMA5 CROSS AND LOCK ABOVE 3499 WILL OPEN THE FOLLOWING BULLISH TARGET
3561
BEARISH TARGETS
3293
EMA5 CROSS AND LOCK BELOW 3293 WILL OPEN THE SWING RANGE
3236
3171
EMA5 CROSS AND LOCK BELOW 3171 WILL OPEN THE SECONDARY SWING RANGE
3089
3001
As always, we will keep you all updated with regular updates throughout the week and how we manage the active ideas and setups. Thank you all for your likes, comments and follows, we really appreciate it!
Mr Gold
GoldViewFX

XAUUSD Update – Down Continuation to 3250?1. What Happened Yesterday
After an anemic correction that formed a bearish flag, Gold finally broke below 3300 and even dipped under the 3280 support zone — which was my primary downside target. While the move during the day didn’t have enough momentum to reach my second sell limit, I was already in a low-volume short position, so I didn’t miss the move entirely.
2. The Key Question
Has the drop ended, or are we looking at further downside?
3. Why I Expect More Downside
• The overall structure remains bearish.
• The newly formed resistance (previous support) is now the new sell zone.
• If the price drops towards 3280 again, continuation to 3250 becomes very probable.
4. Trading Plan
Selling rallies remains the preferred strategy, especially on spikes into resistance. As long as the price stays below 3335-3340 zone, the bearish outlook remains intact.
5. Conclusion
Sell the rallies. The technical picture still favors downside continuation — no need to overcomplicate it. 🚀
Disclosure: I am part of TradeNation's Influencer program and receive a monthly fee for using their TradingView charts in my analyses and educational articles.
Mechanical vs. Anticipation Trades: The Fine LineWhen traders talk about discipline, they often refer to following rules — sticking to a plan, being methodical, and avoiding emotional decisions. But there's a subtle and powerful difference between being rule-based and being blindly mechanical. And even more, there's a moment in every trader’s process where discipline demands adaptation.
Let’s look at a recent trade on Gold to understand this better.
On Thursday, I published an analysis on Gold stating that the recent breakdown of support had turned that zone into resistance. A short entry from that level made sense.
It was mechanical, clean, and aligned with what the chart was showing at the time.
And, at first, it worked. Price rose into the resistance area and dropped. Perfect reaction. Textbook setup. Confirmation. The kind of trade you want to see when following a rule-based system.
But then something changed.
Price came back. Quickly.(I'm talking about initial 3315-3293 drop and the quick recover)
So, the very next rally pushed straight back into the same resistance area, hmmm...too simple, is the market giving us a second chance to sell?
That was the first sign that the market might not respect the previous structure anymore.
It dipped again after, but the second drop was different: slower, weaker, choppier.
That told me one thing: the selling pressure was fading.
So I shifted. From mechanical execution to anticipatory mindset.
This is where many traders struggle — not because they don’t have a system, but because they don’t know when to let go of it. Or worse: they abandon it too quickly without cause.
In this case, the evidence was building. The failed follow-through. The loss of momentum. The compression in structure. All signs that a reversal was brewing.
Rather than continuing to blindly short, referring to a zone that no longer held the same weight, I started looking for the opposite: an upside breakout and momentum acceleration.
That transition wasn’t based on emotion. It was based on market behavior.
________________________________________
Mechanical vs. Anticipation: What’s the Real Difference?
A mechanical trade is rule-based:
• If X happens, and Y confirms, then enter.
• No need for interpretation, no second guessing.
• It can (in theory) be automated.
An anticipatory trade is different:
• It’s about reading intent in price action before confirmation.
• Higher risk usually, but higher reward if you’re right.
• Can’t be automated. It requires presence, experience, and context.
And the tricky part? Often, we lie to ourselves. We say we’re "mechanical" while actually guessing. Or we think we’re being smart and intuitive, when in fact, we’re being impulsive.
The key is awareness.
In my Gold ideas, the initial short was mechanical. But the invalidation came quickly — and I was alert enough to switch gears. That shift is not a betrayal of discipline. It’s an upgrade of it.
________________________________________
Final Thoughts:
Discipline is not doing the same thing no matter what. Discipline is doing what the market requires you to do, without emotional distortion.
And that, often, means walking the fine line between the setup you planned for, and the reality that just showed up.
Disclosure: I am part of TradeNation's Influencer program and receive a monthly fee for using their TradingView charts in my analyses and educational articles.

GOLD DAILY CHART ROUTE MAPHey Everyone,
Daily Chart Update – Another Clean Rejection: Structure Still Dominates
Following up on the recent price action last week after hitting the 3433 resistance level, we got exactly what the chart warned us about.
There was no confirmed break above 3433, which led to a clean rejection right back into 3272. Interestingly, the move aligned perfectly with the channel half-line, giving us another bounce right off that zone.
We remain in the same structured range, with price still rotating between 3262 and 3433, a 170+ pip zone that continues to deliver high probability trade setups.
Here’s where we are now:
🔹 Range Still Active
Price is respecting the 3272–3433 boundaries with precision. Until we get a decisive break and hold outside this range, range bound strategies remain in play.
🔹 No Breakout = Clean Rejection
The failure to sustain above 3433 confirms resistance is still valid. We're watching EMA5 for potential breakout confirmation, until then, the bias stays neutral within the range.
🔹 Channel Half-line Bounce
That rejection into 3272 also matched the channel half-line and the bounce there further cements this area as critical support.
Updated Key Levels
📉 Support – 3272
Still the major pivot. Buy zones remain valid here unless we see a confirmed breakdown.
📈 Resistance – 3433
Now clearly tested and rejected again. Any clean break and hold above could change the dynamic, but until then, it's solid resistance.
Thanks as always for your support.
Mr Gold
GoldViewFX

THE KOG REPORT - UpdateEnd of FOMC Update:
Thank you.
RED BOX TARGETS:
Break above 3335 for 3338, 3340, 3345, 3347 and 3357 in extension of the move
Break below 3320 for 3310✅, 3306✅, 3302✅, 3297✅ and 3393✅ in extension of the move
Please do support us by hitting the like button, leaving a comment, and giving us a follow. We’ve been doing this for a long time now providing traders with in-depth free analysis on Gold, so your likes and comments are very much appreciated.
As always, trade safe.
KOG
Gold Eyes QML Resistance: Ready for a PullbackHelloooo!
Gold, after gapping up strongly, has now entered the green QML (Quasimodo Level) supply zone at roughly 3,380–3,390. This zone has acted as resistance before, so a reaction here makes perfect sense.
What I see:
Engulfed Level (3,315.66): Earlier support that got taken out. This is our logical pullback target once the QML zone does its job.
Hurricane Move: The big up-spike looks exhausted now that it’s hit the QML.
Bearish Reversal Odds: if sellers step in around current levels, expect a drop back toward 3,315.
Plan: Watch for bearish candles or a failed rally inside the 3,380–3,390 area. If we see clear rejection, target a swift move down to 3,315, with a further slide possible to the 3,260 demand zone if momentum holds.

GOLD ROUTE MAP UPDATEHey Everyone,
Great start to the week with our chart idea playing out, as analysed.
We got our Bullish target 3370 hit and now waiting for ema5 lock to confirm gap to 3392. Failure to lock will see lower Goldturns tested for suport and bounce, inline with our plans to buy dips.
We will keep the above in mind when taking buys from dips. Our updated levels and weighted levels will allow us to track the movement down and then catch bounces up.
We will continue to buy dips using our support levels taking 20 to 40 pips. As stated before each of our level structures give 20 to 40 pip bounces, which is enough for a nice entry and exit. If you back test the levels we shared every week for the past 24 months, you can see how effectively they were used to trade with or against short/mid term swings and trends.
The swing range give bigger bounces then our weighted levels that's the difference between weighted levels and swing ranges.
BULLISH TARGET
3370 - DONE
EMA5 CROSS AND LOCK ABOVE 3370 WILL OPEN THE FOLLOWING BULLISH TARGETS
3392
EMA5 CROSS AND LOCK ABOVE 3392 WILL OPEN THE FOLLOWING BULLISH TARGET
3416
EMA5 CROSS AND LOCK ABOVE 3416 WILL OPEN THE FOLLOWING BULLISH TARGET
3429
EMA5 CROSS AND LOCK ABOVE 3429 WILL OPEN THE FOLLOWING BULLISH TARGET
3439
BEARISH TARGETS
3348
EMA5 CROSS AND LOCK BELOW 3348 WILL OPEN THE FOLLOWING BEARISH TARGET
3328
EMA5 CROSS AND LOCK BELOW 3328 WILL OPEN THE FOLLOWING BEARISH TARGET
3313
EMA5 CROSS AND LOCK BELOW 3313 WILL OPEN THE SWING RANGE
3296
3281
As always, we will keep you all updated with regular updates throughout the week and how we manage the active ideas and setups. Thank you all for your likes, comments and follows, we really appreciate it!
Mr Gold
GoldViewFX

GOLD WEEKLY CHART MID/LONG TERM ROUTE MAPHey Everyone,
Weekly Chart Update – Another Clean Rejection + Bounce: Range Still in Play
Just a quick follow up on the ongoing weekly structure. We continue to see incredible respect for levels, with price action playing out exactly as mapped.
After the initial rejection at 3387, we got another test of support at 3281, and once again, the level held perfectly, delivering a clean rejection and bounce. Price is now rotating back upward, currently heading toward 3387, which remains the upside magnet and still open for a retest.
We remain firmly inside the 3281–3387 range, and as long as neither boundary breaks with confirmation, the structure remains our dominant guide.
Updated Structural Notes:
🔹 3281 Rejected Again
Support doing its job to the pip. This latest bounce further reinforces the strength of this level within the weekly channel.
🔹 Back Toward 3387
With 3281 holding once more, price is now tracking toward the 3387 resistance zone, which remains the key level to break for further upside continuation.
🔹 Channel Structure Unchanged
No breakdown below support, no confirmed breakout above resistance. The rising channel remains fully respected, and EMA5 still leans constructive.
Updated Levels to Watch:
📉 Support – 3281
Key weekly pivot tested and held again. Continues to offer solid dip buy opportunities unless decisively broken.
📈 Resistance – 3387
Still our major resistance. It’s been tested and rejected, but remains open for another challenge.
📈 Resistance 2 – 3482
Unfilled gap and broader weekly target. Only comes into focus if we get a proper breakout and hold above 3387.
Plan:
We stay range focused between 3281 and 3387 until proven otherwise. No breakout = no change. Watch for signs of momentum as we approach the top again a confirmed close above could shift the game toward 3482. Until then, structure is king.
Appreciate all the continued support.
Mr Gold
GoldViewFX

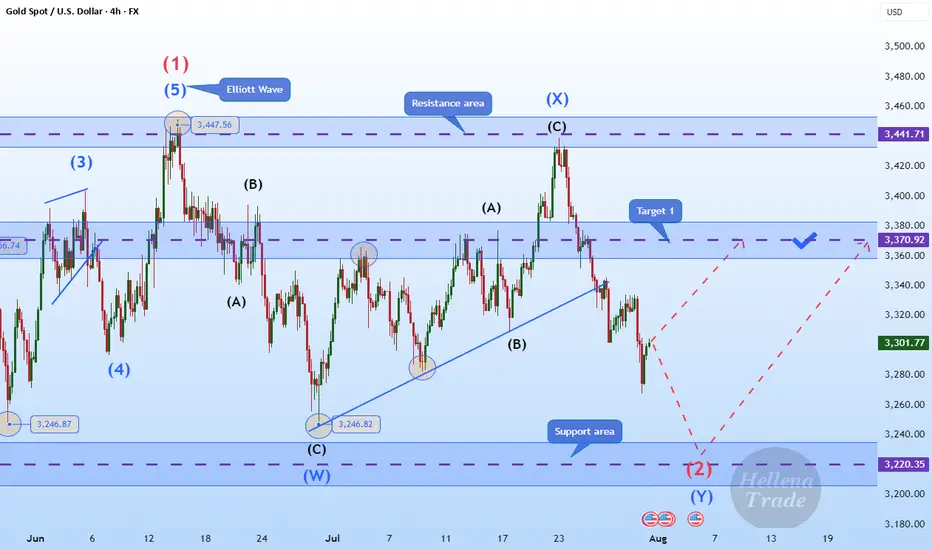
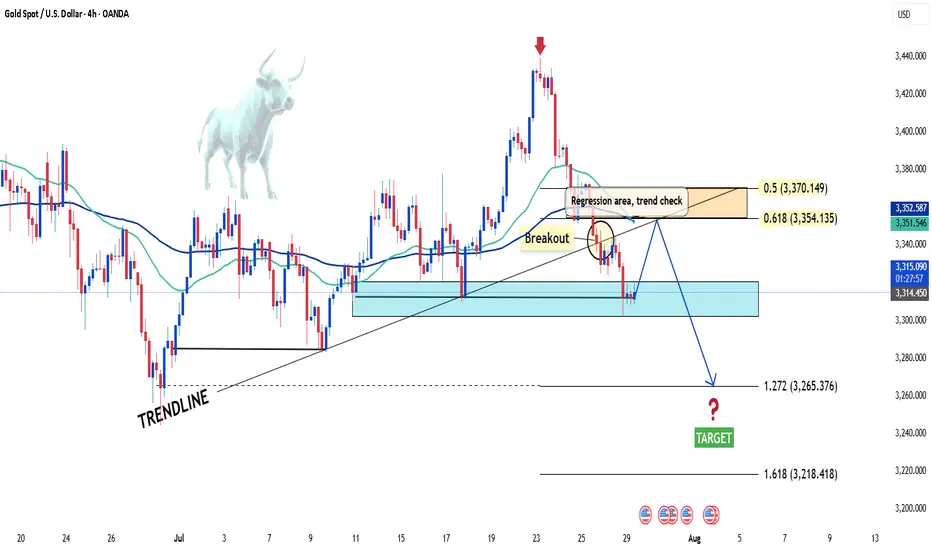
Hellena | GOLD (4H): LONG to area of 3370 (Wave 2).Colleagues, gold is once again disrupting our plans, and I have to revise the wave marking. It's not easy, but the most important thing is to keep doing it.
Now I'm back to the previous marking — the price is in wave “2” correction.
To complete this wave, the price needs to overcome the level of wave “W” of the middle order 3246.82. Then the correction will be completed and wave “3” will begin an upward movement.
I see the minimum target in the area of the 3370 level.
Manage your capital correctly and competently! Only enter trades based on reliable patterns!
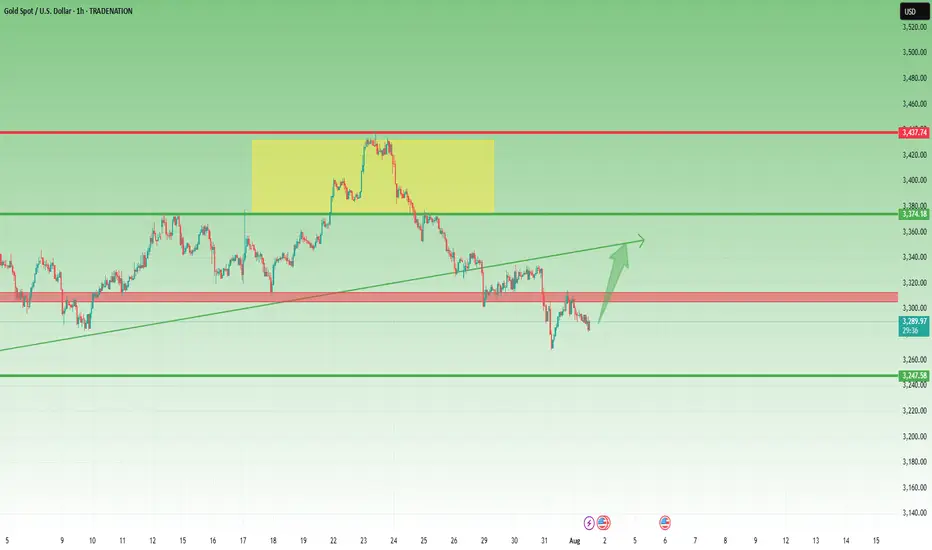
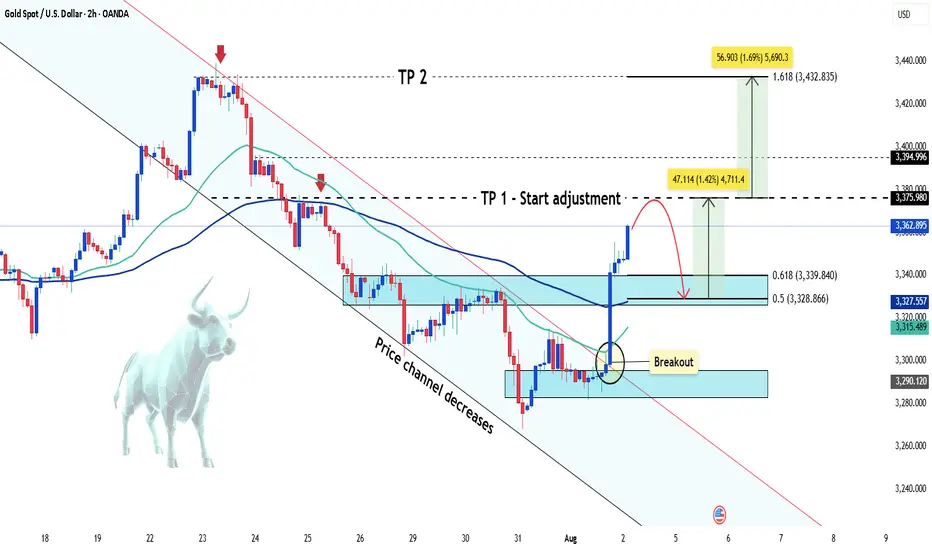
Gold Rejected at 3315 – But Bulls Might Not Be Done Yet📌 What happened yesterday?
During the Asian session, Gold printed a fresh local low at 3268, continuing the downtrend that already dropped over 1700 pips in just one week. However, that move quickly reversed, and we saw a natural corrective bounce.
📈 Resistance holds firm
The correction took price back up into the 3310 zone, which acted as confluence resistance. After two taps into that area, price failed to sustain above 3300, indicating sellers are still active there.
❓ Is the upside correction over?
I don't think so. The recent drop has been choppy, lacking the strong momentum of previous legs. This type of price action often signals that we are still within a correction, not in a clean continuation.
📊 What am I watching?
I’m actively monitoring for:
• Exhaustion signs on the downside
• Upside reversal signals
My plan is to open long trades only when I see confirmation, aiming for a move back toward the 3330 zone, which could act as resistance.
Disclosure: I am part of TradeNation's Influencer program and receive a monthly fee for using their TradingView charts in my analyses and educational articles.
Gold Breakdown Hints at Continued Bearish MomentumThe XAUUSD chart on the 4-hour timeframe reflects a bearish sentiment, as the price has broken below a key trendline and is now trading under the Ichimoku cloud. Multiple rejections from the same resistance area suggest strong selling pressure. The structure shows a consistent pattern of lower highs, indicating weakening bullish momentum. After breaking key support, the price made a retest of the broken zone and failed to reclaim it, confirming bearish continuation. The highlighted resistance area has proven to be a significant supply zone. As long as the price stays below this zone, the bearish outlook remains intact, and a downward move is likely in the coming sessions.
Entry Sell: 3342
Target point: 3248
Stop Loss : 3362
If you found this analysis helpful, don’t forget to drop a like and comment . Your support keeps quality ideas flowing—let’s grow and win together! 💪📈

GOLD: Multi-Timeframe Analysis Ahead of FOMCGOLD: Multi-Timeframe Analysis Ahead of FOMC
Gold prices may experience a short-term surge leading up to the FOMC announcement.
But what comes next?
Let’s break down the analysis, step by step.
For deeper insights, watch the full breakdown in the video.
Thank you!

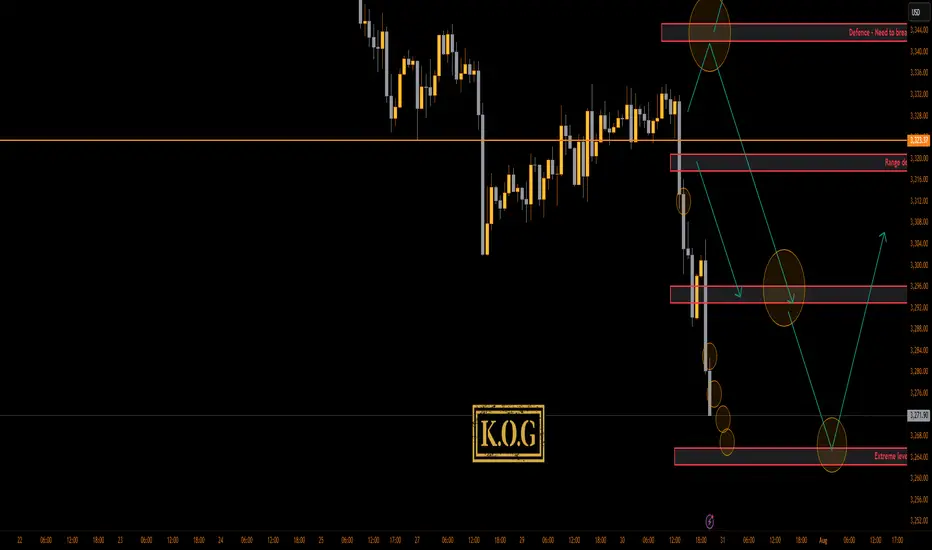
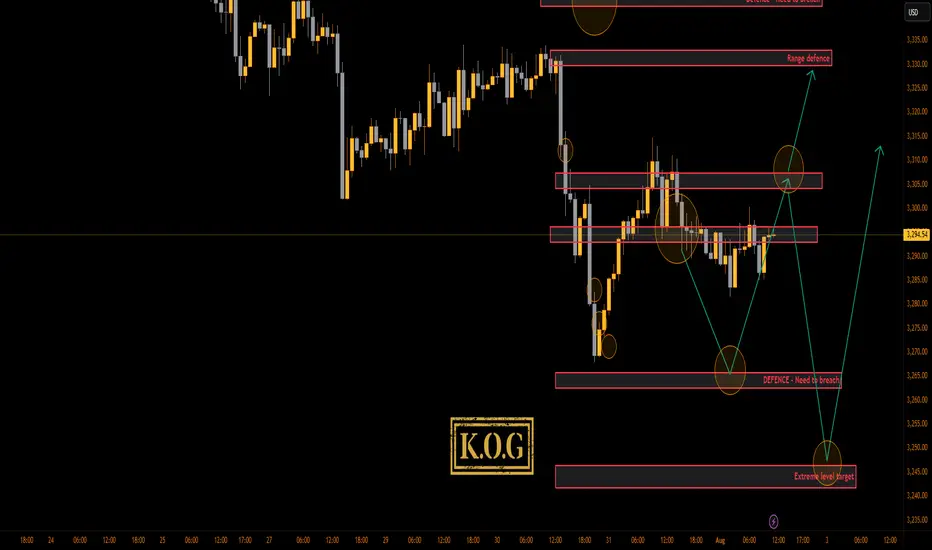
THE KOG REPORT - NFPTHE KOG REPORT – NFP
This is our view for NFP, please do your own research and analysis to make an informed decision on the markets. It is not recommended you try to trade the event if you have less than 6 months trading experience and have a trusted risk strategy in place. The markets are extremely volatile, and these events can cause aggressive swings in price.
Following on from the FOMC KOG Report which worked quite well, we’ll stick with the same chart and for today suggest caution. It’s the first day of the month and the last day of the weekly candle. The close here for gold is important and will give us further clues to the next few months.
We’ve shared the red boxes and the red box targets are below. There is a key level above 3306-10 which will need to be breached to correct the move back up to the 3330-34 region for the weekly close. However, we now have an undercut low which is potential if there is more aggressive downside to come and that level is sitting around the 3240-50 region which for us may represent an opportunity for a swing low. We’re a bit low and stretched here to short and as we’ve already hit our target for the day so we’ll wait for the extreme levels and if hit and our indicators line up, we may take some scalps. Otherwise, as usual on these events, the ideal trade will come next week.
RED BOXES:
Break above 3290 for 3295, 3306, 3310 and 3320 in extension of the move
Break below 3275 for 3267, 3260, 3255 and 3250 in extension of the move
Please do support us by hitting the like button, leaving a comment, and giving us a follow. We’ve been doing this for a long time now providing traders with in-depth free analysis on Gold, so your likes and comments are very much appreciated.
As always, trade safe.
KOG
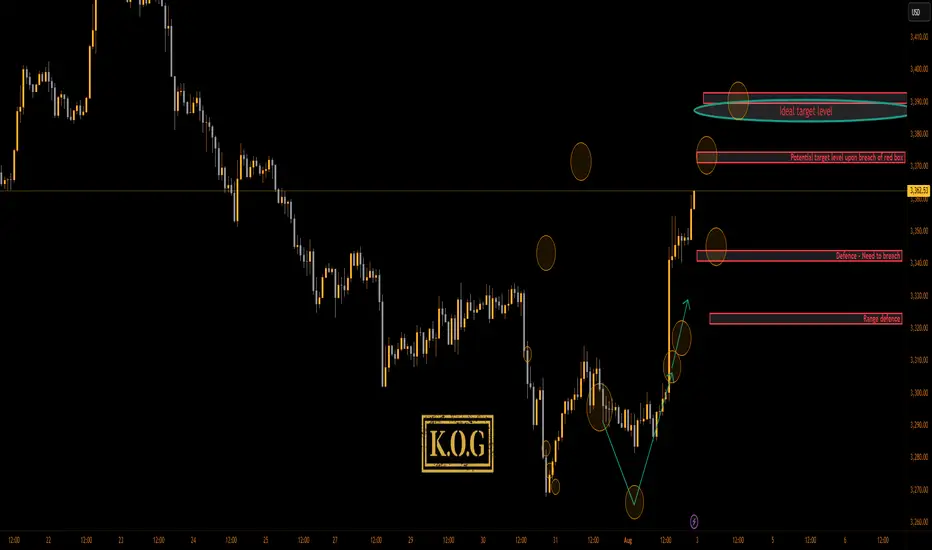
THE KOG REPORT - NFP UPDATE 1H 1H:
This is the chart we used last week for the FOMC and NFP KOG Reports. From the chart we can see the low was captured for FOMC and NFP didn’t give us an undercut low. We’ve kept the potential target box from the Report and for now we’ll stick with it. Red box defence is active below at the 3340-5 level and the ideal target stands above in the oval as long as we remain above the 3340 bias level.
KOG’s bias for the week:
Bullish above 3340 with targets above 3370, 3373, 3379 and above that 3384
Bearish on break of 3340 with targets below 3330, 3320 and below that 3310
RED BOXES:
Break above 3365 for 3372, 3375, 3379, 3384 and 3390 in extension of the move
Break below 3350 for 3346, 3340, 3335 and 3330 in extension of the move
Please do support us by hitting the like button, leaving a comment, and giving us a follow. We’ve been doing this for a long time now providing traders with in-depth free analysis on Gold, so your likes and comments are very much appreciated.
As always, trade safe.
KOG
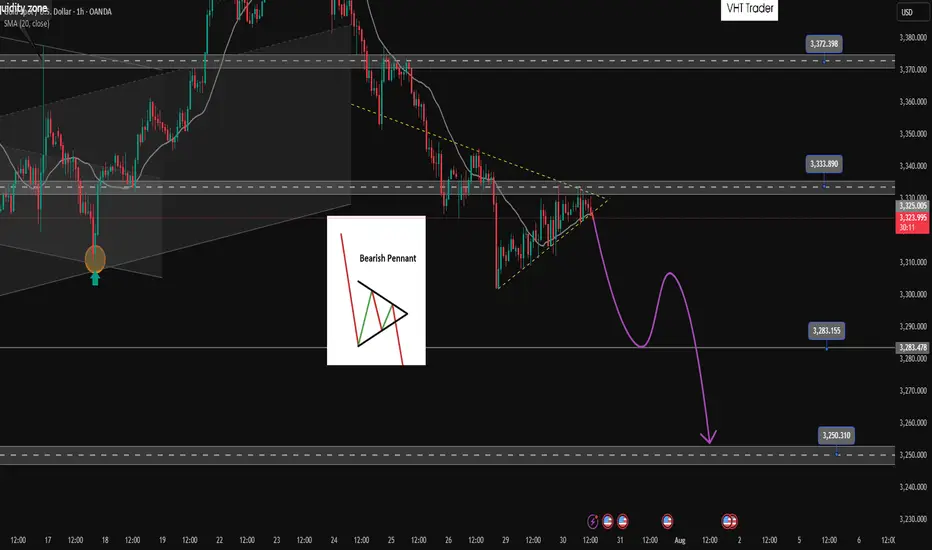
Bearish pennant pattern active. Active SELL✏️Gold price is forming a triangle accumulation pattern. That shows the hesitation of investors at the moment, they may be waiting for important economic indicators of the US this week. Just an impact that makes Price break out of the triangle border can create a strong FOMO trend. The price line is quite similar to the bearish pennant pattern and heading towards really strong support areas.
📉 Key Levels
SELL Trigger: Break bottom line 3324
Target 3285, lower is the 3250 area
BUY Trigger: Break and trading above 3333
BUY Trigger: Rejection and confirmation of candle at 3285
Leave your comments on the idea. I am happy to read your views.
XAUUSD under pressure – Is the downtrend just beginning?Hello everyone! What do you think about XAUUSD right now?
Yesterday, XAUUSD extended its decline and is currently trading around 3,315 USD.
The recent drop in gold prices was mainly triggered by a stronger US dollar, following a trade agreement between the US and the European Union (EU).
From a technical perspective, the short-term outlook shows the beginning of a new downtrend. Notably, we see a bearish crossover in the EMA 34 and 89, along with a break of the previous upward trendline—both reinforcing the current bearish momentum.
If there’s a pullback before the next leg down, the 0.5–0.618 Fibonacci retracement zone (which also aligns with resistance and the EMAs) will be a key area to watch. This could be an ideal level for potential trade setups.
Looking ahead, the next support target is around 3,300 USD. If that level breaks, gold might aim for the 32XX region.
Do you think XAUUSD will continue to fall? Drop your thoughts in the comments!
Wishing you successful and profitable trades!
Gold suddenly increased sharply Hey everyone, let’s dive into what’s happening with XAUUSD!
Gold is experiencing a remarkable rally this weekend, skyrocketing from the $3,285 zone to around $3,362 — gaining over 700 pips. This sharp move comes amid weakening U.S. labor market data, which has fueled speculation that the Federal Reserve may begin cutting interest rates as early as September.
According to the U.S. Bureau of Labor Statistics (August 1st), non-farm payrolls rose by just 73,000 jobs in July — well below economists’ expectations of 106,000. The disappointing figures have shaken confidence in the U.S. economy and placed pressure on the U.S. dollar, as markets increasingly anticipate a dovish shift from the Fed.
For gold, this weak jobs report reinforces its role as a safe-haven asset, driving strong demand as investors seek protection from economic uncertainty. At the same time, lingering fears around global trade tensions and new tariffs imposed by President Donald Trump continue to support the flight to safety.
From a technical perspective, gold has broken out of its descending price channel and is moving fast. According to Dow Theory, a short-term correction may occur soon, but if price holds above key support levels, the rally could extend toward the $3,432 region — the 1.618 Fibonacci extension zone.
This move might mark the beginning of a new bullish phase after weeks of consolidation.
What do you think — is gold just getting started?
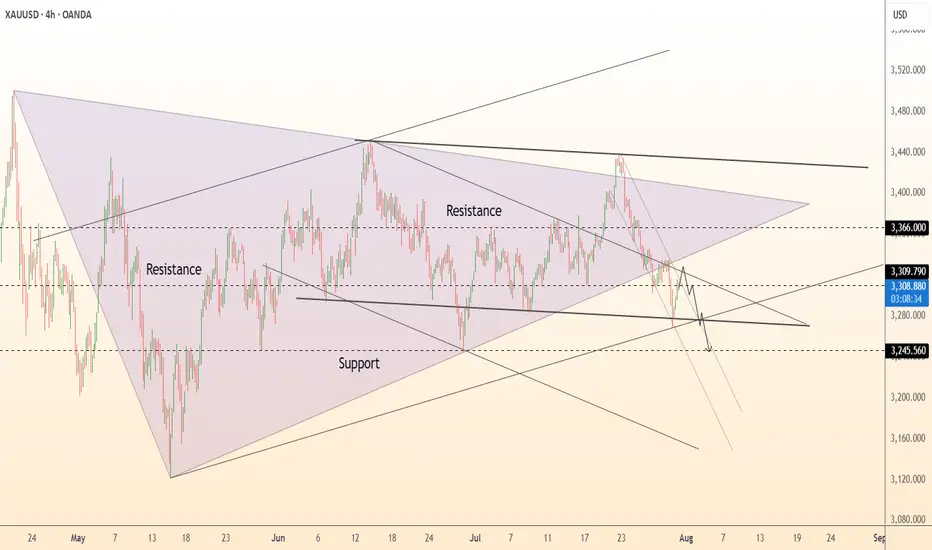
DeGRAM | GOLD fixed below the triangle📊 Technical Analysis
● XAUUSD is forming a bearish descending wedge within a broader symmetrical triangle, facing rejection at 3,310 near prior support-turned-resistance.
● Repeated failure to hold above trendlines and continued lower highs favor a drop toward the 3,246.56 level, with possible overshoot if support breaks.
💡 Fundamental Analysis
● Rising real yields and hawkish Fed tone continue to pressure gold; ISM Manufacturing Prices and NFP loom as next volatility catalysts.
● Reduced ETF inflows and strong dollar on resilient US macro data weigh on demand for non-yielding assets.
✨ Summary
Short bias below 3,310. Breakdown eyes 3,246 → 3,200 zone. Resistance holds while trendline caps recovery.
-------------------
Share your opinion in the comments and support the idea with a like. Thanks for your support!