XAUUSD 4Hour TF - August 3rd,2025🟦 XAUUSD 4H Analysis Long Idea
📅 August 3rd, 2025
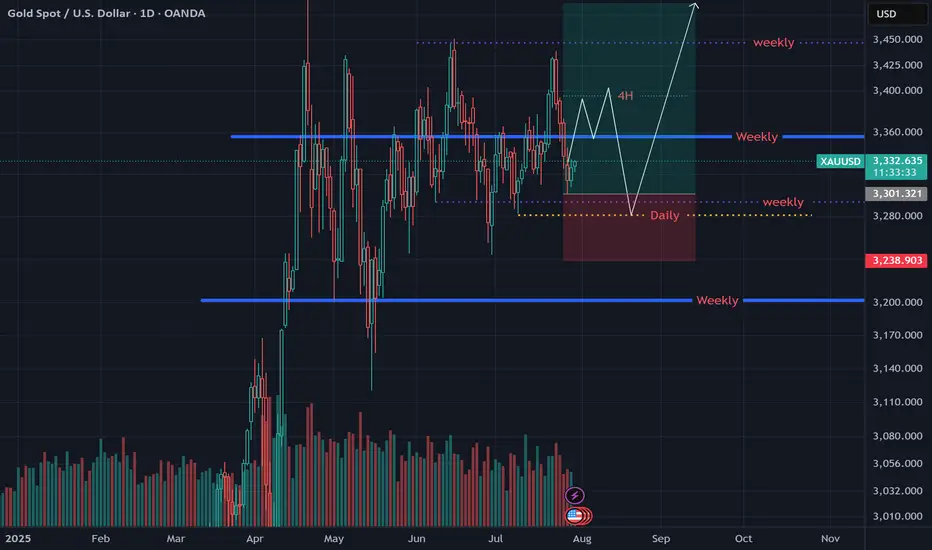
🔹 Top-Down Trend Bias:
• Monthly – Bullish
• Weekly – Bullish
• Daily – Bullish
• 4H – Bullish
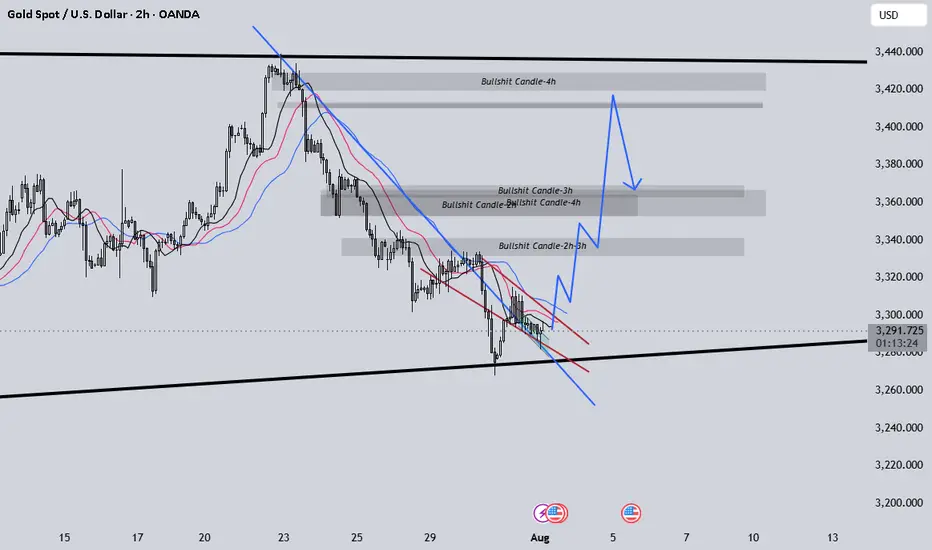
Price has broken out of a consolidation, confirming short term bullish momentum in alignment with the higher timeframes. We’re now watching how price reacts on a potential retest of the key $3,320 structure.
🔍 Key Level: $3,320
This former resistance now acts as a critical support zone. How price reacts here will determine short-term direction.
✅ Scenario A: Bullish Continuation
Clean retest of $3,320–$3,335
1.Look for bullish confirmation: wick rejections, bullish engulfing, or lower timeframe structure shift
Target 1: $3,395
Target 2: $3,450
This setup aligns with the overall bullish bias. We have ideal R:R with a clear invalidation to exit on if $3,320 fails as support.
⚠️ Scenario B: Bearish Rejection
1.Failure to hold $3,320 = potential trap breakout
2.Look for structure below $3,320 + bearish conviction
Target: $3,225 support zone
Only valid if $3,320 flips to resistance and confirms structure shift.
🧠 Final Notes
• Let price confirm the setup
• Structure > emotion
• Both scenarios are valid, but only with confirmation
GOLD trade ideas

Gold weekly chart with buy and sell entries plus swing trade ide1. Overall Chart Analysis
Timeframe and Trend: This 4-hour chart highlights a short-term downtrend with signs of exhaustion and consolidation. Gold peaked sharply on the left (possibly a local high around 2,400+), followed by a steep decline with lower highs and lower lows, forming what looks like a descending channel (diagonal trendlines connecting peaks and troughs). Recent candles show sideways ranging with smaller bodies and wicks, indicating indecision or a potential reversal setup. This could be a bear flag pattern or a base for accumulation.
Key Patterns:
Bearish Decline: Strong red candles early on suggest impulsive selling, possibly driven by external factors like USD strength or rising yields. However, the downtrend is losing steam, with recent bounces off lower levels.
Range-Bound Action: Price is trapped in a horizontal range (bounded by your marked lines), with dojis and spinning tops signaling buyer-seller balance. A breakout could lead to a volatile move.
Support and Resistance: Your green lines (lower) align with support zones where price has reversed upward multiple times. Red lines (upper) act as resistance caps, rejecting rallies.
Indicators (Inferred):
Moving Averages: Price is likely below key MAs (e.g., 50-period or 200-period EMA), confirming bearish bias. A golden cross (shorter MA crossing above longer) near green lines could validate buys.
RSI (Relative Strength Index): Potentially oversold (below 30) at green line tests, supporting buy entries. Neutral or overbought (above 70) near red lines would favor sells.
Volume and Momentum: Volume bars on the right show spikes on down moves but fading recently, hinting at bearish exhaustion. MACD might show narrowing histograms, indicating weakening momentum.
Volatility: If Bollinger Bands are applied, they're likely contracting, suggesting an imminent expansion (breakout).
Market Bias: Bearish in the short term due to the downtrend, but with bullish potential if support holds (gold's macro uptrend from inflation/geopolitical hedging). Watch for catalysts like US economic data or Fed announcements. The setup favors range trading (buy low, sell high) until a clear breakout.
Risk Considerations: Gold can move 50-100 pips per 4H candle; use tight stop-losses (SL) 1-2% away from entries. Risk no more than 1% of your account per trade. Multi-timeframe confirmation (e.g., daily chart) is recommended.
2. Analysis of Marked Levels and Entry Rationale
Your lines are horizontal, with green lines clustered at lower price levels (buy zones, e.g., around 2,300–2,320) and red lines at higher levels (sell zones, e.g., around 2,340–2,360). These appear to be based on prior price action (swing points). I'll group them by color and explain the technicals, drawing from support/resistance, patterns, Fibonacci, and momentum.
Green Lines: Potential Buy Entries (Bullish Setups)
These lower lines seem to mark strong support areas where price has bounced repeatedly, often with bullish candle formations. They could represent the floor of the descending channel or a demand zone.
Technicals Supporting Buys:
Support Zones: Green lines align with historical swing lows (e.g., visible double or triple bottoms in the chart's dips), where buyers have defended price. This creates a "value area" for accumulation, especially in gold's broader bullish context.
Candlestick Patterns: Bullish signals like hammers, bullish engulfing, or long lower wicks appear at these levels—indicating rejection of lower prices and potential reversal. For example, a green candle closing above the line after a touch would confirm entry.
Fibonacci Retracement: Drawing from the chart's high (left peak) to low, green lines likely hit key levels like 61.8% or 78.6% retracements—common for buying deep pullbacks in trending markets.
Momentum and Divergence: RSI bullish divergence (price lower lows, RSI higher lows) or an oversold reading supports upside. The downtrend's slowing pace (smaller red candles) suggests fading sellers.
Trend Context: These are counter-trend buys in a downtrend—ideal for scalps or reversals. Wait for confirmation, like a 4H close above the green line or increased volume.
Entry Strategy: Enter long on a retest of the green line with bullish confirmation (e.g., RSI >30 crossover). Place SL 20-30 pips below the line to account for wicks.
Suggested Take-Profit Levels:
TP1 (Conservative): Nearest minor resistance or 38.2% Fibonacci level—e.g., if entry at ~2,310, TP at 2,330 (1:1 risk-reward, ~20 pips profit for quick partial exit).
TP2 (Aggressive): Mid-range or next red line—e.g., 2,340–2,350 (1:2 ratio, scale out 50% of position).
Stretch TP3: If bullish breakout above the channel, target prior highs (e.g., 2,370–2,400). Trail stops using a 20-period MA or ATR-based levels for dynamic exits.
Red Lines: Potential Sell Entries (Bearish Setups)
These upper lines appear to cap price action, with rejections forming bearish patterns. They could be the ceiling of the channel or supply zones.
Technicals Supporting Sells:
Resistance Zones: Red lines correspond to prior swing highs (e.g., failed rallies in the mid-chart), round psychological numbers, or the upper channel boundary. Multiple touches with downside reversals confirm seller control.
Candlestick Patterns: Bearish indicators like shooting stars, bearish engulfing, or long upper wicks at red lines signal rally failures—sellers stepping in aggressively.
Fibonacci Extension/Retracement: From the downtrend's wave, red lines might align with 38.2% or 50% retracements—prime spots for selling into strength within a bearish structure.
Momentum Indicators: RSI overbought (above 70) or bearish divergence (price higher highs, RSI lower highs) at these levels reinforces downside. MACD line cross below signal line could trigger entries.
Trend Context: Aligns perfectly with the downtrend's "sell the rallies" mantra. The overall lower highs pattern suggests continuation unless broken.
Entry Strategy: Enter short on a rejection from the red line (e.g., red candle close below it with volume). Place SL 20-30 pips above the line.
Suggested Take-Profit Levels:
TP1 (Conservative): Nearest minor support or green line below—e.g., if entry at ~2,350, TP at 2,330 (1:1 ratio, ~20 pips for scalping).
TP2 (Aggressive): Lower range or channel support—e.g., 2,310–2,300 (1:2 ratio, partial close).
Stretch TP3: If bearish breakdown below green lines, target extended supports (e.g., 2,280–2,250 via 161.8% Fibonacci extension). Trail stops with a parabolic SAR or based on recent swing lows.
3. Additional Suggestions and Scenarios
Breakout Scenarios:
Bullish Breakout: A strong close above the highest red line (e.g., on high volume or positive news) invalidates sells—switch to longs targeting 2,400+ (macro resistance).
Bearish Breakdown: Close below the lowest green line accelerates downside to 2,250–2,280 (next major support, possibly a monthly low).
Risk-Reward and Position Management:
Prioritize 1:2+ RR (e.g., risk 20 pips to gain 40+). Use partial profits: Exit 50% at TP1, trail the rest.
Combine with oscillators: Avoid buys if RSI <20 (extreme oversold) or sells if >80 (overbought).
Time of Day: Gold volatility peaks in NY/London sessions; avoid thin markets.
Potential Biases or Warnings:
Gold's inverse correlation to USD (check DXY) or bonds could override technicals—e.g., a weak USD might break red lines upward.
The range is tightening; a false breakout is possible. If consolidation persists, consider straddle strategies.
This is a technical view only; fundamental shifts (e.g., Middle East tensions boosting gold) could alter dynamics.

XAUUSD
XAUUSD Updated in H1 :
The gold signal is marked on the chart based on the latest price changes and the supply and demand in the market. These points include the entry point, stop loss, and take profit
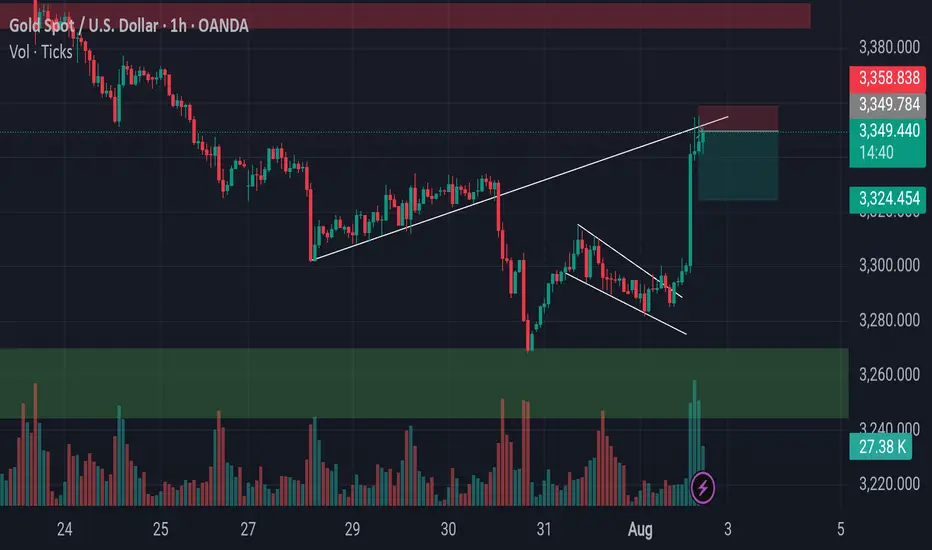
Gold Approaches Key Reversal Zone After Liquidity Sweep.Gold has recently broken out of a parallel channel during the New York session, followed by a strong upward move triggered by the NFP (Non-Farm Payroll) news event. Currently, the market is trading near a key trendline resistance zone. In this area, the price has also swept the liquidity residing above recent highs, indicating that potential buy-side liquidity has been taken out.
This level now becomes critical for observation. If the market forms a Market Structure Shift (MSS) or provides any valid bearish confirmation — such as a strong rejection candle, bearish engulfing, or a break of lower timeframe support — then there is a high probability that a downward move may follow from this zone.
As always, conduct your own research (DYOR) and wait for price action to confirm the bias before executing any trades. Acting on confirmation rather than assumptions protects both capital and strategy.
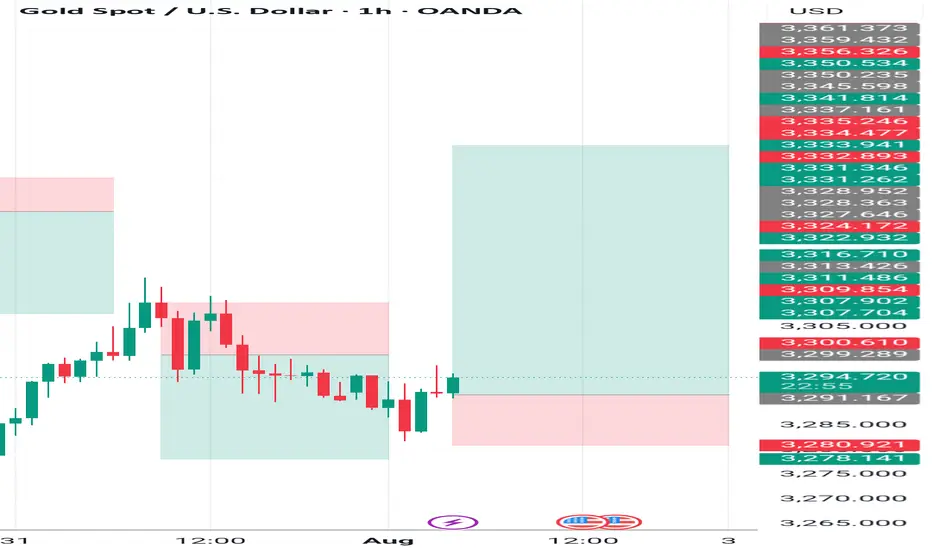
Gold continues to go long in the 3280-3300 range.Gold continues to go long in the 3280-3300 range.
Today, we remain firmly bullish on a bottom in the 3280-3300 range.
On August 1st, the Federal Reserve, while keeping interest rates unchanged, acknowledged slowing economic growth, triggering a repricing of expectations for a rate cut.
This led to a rebound in gold prices, but of course, this was just a pretext for the price increase.
Recently, gold prices experienced a four-day decline (July 23-28), falling from $3431 to $3268, as progress in trade negotiations and a rebound in the US dollar dampened safe-haven demand.
Non-farm Payrolls
Here are the key takeaways:
Today's US July non-farm payrolls data (expected to increase by 110,000, compared to 147,000 previously) will determine expectations for a September rate cut by the Federal Reserve.
A weak reading (e.g., below 100,000) could push gold prices back towards $3,400;
A strong reading (above 150,000) would remain bearish for gold. Gold prices continue to decline, and we are long in the 3280-3300 range.
Today, we remain firmly bullish on gold bottoming in the 3280-3300 range.
On August 1st, the Federal Reserve, while keeping interest rates unchanged, acknowledged slowing economic growth, triggering a repricing of rate cut expectations in the market.
This led to a rebound in gold prices, but of course, this was just a pretext for the price increase.
Recently, gold prices experienced a four-day decline (July 23-28), falling from $3431 to $3268, as progress in trade negotiations and a rebound in the US dollar dampened safe-haven demand.
Non-farm Payroll Data
Here are the key takeaways:
Today's US July non-farm payroll data (expected to increase by 110,000, compared to 147,000 previously) will determine expectations for a September rate cut by the Federal Reserve. A weak reading (e.g., below $100,000) could push gold back to $3,400.
A strong reading (above $150,000) would continue to be bearish for gold.
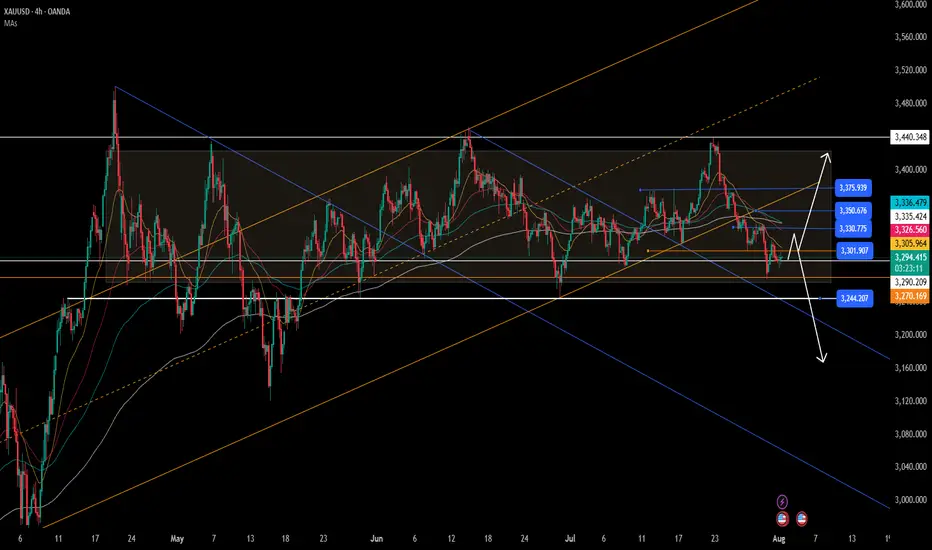
Technical Analysis and Trading Recommendations
Key Levels:
Support:
$3,270 (100-day moving average)
$3,248 (June low);
Resistance:
$3,300 psychological level
$3,340 (21-day/50-day moving average crossover).
Trading Strategy:
Short-term:
1: If the price holds above $3,300, initiate a long position with a target of $3,330-3,350.
2: If the price falls below $3,270, a drop to $3,248 is possible.
3: Focus on the key watershed at $3,300
4: Key Point:
As long as the gold price is above $3,300, I believe it's a good time to buy the dip. Following the upward trend in gold prices is a very wise choice.
As shown in Figure 4h:
The potential for gold prices to rebound is becoming increasingly clear.
The lower edge of the wide fluctuation range is slowly stabilizing.
BuyLondon Session
Daily Volume
Untapped Zone
Market Structure
NT:: Limit order must be tapped before the breach of the red line
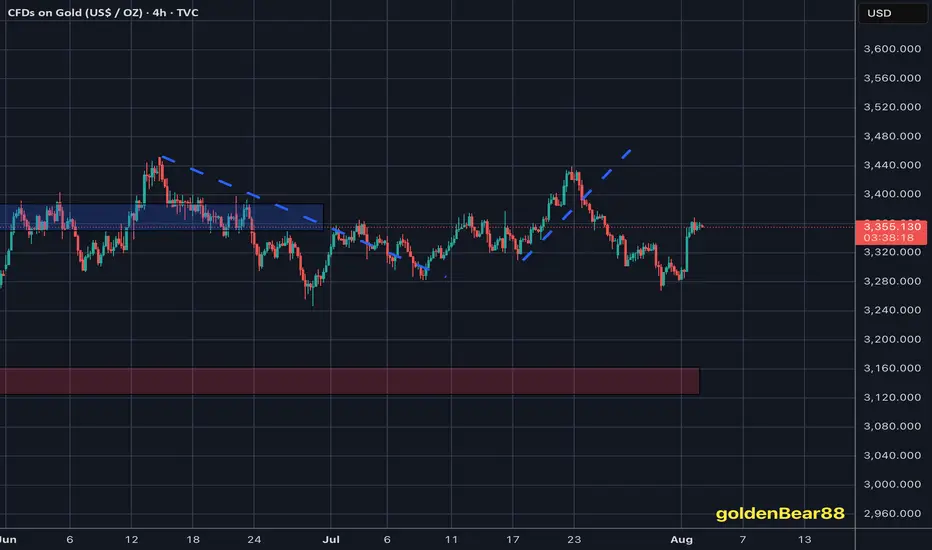
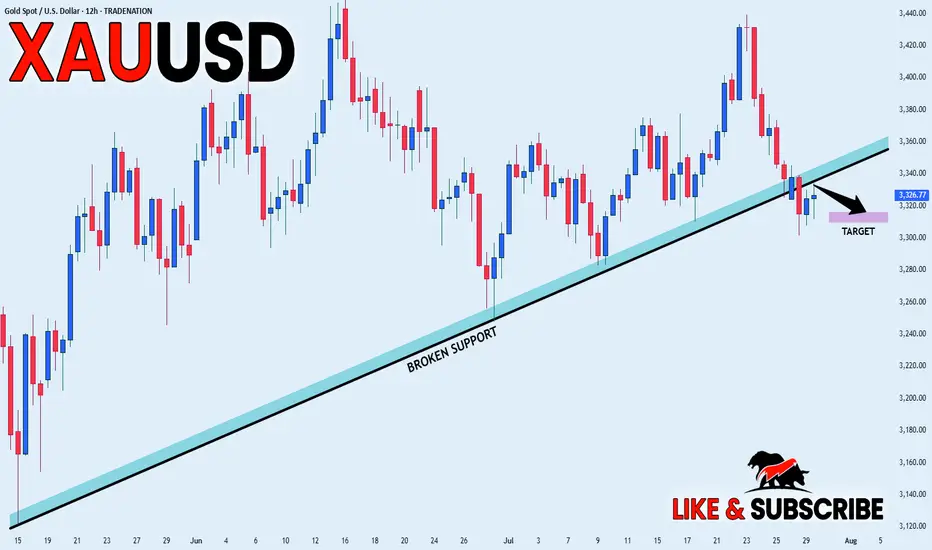
GOLD BEARISH BIAS|SHORT|
✅GOLD broke the rising
Support line which is now
A resistance and the price
Is retesting the line now so
We are locally bearish biased
And we will be expecting a
Local move down
SHORT🔥
✅Like and subscribe to never miss a new idea!✅
Disclosure: I am part of Trade Nation's Influencer program and receive a monthly fee for using their TradingView charts in my analysis.
XAUUSD ShortI am a beginner trader! This is just an analysis for educational purposes. I don't provide signals for trading.

Elliott Wave Analysis – XAUUSD, August 5, 2025📊
________________________________________
🔍 Momentum Analysis:
• D1 Timeframe:
Momentum has entered the overbought zone. As anticipated in previous plans, we've seen four consecutive bullish days, and the current overbought condition signals that bullish momentum is weakening.
• H4 Timeframe:
Momentum is reversing downward → We expect a potential pullback today, at least until the US session.
• H1 Timeframe:
Momentum is also turning down → This supports the possibility of a short-term pullback on the H1 chart.
________________________________________
🌀 Wave Structure Analysis:
Currently, there are two key scenarios to consider:
✅ Scenario 1 – ABC Correction Structure (black labels):
• If this is a C wave completing an ABC correction, the current bullish move is likely over.
• In this case, price may break below the 3315 support zone, resuming the medium-term bearish trend.
✅ Scenario 2 – Impulse Wave 12345 (black labels):
• If this is wave 5 of a 5-wave impulse, the uptrend may not be complete yet.
• Currently, wave 5 has reached its first target at 3385, however, we must still watch for an extended target around 3402.
• Notably, wave 4 took the form of a triangle. According to Elliott Wave theory, when wave 4 is a triangle, wave 5 typically travels a distance equal to the triangle’s maximum height → This makes 3385 a highly probable peak area.
________________________________________
🧭 Trade Plan (Reference Only):
🔹 Sell Setup #1 – Near Potential Wave 5 Top:
• Sell Zone: 3375 – 3378
• Stop Loss: 3387
• TP1: 3365
• TP2: 3344
• TP3: 3333
🔹 Sell Setup #2 – In Case of Extended Wave 5:
• Sell Zone: 3400 – 3402
• Stop Loss: 3410
• TP1: 3385
• TP2: 3368
• TP3: 3333

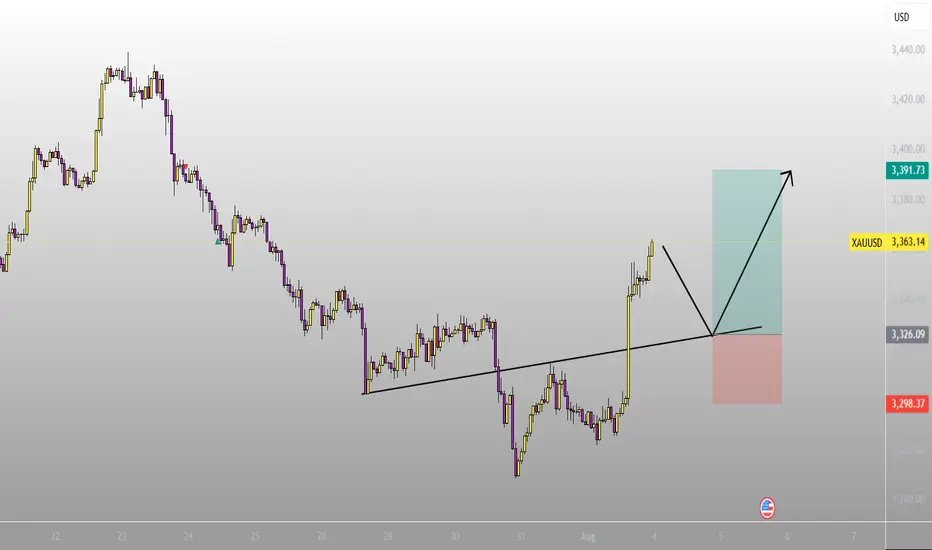
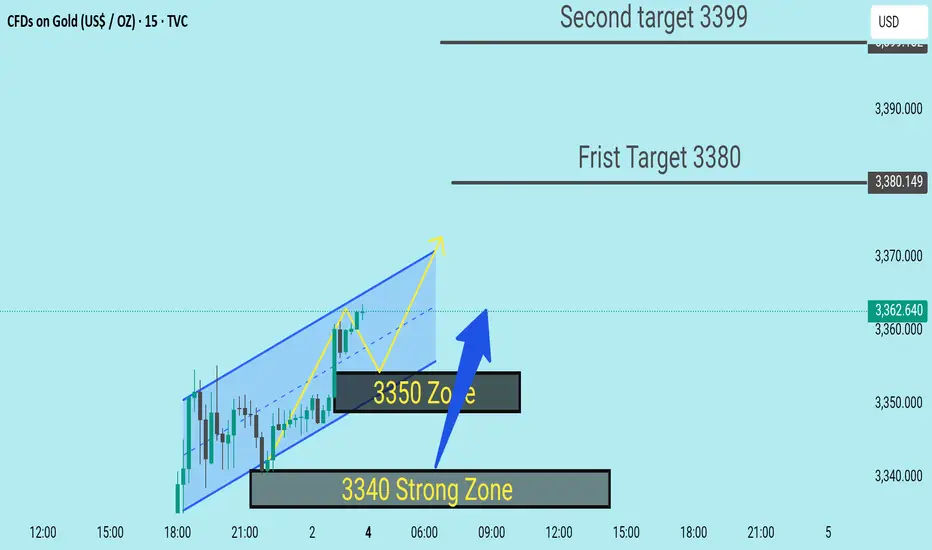
XAUUSD Expecting bullish Movement Price respected the Strong Demand Zones at 3350 & 3340, showing clear signs of buyer strength. After forming a falling wedge pattern, a bullish breakout was observed — confirming potential upside momentum.
Zone Analysis
3350 Zone: Minor support confirmed with consolidation
3340 Zone: Stronger support with buying pressure visible
Current Price: 3362
First Target: 3380
Second Target: 3399
A clean move above the wedge resistance is now playing out, and as long as price holds above 3350, bullish momentum remains valid.
Monitoring price action around 3380 for partials, and watching for clean sweep into 3399
BULLISH REVERSALAfter struggling between the 2 key levels, XAUUSD showed a change of character indicating a reversal. Target is 500 pips.
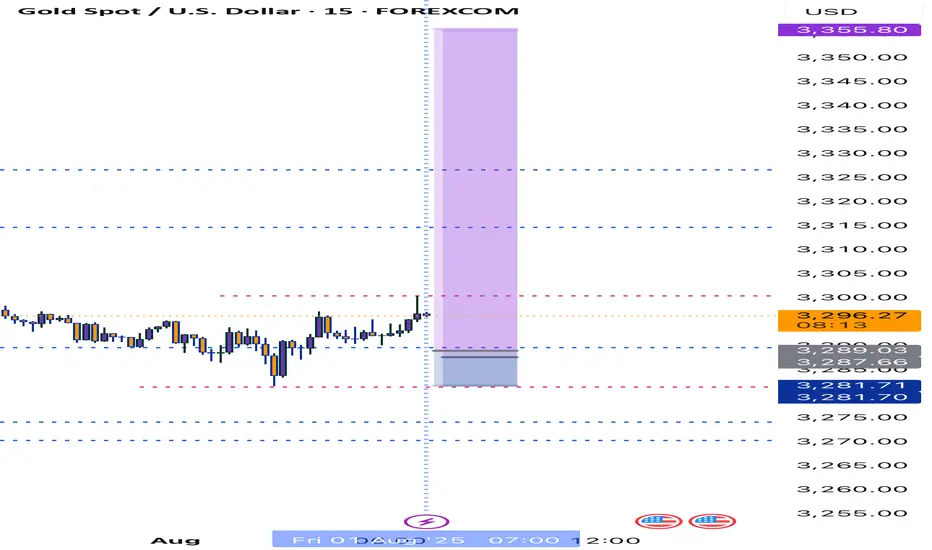
XAUMO XAUUSD (Gold Spot) ANALYSIS | AUG 01, 2025 | CAIRO TIME GMThis is a stealth bullish accumulation day. Market maker completed a fake drop and now prepping breakout. Play long bias from control zone with stop-hunt fade backup. Schabacker would call this a false breakdown spring + congestion base rally.
XAUUSD (Gold Spot) ANALYSIS | AUG 01, 2025 | CAIRO TIME GMT+3
🔍 Multi-Timeframe Technical Breakdown (Daily → 5m)
1️⃣ Price Action & Patterns
Daily: Bullish rejection tail forming (pin bar) off VAL (3,288). Strong buyer defense.
4H: Classic bullish engulfing off VAL support. High rejection wick to downside. Micro-structure shows market maker trap.
1H: V-shape recovery seen. Absorption bar confirmed via footprint delta spike.
15m: Buyers stepping in at POC (3,289.35), stealthy buying—confirmed by divergence between delta & price.
5m: Accumulation in box range between 3,289–3,292. High absorption on bid side, low offer lifting—sign of stealth long build.
2️⃣ Volume & Delta Footprint
POC Cluster across all TFs: 3,289.00–3,291.50 is the control zone.
Volume Node Rejection at 3,288 = confirmed buyer base.
Delta: Absorption → sellers hitting bids but no follow-through = market maker trap → bullish implication.
Volume Spike at 3,288 = fakeout move likely manipulated to hunt stops.
3️⃣ Support/Resistance
VAL: 3,288 🔥 Strong Demand Zone
POC: 3,289.35–3,291.75 🧠 Smart Money Zone
VAH: 3,292.80 🎯 Break above confirms momentum
Res. Extension: 3,296.20, 3,300
Fibonacci Confluence: 3,288 = 61.8% golden retracement from recent rally
5️⃣Volatility
Compression near VAH = Volatility Expansion imminent.
Expect Breakout in next 1–2 hours (likely post 09:00 Cairo Time – Kill Zone)
6️⃣ Market Maker Philosophy
Last 3 days show liquidity vacuum trap below 3,288.
MM has triggered stop hunts to shake weak longs.
Building long inventory stealthily under POC.
Expecting rally trap to suck in breakout buyers → then retrace → final breakout continuation.
🧨 JEWEL TRADE ENTRY (Highest Probability)
📈 Order: Buy Stop
🎯 Entry: 3,293.10
🛑 Stop Loss: 3,287.70
💰 Take Profit: 3,302.40
📊 Confidence: 87%
🧠 Justification: Breakout of VAH/Golden Zone + High Volume Node = Trend Shift Confirmed
This is for EDUCATIONAL PURPOSE ONLY, and not financial advise.

Direct Buy In Gold : Coming Currently gold is trading under falling wedge pattern which will explode soon once volume will come . Buying here is good idea imao
Where is GOLD going next?In the last four months, GOLD privided us a common pattern (for four times) that usually lead to an explosive moves. Where are we going next and what could be the target? In this case, time help us to understand better. The pattern is not complete yet and i expect the move to run in 24 hrs (maybe due to the high impact news will we have tomorrow, like the Initial Jobless Claim and CPE?). Now we just need to understand where the price will go to make profits, and to try to understand this we will check the RSI and the MACD. When this pattern occured, the RSI was rising and above 50 for three times with MACD on bullish cross (the three times that the price pumped) and was chopping and struggling close to 50 (but below it) with a bearish cross on MACD the single time it crushed. If we look at the actual situation, RSI is rising and MACD it's on bullish setup, but i will update you tomorrow (or when a breakout will occur). Now, for the possible target, we can easily aim to $100 move. So, price can touch $3420 for a long or $3240 for a short.
What do you think guys? Let me know in the comments!

Gold Intraday Trading Plan 7/31/2025Gold behaved as expected yesterday. It broke the channel and fell heavily, breaking both 3300 and 3280 supports. The bearish momentum is very strong right now.
I am looking for selling opportunity from 3300 and target 3255, which is my weekly target.

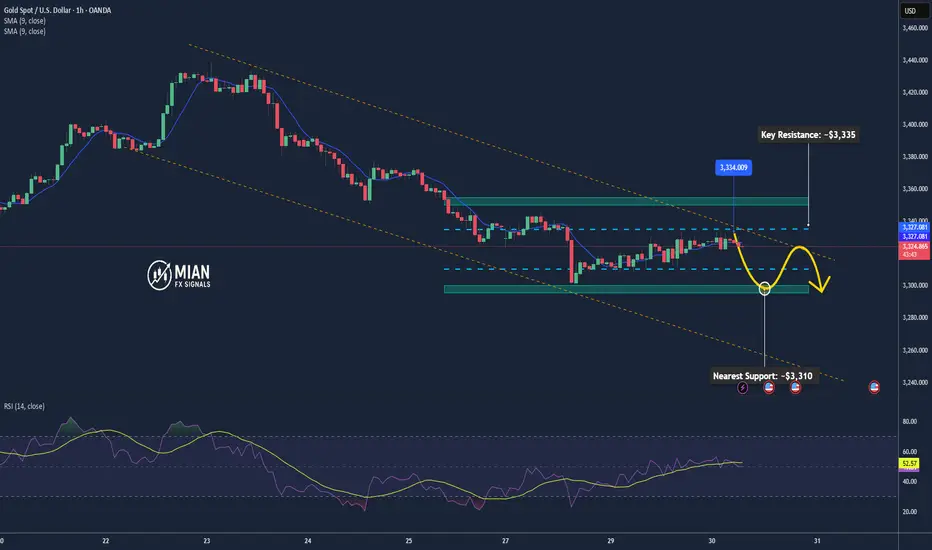
Gold May Dip Mildly Before US Data📊 Market Overview:
Spot gold is trading around $3,329/oz, up ~0.1%, supported by falling U.S. Treasury yields and a slightly weaker dollar, while investors await potential Fed dovish signals or rate cut in September . Meanwhile, easing U.S.–EU trade tensions weighed on safe-haven demand for gold.
📉 Technical Analysis:
• Key Resistance: ~$3,335–3,350 (recent highs and potential test zone)
• Nearest Support: ~$3,310 (previous stable support)
• EMA09 position: Price is above EMA9, indicating a mild bullish bias in the short term
• Momentum/Volume: RSI ~53 (neutral), MACD & StochRSI showing small buy signals. However, bullish momentum is fading, suggesting a possible mild pullback
📌 Conclusion:
Gold may dip modestly toward $3,310 if the dollar strengthens or if Fed rate-cut expectations recede. A break above $3,335–3,350 could pave the way for further gains, though current momentum remains insufficient to confirm a breakout.
💡 Suggested Trade Strategy:
SELL XAU/USD: $3,333–3,336
🎯 Take Profit: 40/80/200 pips
❌ Stop Loss: $3339
BUY XAU/USD: $3,310–3,308
🎯 Take Profit: 40/80/200 pips
❌ Stop Loss: $3305
Gold analysis by majidbabaeiasl My predictions for gold in previous years have been quite accurate and calculated. Right now, I think a wave 4 correction, which is a micro-wave, is taking place.

XAUUSD Outlook – July 29, 2025
Gold enters a high-risk environment starting today.
All eyes are on Jerome Powell's speech, which will signal whether the Fed remains firm on its hawkish stance or adopts a more dovish tone.
📈 That said, a broader look at the chart suggests the market has already aligned itself with the dominant trend.
🗓️ In addition to today’s speech, tariff-related news expected on Friday doesn’t seem likely to disrupt the ongoing bullish momentum in gold — or in crypto markets, for that matter.
🧠 That’s the general market read I'm sensing right now, but we’ll have to see how it unfolds.
🎯 Personally, I still view the $3290 level as a solid buy zone, with the potential to become one of gold’s historical bottoms.
Gold: dropped on trade deals The safe-haven asset had its ups and downs during the previous week. The week started with an uptrend, where the price of gold reached its highest weekly level at $3.430, on trade tariff tensions. However, the deal made between the US and Japan, pushed the price toward lower grounds, ending the week at $3.340. In addition, Friday's drop was supported by announced tariffs negotiations between the US and EU in Scotland during the weekend.
The RSI dropped below the level of 50 on Friday, ending the week at the level of 48. The MA50 slowed down its divergence from MA200, however, the potential cross is still far away. Still, weekly lows of the price of gold found support at MA50 levels.
The week ahead brings several currently very important US macro data, including JOLTs, PCE, NFP and Unemployment data. In addition, the FOMC meeting will be held where the market will receive the latest Fed's view on economic developments in the country and future expectations. Also, further news on trade tariff agreements, especially regarding ongoing negotiations between the EU and the US in Scotland, might make an impact on investors sentiment for safe-haven assets. As per current charts, the price of gold might revert a bit to the upside, after a drop during the last three days of the previous week. In this sense, the resistance level at $3,4K might be tested. On the opposite side, the situation on charts is a little bit tricky. Namely, there is a line which perfectly connects all lows from February this year. Friday's closing was exactly at this line, which again adds to the probability of a short reversal. However, if, in any case, the price of gold breaks this longer term trend, then it will indicate that the longer path to the downside is in store for gold.
GOLD Breakdown: Key Levels, Smart Money Trap & Price RecapHere's a full breakdown on GOLD covering the major levels I'm watching today, what the market did yesterday, and a key trap that many traders fall for.
This video is for educational purposes only and based on my personal trading plan.

Gold Price Analysis August 5#XAUUSD – Gold continues to increase in wave 3, BUY strategy continues to be prioritized
The D1 candle continued to close with strong increase, confirming that the uptrend is dominant and there are no clear signs of correction. Gold is currently moving in wave 3 - a period with strong amplitude and few recovery beats, so the main trading strategy is still to wait to buy at important support zones.
In the Asian session this morning, the price is reacting at the 3385 zone - an area that can act as a confirmation point for the next recovery. If the buyers maintain their position in this zone, the price will likely continue to move towards higher resistance zones.
🔹 Support zone to watch: 3363 – 3346 – 3332
🔹 Potential resistance zone: 3385 – 3407
👉 Strategy: Prioritize waiting for confirmation signals at support zones to open BUY orders in the direction of the trend. Need to carefully observe the price reaction at the 3385 zone to assess the strength of the buying force during the day.

GOLD BEARS WILL DOMINATE THE MARKET|SHORT
GOLD SIGNAL
Trade Direction: short
Entry Level: 3,366.62
Target Level: 3,261.15
Stop Loss: 3,436.93
RISK PROFILE
Risk level: medium
Suggested risk: 1%
Timeframe: 1D
Disclosure: I am part of Trade Nation's Influencer program and receive a monthly fee for using their TradingView charts in my analysis.
✅LIKE AND COMMENT MY IDEAS✅

Gold soaring with NFP debacle as an catalystQuick update: Gold is Trading on NFP fuelled relief rally and Bearish Technicals are invalidated once again (I announced lately that this might happen if NFP delivers downside surprise / debacle). The Hourly 4 chart's Ascending Channel increases it's gains towards Overbought levels as #3,352.80 benchmark is showcasing strong durability. Both Weekly chart (#1W) and Monthly (#1M) are on mild gains (# +0.65% and # +0.71% respectively) and with ranging candles (Gold consolidating above the Support for the fractal) I do not see any rebound (to the downside) possibility yet.
My position: As discussed above, I will keep Buying every dip on Gold and will not Sell Gold throughout today's session (if I do, will be aggressive in & out Scalp only). Gold remains very sensitive to every Bullish development while Bearish ones are still on second place.