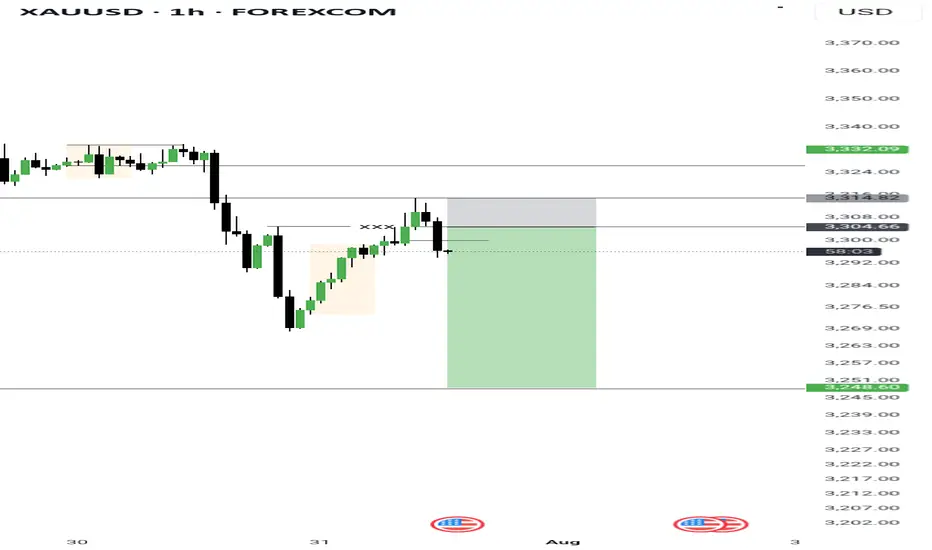
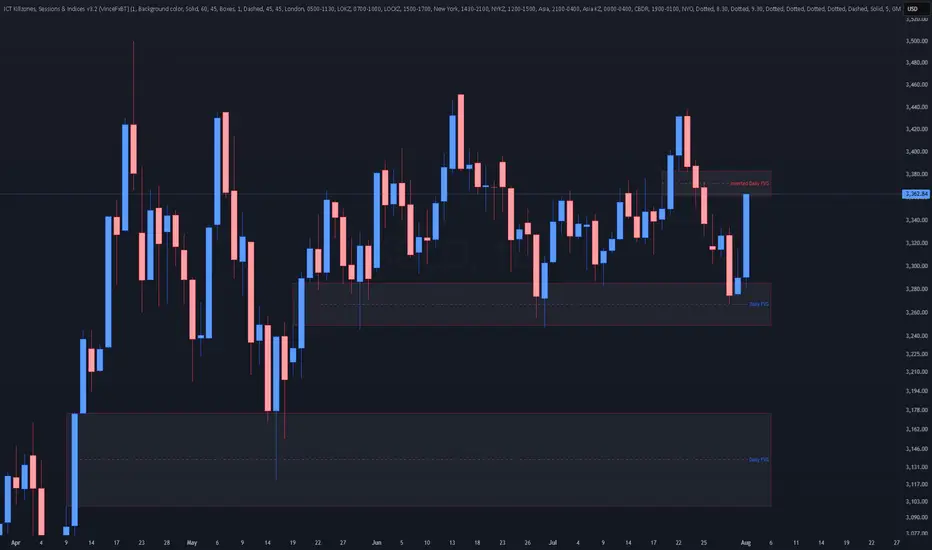
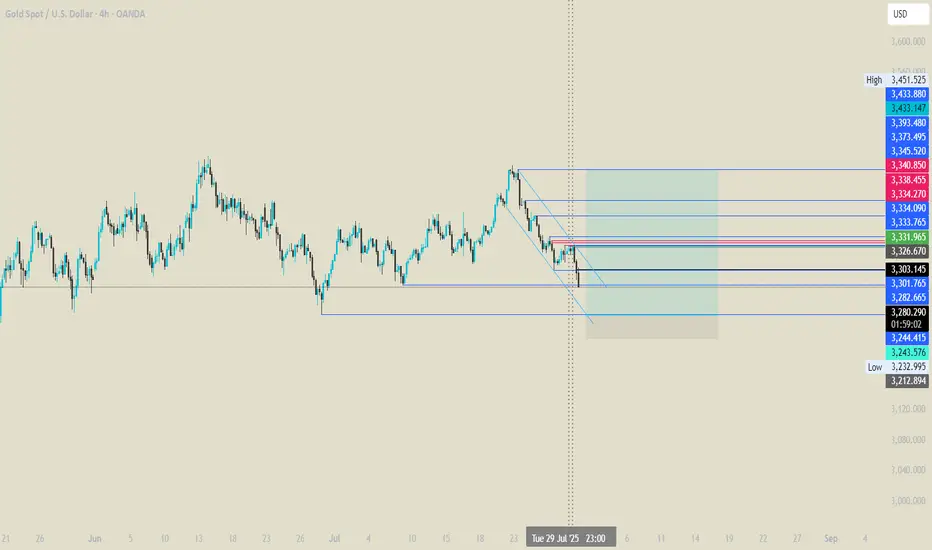
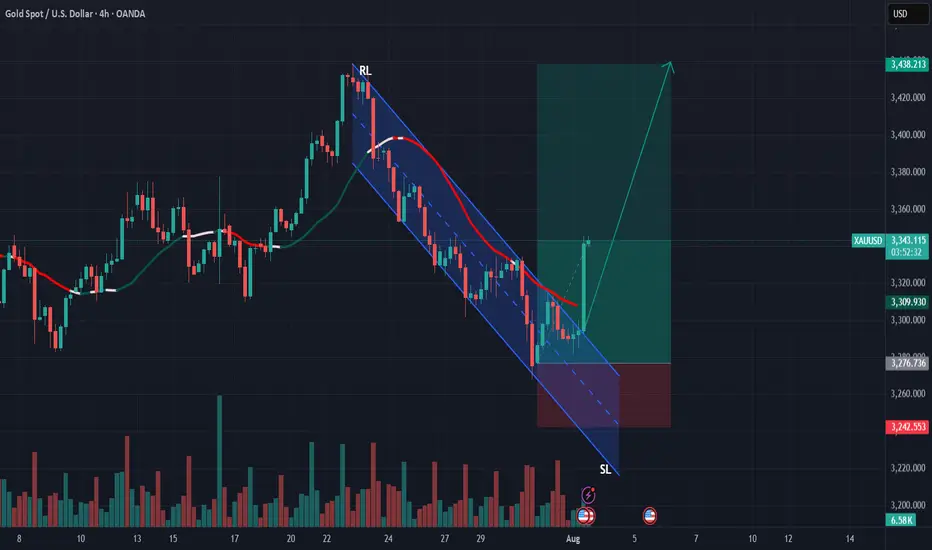
XAUUSD - Daily | More Consolidation??Gold is back in the upper range of this consolidation zone. You can see the high of the range is 3430, and the low is 3240 roughly.
Bulls:
Gold is pulling back into an Inverted FVG. If the price is bullish, then we should clear the gap with ease. Gold has just eliminated 4 days' worth of choppy bearish price action. Look for gold to give clear signs to enter a buy.
**A new daily candle should appear, creating a new FVG showing buyers are winning
Bears:
So with that said... If Gold fails to remain bullish after Friday's (Aug 1st) 700-pip jump, then the iFVG may have the price react bearishly. Watch for gold to give a clear sign of rejection before entering a sell
**Price may drop to cover Friday's gap. Doesn't mean it's bearish
GOLD trade ideas
Gold is significantly bullish, where can we short?The positive non-farm payroll report pushed the market from 3300 directly above 3330, demonstrating overall bullish momentum. Congratulations again, everyone. Real-time strategies are like a beacon guiding your investment journey. The market will never disappoint those who persevere and explore wisely. Charlie advises against blindly chasing highs. Trading advice (first hit is valid): Focus on key support levels: 3300 and 3310. Go long if these levels are reached.
~For those who want to go short above 3350-55, only use a stop-loss and feel free to try~ PEPPERSTONE:XAUUSD FXOPEN:XAUUSD ACTIVTRADES:GOLD FXOPEN:XAUUSD CMCMARKETS:GOLD VANTAGE:XAUUSD VELOCITY:GOLD
Gold Analysis and Trading Strategy | August 1✅ Fundamental Analysis
🔹 Trump Signs New Tariff Executive Order
On July 31, President Trump signed an executive order imposing a new round of tariffs on countries including Canada and India, while Mexico was granted a 90-day grace period. This move has once again heightened global trade uncertainty, fueling risk-off sentiment and providing support to gold.
🔹 Dollar Strength Limits Gold's Upside
Despite the increase in risk aversion, the U.S. Dollar Index has risen sharply, exerting downside pressure on gold. As a result, the price of gold remains capped, with a tug-of-war between bulls and bears dominating market dynamics.
🔹 Key U.S. Economic Data in Focus
The U.S. Non-Farm Payrolls (NFP) report is the major event on the calendar today. It is expected to be a decisive driver for short-term gold direction:
If the data is bullish for gold (e.g., weak job growth or slower wage increases), gold may retest the 3340 level.
If the data is bearish for gold (e.g., strong job gains or higher wages), gold may break below 3260, continuing its downward trend.
Ahead of the data release, gold is likely to remain in a consolidation range, with market participants generally adopting a cautious stance.
✅ Technical Analysis
🔸 Daily Chart Structure:
Gold printed a gravestone doji yesterday, characterized by a long upper shadow, indicating strong selling pressure at higher levels. The overall trend remains weak. After four consecutive daily declines followed by a minor rebound, another strong bearish candle has emerged, signaling a continuation of the downtrend.
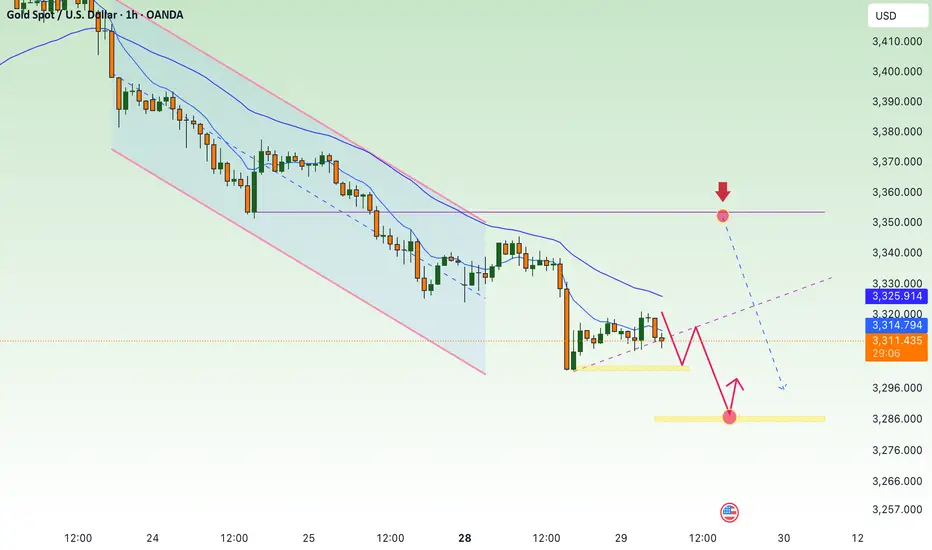
🔸 Hourly Chart Structure:
On the 1-hour timeframe, gold remains below all major moving averages, which are aligned in a bearish formation. Despite multiple rebound attempts, each high has been lower than the last, reflecting diminishing bullish strength. The second U.S. session high was capped around 3310. If today's rebound fails to break above that level, the bearish trend remains dominant.
🔴 Resistance Levels: 3305 / 3315 / 3340
🟢 Support Levels: 3275 / 3260 / 3245
✅ Trading Strategy Reference:
🔻 Short Position Strategy:
🔰Consider entering short positions in batches if gold rebounds to the 3305-3310 area. Target: 3285-3270;If support breaks, the move may extend to 3250.
🔺 Long Position Strategy:
🔰Consider entering long positions in batches if gold pulls back to the 3245-3250 area. Target: 3265-3275;If resistance breaks, the move may extend to 3285.
🔥Trading Reminder: Trading strategies are time-sensitive, and market conditions can change rapidly. Please adjust your trading plan based on real-time market conditions. If you have any questions or need one-on-one guidance, feel free to contact me🤝
Will gold continues the uptrend from now?I have notice that price retraces in 5 waves before continued go up, from Jun 2025 onwards until now (refer to chart above), and now price has went for 5 waves, and had break the last lower low level. I am going to anticipate the long with my strategy, projecting to higher high of this up trend.

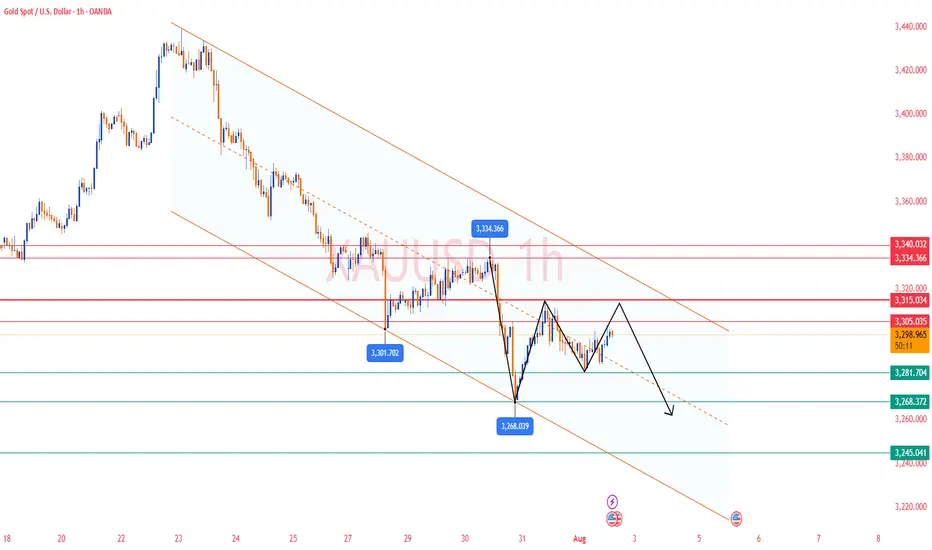
COOChI expect XAUUSD to sell beyond 100 pips after the impulse correction which retested a resistance key level.

MACRO CONTEXT & NEWS FLOW IMPACT — "WHY THE HELL IT MOVED"🔥 I. MACRO CONTEXT & NEWS FLOW IMPACT — "WHY THE HELL IT MOVED"
Yesterday’s move was a classic institutional fakeout followed by controlled accumulation. Today is retest day. Watch VWAP and order flow like a hawk. Don’t chase, wait for reversion and load at value.
📅 Date: July 30, 2025
📰 Event:
US Employment Cost Index: Lower than expected
Core PCE: Cooled off
Market Implication: Fed easing is now on the table.
DXY Weakens → Real yields drop → Gold gets bought like crazy.
👊 Institutional Logic:
Rate-sensitive assets (Gold, Bonds) exploded after the release.
Algorithmic reaction to macro signal: DXY down → XAU bid hard → MegaBar explosion.
BUT institutions needed liquidity to enter big → they faked a breakdown first.
That’s institutional deception 101.
📉 II. DAILY CHART ANALYSIS — THE BIG BOYS' GAMEBOARD
🗺️ Structure:
Price dropped from 3,355 to 3,258 in 3 days — a high-velocity markdown.
On July 30, Price printed a Megabar reversal (Massive range, delta-flush, volume spike).
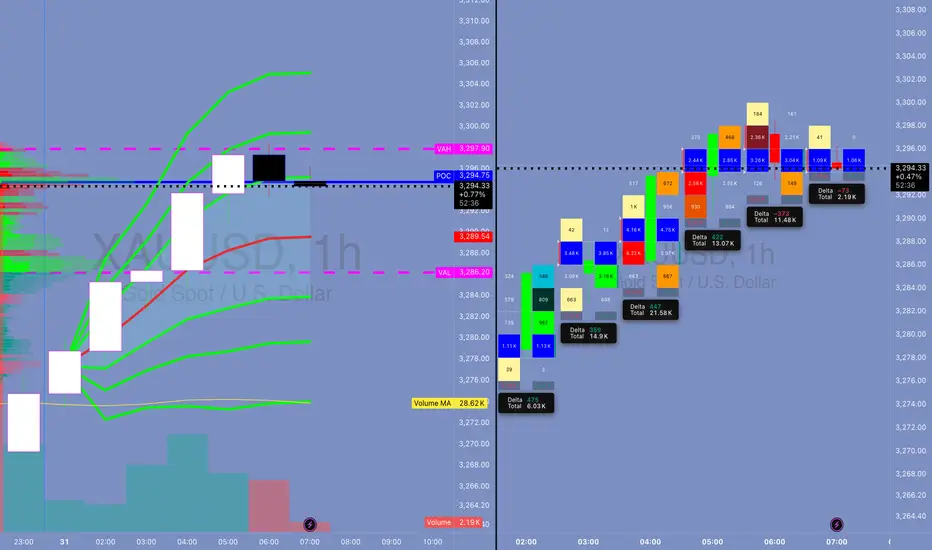
VAH = 3,294.90 capped upside.
POC = 3,288.91, and VAL = 3,282.90 held beautifully.
🔍 Institutional Pattern:
This is a classic “Flush > Absorb > Mark-up” sequence.
Textbook from “Technical Analysis and Stock Market Profits”:
“Volume confirms intention, range confirms commitment. A wide bar with climax volume at low implies the exhaustion of sellers and transfer of ownership.”
🔑 Key Daily Stats:
📉 Delta Flush: -584K
🔁 Reversal Delta: +70K
🔊 Volume spike: >450K (Well above 30-day volume MA)
💡 Inference:
This bar did not print because of retail buying. It’s smart money rebuying from panic sellers.
⏱️ III. 4H / 1H TIMEFRAME: ORDERFLOW & REACCUMULATION
📌 4H Chart:
📍 Megabar with -191K delta near 3,258 (Volume: 191.14K)
Immediate absorption by dark blue and green delta bars — this was not retail reversal.
VWAP reversion in play — price gravitates toward 3,294 (VWAP anchor zone)
🔁 1H Chart:
Rapid stair-stepping: Each hourly candle had higher lows and strong deltas.
Volume built from super-POC 3,289 to super-VWAP 3,295.25.
Final hour: exhaustion wick → distribution into resistance.
🧠 Institutional Tactic:
They used Volume by Price congestion to hold price between FVRP bounds:
Low Volume Nodes (LVNs) = acceleration zones
High Volume Nodes (HVNs) = consolidation + absorption zones
🔍 IV. 15M / MICROSTRUCTURE — WHERE THE GAME WAS REALLY PLAYED
🔬 VWAP Stack Analysis:
VWAP: 3,294.61
D-VWAP: 3,289.30
Super-VWAP Cluster held price in check — real institutional price magnet.
🔄 Delta Flow (15m):
Delta climbed from -3.15K → +3.21K in 1.5 hours.
Imbalance flipped bullish near POC.
🎯 FPVR Mapping (Volume Profile Right Side):
Thickest distribution volume occurred at 3,287 – 3,295
Value tightly packed = fair price.
Institutions are loading in value, not chasing.
⚙️ V. INDICATOR & MOMENTUM SIGNALS — INSTITUTIONAL CONFLUENCE ZONES
Tool Signal
VWAP Anchored VWAP tagged and respected — classic institution level
SMA50 Capped daily move (3,342) — still a long-term bearish lid
HMA5/9 Bullish crossover on 15m/1H – signals momentum alignment
Volume MA Volume climax confirms effort at lows, signaling phase change
🔩 VI. TECHNICAL SEQUENCING OF EVENTS (STEP BY STEP)
Asia Session: Tight range, price floats around VAL (3,282)
London Session: Fake breakdown to 3,258 – traps late shorts
NY Pre-News: Choppy price action within FRVP range
Macro News Drop: Megabar → -191K delta flush
Next Candle: Delta flips +21.2K → Absorption confirmed
Price Walks Up: Controlled bid to VWAP
End of Day: Distribution at VAH → price capped by VWAP band
💣 Final move = algorithmic mean reversion + VWAP auction completion
🧬 VII. ADVANCED ORDERFLOW INTERPRETATION
⚔️ MEGABAR (The Trap Setup):
Volume = 191K+
Delta = -191K (yep, full-on flush)
What happened?
→ Late shorts + stop runs + SL hunters got rekt.
→ Institutions absorbed, switched algo, and reversed.
🧱 FVRP (Fair Value Range Profile):
Defined by VAL (3,282.90) and VAH (3,294.90)
Institutions play inside this range for risk efficiency
They accumulate low and distribute high within it
🔄 Delta Rotation:
Delta Rotation = Shift from Negative Accumulation → Positive Distribution
Classic rotation confirms phase transition
🧠 VIII. INSTITUTIONAL OBJECTIVE (WHAT THEY WANTED)
Primary Goal: Create liquidity void below → Enter large long positions
Secondary Goal: Return to VWAP zone and unload
Tertiary Goal: Signal to market: "We're in control, stay out or get punished"
This is textbook Volume Profile Auction Theory in motion.
🎯 IX. HYPOTHETICAL TRADE SETUP (EDUCATIONAL PURPOSE ONLY)
🧾 Trade Plan: Institutional VWAP Reversion Play
Order Type: Buy Limit
Entry: 3,287.00
Stop Loss: 3,279.00 (below VAL & invalidation)
Take Profit: 3,300.00 (Super-VAH zone)
Confidence: 85%
R/R: 1:1.6
💡 Justification:
Entry at POC + SMA50 cluster
Stop below structural invalidation zone
Target near major supply
This is the exact playbooks funds run during reaccumulation rotations
🧠 X. EDUCATIONAL TAKEAWAY — WHAT YOU SHOULD LEARN
Volume is truth. If volume spikes at lows, it’s not weak hands — it’s smart money flipping.
VWAP is magnet. Everything mean-reverts back to VWAP in controlled auctions.
Delta tracks aggression. Sharp delta reversals = algorithm switch.
Megabar = signal. Huge candle + volume + delta = possible phase shift.
FRVP = roadmap. Price doesn’t move randomly — it moves to balance imbalances.
🔚 CONCLUSION — YESTERDAY’S LESSON
July 30, 2025 wasn’t just a bullish day — it was a textbook institutional deception-reversion cycle. If you understand:
How the news was used
How the megabar printed
How the volume clustered
How the VWAP held
… then you’re not trading blindly.
You’re trading with the damn architects of the market.
Has gold bottomed out on July 30?
Key Influencing Factors
Negative Factors:
A stronger US dollar: A rebound in the US dollar index is suppressing gold prices.
Recovering risk appetite: Market demand for safe-haven assets is weakening.
Rising real interest rates: Expectations of Fed policy are impacting the cost of holding gold.
US-EU trade agreement: Easing geopolitical tensions will weaken gold's safe-haven appeal.
Potentially bullish variables:
Federal Reserve policy signals: A dovish statement on Wednesday could boost gold prices.
Geopolitical risks: Uncertainties such as the Sino-US trade negotiations and the situation in the Middle East remain.
Technical Analysis
Trend Analysis:
Short-term weakness (four consecutive negative daily candlestick patterns), but the broader bullish trend remains.
Key support level: 3300-3285 (falling below or falling to 3250); resistance level: 3330-3345 (breaking through may end the pullback).
Key Levels:
Downward Support: 3310-3300 (short-term), 3285 (strong support). Upper resistance: 3335-3345 (trend reversal expected after a breakout).
Trading Strategy
Short-term Trading:
Long positions primarily at low levels: Try a light buy position in the 3300-3310 area, with a stop-loss below 3285 and a target of 3330-3345.
Short selling at high levels is auxiliary: If it rebounds to 3335-3345 and is under pressure, you can short sell with a stop loss above 3350 and a target of 3310-3300.
Follow up on the breakout: If it breaks through 3345 strongly, you can chase long positions; if it falls below 3285, be wary of a rebound after a false break.
Medium- to Long-term Strategy:
Watch for potential bottoming opportunities near 3285. If it stabilizes, place long positions in batches, betting on dovish signals from the Federal Reserve or escalating geopolitical risks.
Risk Warning: Data-sensitive period: This week's Federal Reserve decision and economic data may trigger significant volatility, so position management is crucial. US Dollar Trends: The US dollar and gold prices show a significant negative correlation, so the US Dollar Index should be monitored closely.
Risk of false break: There may be a trap below 3300, which needs to be confirmed in combination with the K-line pattern.
Summary: Gold is under short-term pressure, but the medium- to long-term bullish outlook remains unchanged. Focus on the effectiveness of support in the 3300-3285 area and the direction of the Federal Reserve's policy. We recommend a flexible approach, using key breakthroughs as a guide for directional analysis, and cautiously holding positions before data releases.

Gold long from 3242LOOKING FOR LONGS AT AROUND THAT REGION.
gold looks good .
Lets wait for this to unfold.
Gold holds Bearish Structure- SELLGold: Price is Exhibiting Head & Shoulders Strcure on 4H & 1 H chart. 4 H chart is Bearish, Daily chart is Neutral to bearish. Price is under the IChimuku Cloud in 4 H.
Daily chart is forming a death cross (20 SMA cutting 50 SMA) which might be completed in 1 day or Two.
Currently Gold is trying to recover losses and on retracement journey. I am expecting Price to test the 3347-3354 Zone of resistance where 4H 200+100 SMA + TL resistances+ Structure resistance will likely to Push price back to 3320 & 3300 Support Zone.
If price breaks the 3300 level. Then this daily candle break may take price to 3280 Support Level.
Good Luck

maintain selling pressure around 3300, GOLD ⭐️GOLDEN INFORMATION:
Gold prices extended their slide for a fourth straight session, falling over 0.60%, as the U.S. and European Union reached a weekend trade agreement that halved proposed tariffs on EU goods—from 30% to 15%. XAU/USD is currently trading around $3,312, after earlier touching a high of $3,345.
The trade breakthrough lifted market sentiment, boosting risk appetite. Meanwhile, the U.S. Dollar is regaining strength, with the Dollar Index (DXY)—which measures the greenback against a basket of six major currencies—rising 0.99% to 98.64.
⭐️Personal comments NOVA:
Gold price maintains selling pressure around 3300, continuing the downtrend
⭐️SET UP GOLD PRICE:
🔥SELL GOLD zone: 3353- 3355 SL 3360
TP1: $3345
TP2: $3332
TP3: $3317
🔥BUY GOLD zone: $3287-$3285 SL $3280
TP1: $3295
TP2: $3307
TP3: $3320
⭐️Technical analysis:
Based on technical indicators EMA 34, EMA89 and support resistance areas to set up a reasonable SELL order.
⭐️NOTE:
Note: Nova wishes traders to manage their capital well
- take the number of lots that match your capital
- Takeprofit equal to 4-6% of capital account
- Stoplose equal to 2-3% of capital account
XAU/USD – Bearish Momentum Building: Circle 2 Top In?OANDA:XAUUSD
We have now completed a 1-2-3-4-5 structure to the downside (in white).
Following that, we got a counter-correction in the form of an A-B-C, which potentially marks the completion of our yellow (Circle) Wave 2 🟡.
However, it’s not confirmed just yet — we still have two additional Fibonacci levels at 3400 and 3418, which could act as resistance zones and final topping areas for Circle 2.
We are now anticipating a 1-2-3-4-5 impulse into Circle 3, as already illustrated in yellow 🟡.
So at the moment, bias remains bearish 🔻.
Should we break above the Fibonacci levels mentioned, I do have an alternative scenario in mind — an ABCDE triangle formation that may have developed over the past months.
If that becomes relevant, I’ll make a separate upload for it 📌.
For now, I'm actively looking for sell positions, and I’ve already entered shorts ✅.

Gold - Breakout and retest of a bullish FlagBullish flag break out and price is in a demand zone. As long as the demand holds, pressure will be to the upside.

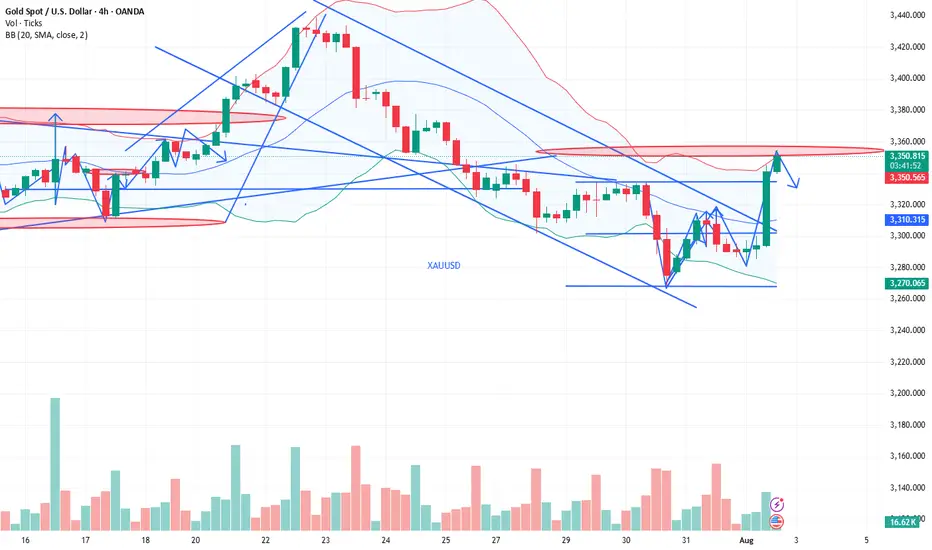
Gold Spot / U.S. Dollar (XAU/USD) - 4 Hour Chart (OANDA)4-hour chart from OANDA shows the recent price movement of Gold Spot (XAU/USD), currently at $3,353.240, down $20.395 (-0.60%). The chart highlights a sell price of $3,353.010 and a buy price of $3,353.450, with a shaded area indicating a support/resistance zone around $3,351.426 to $3,353.240. The data reflects trading activity from July to early September 2025.

XAUUSD Analysis todayHello traders, this is a complete multiple timeframe analysis of this pair. We see could find significant trading opportunities as per analysis upon price action confirmation we may take this trade. Smash the like button if you find value in this analysis and drop a comment if you have any questions or let me know which pair to cover in my next analysis.

#XAUUSD chartGold (XAUUSD) is approaching a critical reversal resistance zone between $3,377–$3,398, after ranging between $3,338–$3,377. This level deserves close attention, as price could react sharply here.
We also have a strong FVG gap nearby, increasing the potential for a solid bounce and a profitable trade.
😵 The Strategy:
This is a moment for patience and precision. If confirmed, this setup could lead to a solid opportunity — but only with the right timing and discipline.

GOLD overheated, fall for the next two to three daysConsidering the following:
1. RSI @ 86
2. constitutional money kicked in crossing upper linear regression
3. price reached the resistance level
4. AND although the last candle was longer than the second last candle, the last volume was shorter than the second last volume line. (crucial for a reversal)
Will place order for a short @ USD3360, take 50% profit at USD3326, close @ USD3280.
Happy trading!

Gold ready to create new all time high!!!Buy: $3447.28
Set up: wait for a breakout and hidden bullish divergence on a weekly basis.
Sl: $3183.11

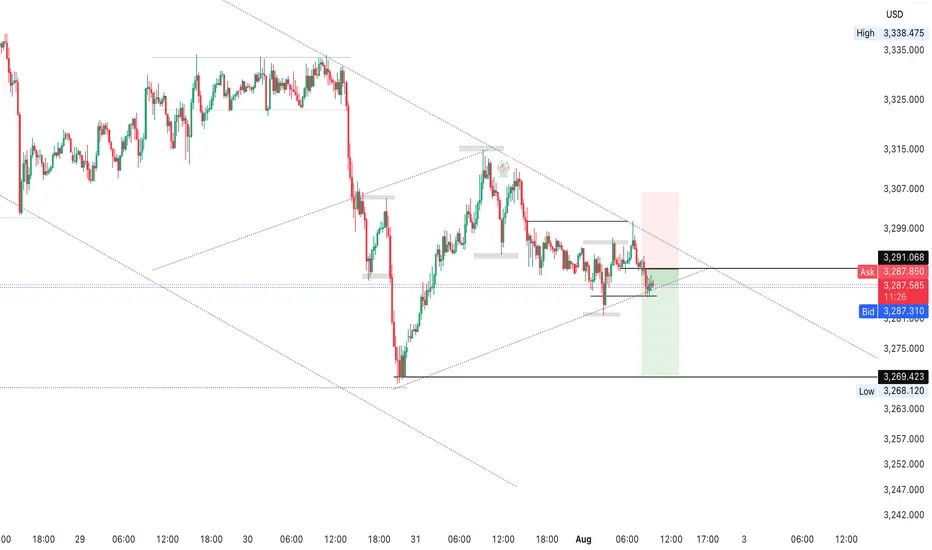
Gold Market Holds Bearish Structure Below 3291Gold market continues to hold firm within the bearish channel, with 3291 acting as a supply zone, maintaining pressure down toward 3269. As long as this zone remains unbroken, bearish momentum stays in play.
🔍 Key Insight:
3291 = active supply resistance
3269 = short-term target if sentiment holds
follow for more insights , comment and boost idea
NFP GOLD watch me break gold down give my thoughts on gold during NFP and what you should expect moving forward

XAUUSD: Buy ideaBuy idea on XAUUSD as you can see on the chart because we have the breakout with force the vwap indicator by a big green candle...
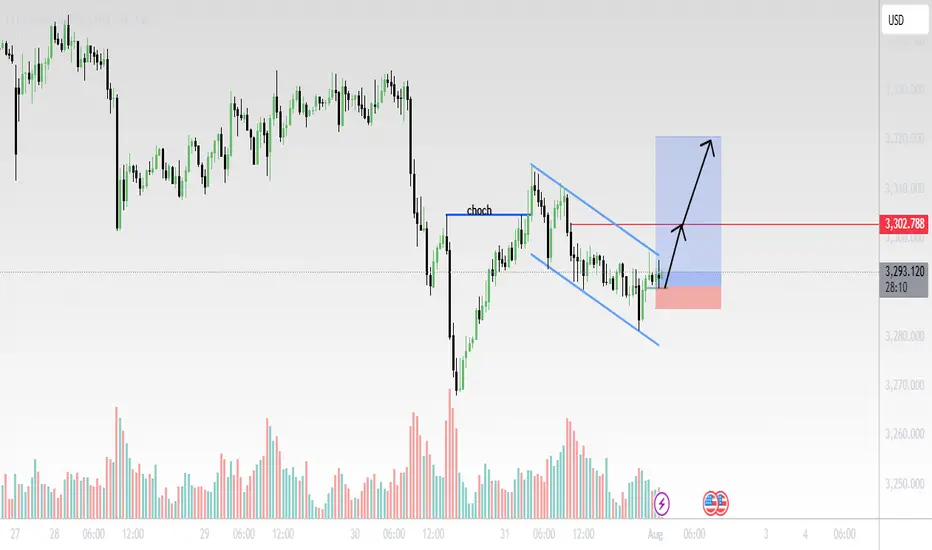
Gold (XAU/USD) 30-Min Chart Analysis – August 1, 2025Structure Summary:
CHoCH (Change of Character) confirmed after price broke the previous lower high, signaling a potential trend reversal.
Price has since formed a bullish falling wedge (blue trendlines), a classic continuation pattern after CHoCH.
Volume spikes during reversal attempts suggest accumulation.
Trade Setup:
Entry: Breakout above wedge resistance.
Stop Loss: Below recent swing low near 3280 area (red zone).
Target: Around 3315–3320 zone (blue box), aligned with previous demand-turned-supply area.
📌 Outlook:
Bullish breakout expected if momentum sustains.
Watch for confirmation candle with volume above the wedge.
Clean R:R setup with tight SL and wide TP potential.
📊 Technical Bias: Bullish
❗Risk Management: Adjust position size based on lot exposure and account size.
gold on buy retrace#XAUUSD price have reformed back above 3306, now we are expecting bullish from 3309 on 2 times breakout.
Entry 3309 2 times breakout, target 3326-3335, SL 3297.
Below 3297 holds bearish reversal, target 3270. 3317 will reject, H1 closure there will continue bullish.

Xauusd sell ideas Let's see how this goes on news release am expecting a retest of that zone as well entry