Only by understanding the trend can you be firmly bullish.The market is changing rapidly, and going with the flow is the best way to go. When the trend comes, just go for it. Don't buy at the bottom against the trend, so as not to suffer. Remember not to act on impulse when trading. The market is good at dealing with all kinds of dissatisfaction, so you must not hold on to orders. I believe many people have experienced this. The more you resist, the more panic you will feel, and the floating losses will continue to magnify. You will not be able to eat or sleep well, and you will miss many opportunities in vain. If you also have these troubles, then you might as well follow Tian Haoyang's rhythm and try to see if it can make you suddenly enlightened. If you need help, I will always be here, but if you don't even extend your hand, how can I help you?
Gold rose unilaterally after the positive non-farm payrolls on Friday, hitting a new high this week. This week's K-line closed in a hammer shape, and the gold hourly line has a double bottom structure. However, gold should not have such a big retracement for the time being. The 3335-3330 line below is also an important support. So gold will mainly be bought on dips above 3335-3330 next week. Technically, there is still room for growth next week. The bulls continued to attack at the end of Friday and closed at 3363. Next week, we will continue to pay attention to the short-term suppression at the 3370-3375 line above. In terms of operations, we will continue to maintain retracement and buy. If your current operation is not ideal, I hope I can help you avoid detours in your investment. Welcome to communicate and exchange. Judging from the current gold trend, the short-term resistance above next week will be around 3370-3375, with a focus on the important pressure line of 3395-3400. Keep buying on pullbacks, and try to maintain a stable wait-and-see position in the middle. I will prompt the specific operation strategy at the bottom, so please pay attention in time.
Gold operation strategy: Go long on gold when it retraces to around 3340-3330, target 3370-3375, and continue to hold if it breaks through.
GOLD trade ideas

Gold continue to rise rapidly?Hello everyone! Let’s dive into what’s been happening with XAUUSD lately.
Last week, gold delivered a stunning reversal - plunging sharply and then surging nearly 800 pips within just a few sessions. This rapid shift was largely triggered by key remarks from the Federal Reserve Chair and several important economic data releases.
Specifically, weaker-than-expected US employment data has fueled growing expectations that the Fed could begin easing monetary policy sooner than anticipated. At the same time, a global financial survey shows that analyst sentiment toward gold is at its highest in months. In the face of persistent global uncertainty, gold is once again attracting strong safe-haven demand.
Despite the impressive rally, volatility remains high. The next moves in gold will likely hinge on upcoming economic indicators and further statements from Fed officials. Meanwhile, the holiday calendar may lead to quieter trading sessions ahead.
From a technical perspective, gold has broken out of its previous downtrend channel and is moving quickly. According to Dow Theory, a short-term correction may occur, but as long as price holds above key support levels, the bullish momentum could extend toward $3,416 — the 1.618 Fibonacci extension.
This breakout could mark the beginning of a new bullish phase after weeks of consolidation.
What do you think – is this just the start of something bigger for gold?

Market Analysis: Gold Prices Ease – Market Awaits Fresh CatalystMarket Analysis: Gold Prices Ease – Market Awaits Fresh Catalyst
Gold price started a fresh decline below $3,380.
Important Takeaways for Gold Price Analysis Today
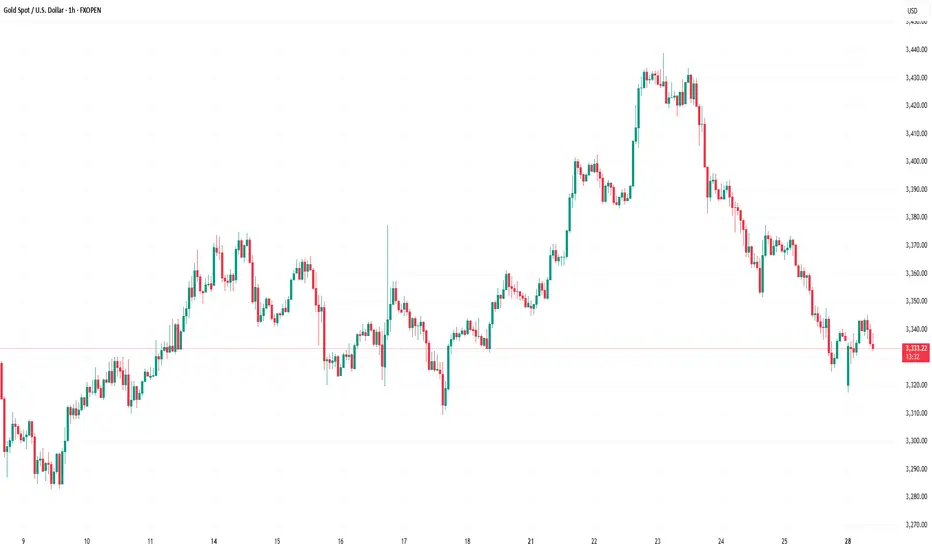
- Gold price climbed higher toward the $3,430 zone before there was a sharp decline against the US Dollar.
- A key bearish trend line is forming with resistance near $3,350 on the hourly chart of gold at FXOpen.
Gold Price Technical Analysis
On the hourly chart of gold at FXOpen, the price climbed above the $3,380 resistance. The price even spiked above $3,400 before the bears appeared.
A high was formed near $3,432 before there was a fresh decline. There was a move below the $3,380 support level. The bears even pushed the price below the $3,350 support and the 50-hour simple moving average.
It tested the $3,325 zone. A low was formed near $3,325 and the price is now showing bearish signs. There was a minor recovery wave towards the 23.6% Fib retracement level of the downward move from the $3,433 swing high to the $3,325 low.
However, the bears are active below $3,342. Immediate resistance is near $3,350. There is also a key bearish trend line forming with resistance near $3,350.
The next major resistance is near the $3,380 zone. It is close to the 50% Fib retracement level of the downward move from the $3,433 swing high to the $3,325 low. The main resistance could be $3,410, above which the price could test $3,432. The next major resistance is $3,450.
An upside break above $3,450 could send the gold price towards $3,465. Any more gains may perhaps set the pace for an increase toward the $3,480 level.
Initial support on the downside is near the $3,325 level. The first major support is near the $3,310 level. If there is a downside break below it, the price might decline further. In the stated case, the price might drop towards the $3,265 support.
This article represents the opinion of the Companies operating under the FXOpen brand only. It is not to be construed as an offer, solicitation, or recommendation with respect to products and services provided by the Companies operating under the FXOpen brand, nor is it to be considered financial advice.
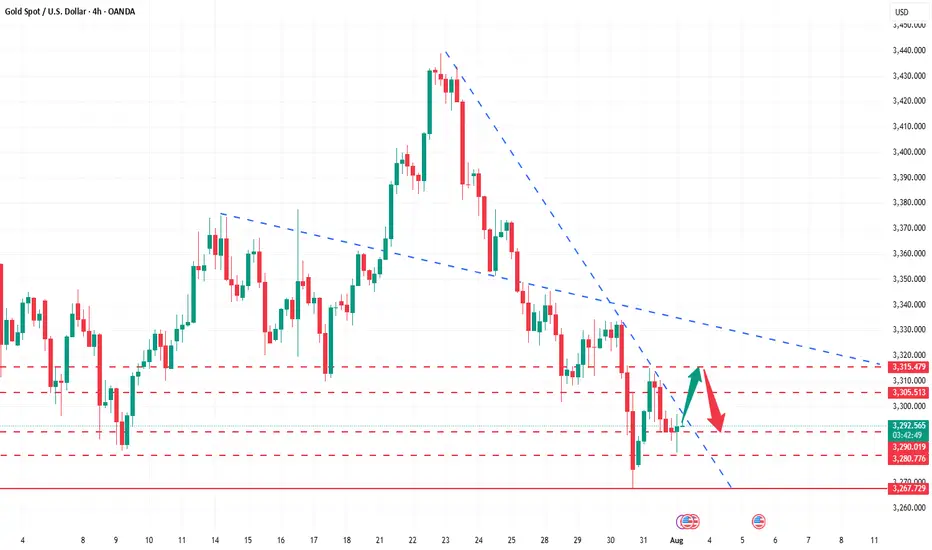
Gold short opportunityGold completed its mini bull flag target and re-entered a micro rising channel, a potentially bearish structure.
With price now testing a key supply zone, we’re watching for rejection to initiate a short, targeting the major demand zone below.

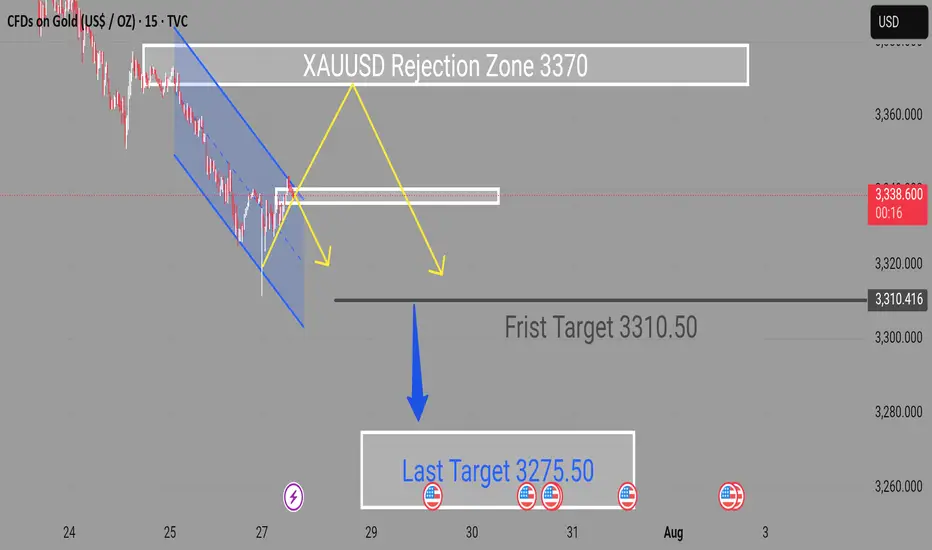
XAUUSD Selling Expecting Movement Buy Zone Activated after rejection from resistance
First Target 3310.50
Final Target 3275.50
The bullish breakout scenario remains valid as long as price holds above the lower channel boundary. A clean break and retest of the current structure could provide further confirmation for long entries.
Key Notes
Watch for volatility near marked U.S. data events
Maintain tight risk management and monitor for rejection candles near target zones
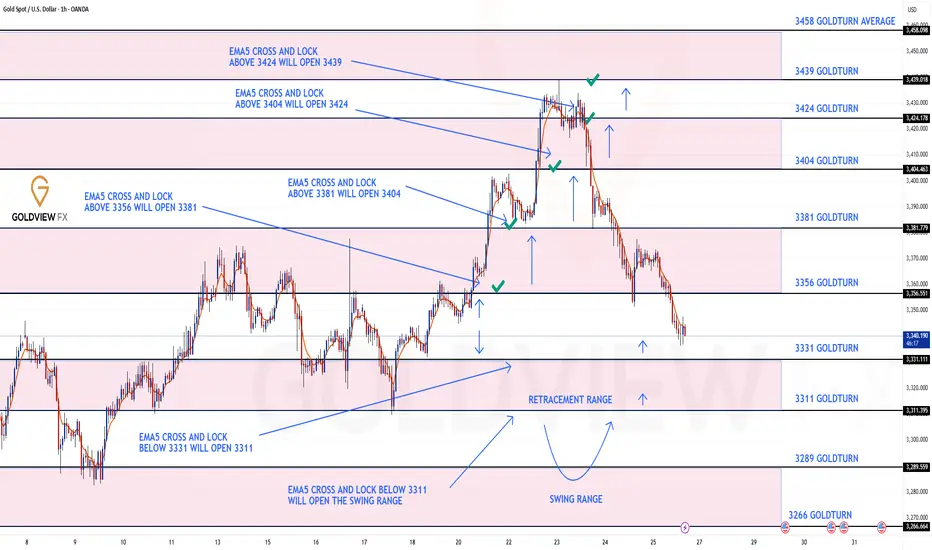
GOLD 1H CHART ROUTE MAP UPDATEHey Everyone,
Great finish to the week with our chart ideas playing out, as analysed.
We completed all our Bullish targets on this chart with ema5 cross and lock confirmation. We were also able to step away today after the final target with no further ema5 cross and lock, confirming the rejection that we are seeing now.
BULLISH TARGET
3356 - DONE
EMA5 CROSS AND LOCK ABOVE 3356 WILL OPEN THE FOLLOWING BULLISH TARGETS
3381 - DONE
EMA5 CROSS AND LOCK ABOVE 3381 WILL OPEN THE FOLLOWING BULLISH TARGET
3404 - DONE
EMA5 CROSS AND LOCK ABOVE 3404 WILL OPEN THE FOLLOWING BULLISH TARGET
3424 - DONE
EMA5 CROSS AND LOCK ABOVE 3424 WILL OPEN THE FOLLOWING BULLISH TARGET
3439 - DONE
We will now come back Sunday with a full multi timeframe analysis to prepare for next week’s setups, including updated views on the higher timeframes, EMA alignments, and structure expectations going forward.
Thanks again for all your likes, comments, and follows.
Wishing you all a fantastic weekend!!
Mr Gold
GoldViewFX
Gold - M30 Buy SetupOANDA:XAUUSD TVC:GOLD
Timeframe: m30
Risk Level: Low-Medium
🔹 Setup:
Price is testing the boundary of the ascending channel and retesting the support @ 3350
📈 Entry:
Current price zone: 3360-65
🎯 Targets (TP):
TP1: 3375
TP2: 3385
TP4: 3410
TP6: 3430
⛔ Stop Loss (SL):
3349
H4 Overview:
PEPPERSTONE:XAUUSD
#XAUUSD #GOLD #Buy #Signal #MJTrading
Psychology Always Matters:

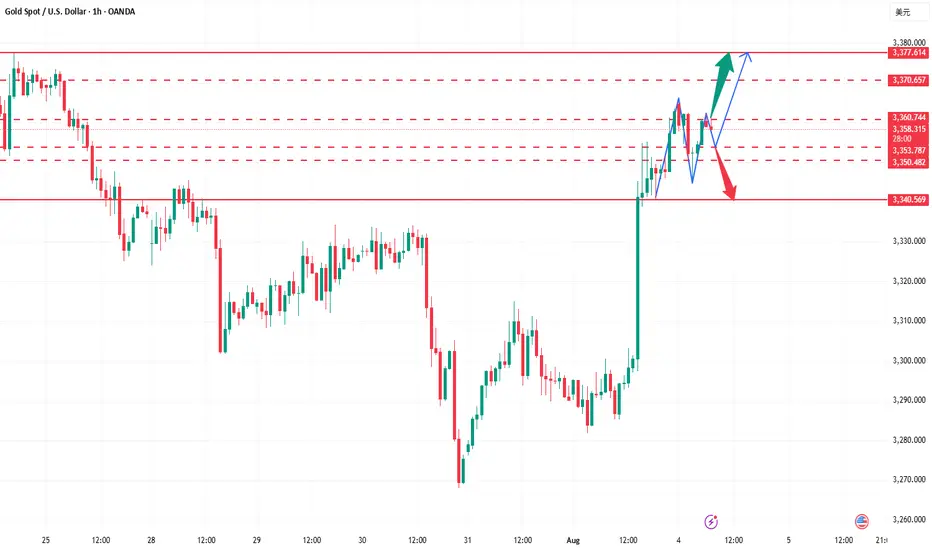
Gold Technical Analysis - Testing Key ResistanceGold has been showing a short-term bullish momentum after bouncing from the 3285 support zone, forming an ascending channel visible on the chart. The price is currently trading near 3361, close to the upper boundary of the channel and a key horizontal resistance level at 3365–3370. If the bullish momentum continues and price breaks above 3365–3370, we could see further upside toward 3396 and potentially 3400+. However, a failure to hold above this level could trigger a short-term retracement toward 3335–3325 support.
📈 Potential Scenarios:
- Bullish: If price sustains above $3,365, we could see an upside push toward $3,396 and possibly higher to $3,410 resistance.
- Bearish: A rejection near the channel top or $3,365 may lead to a pullback toward $3,325 (Fib 0.5) and then $3,285 support.
🔑 Key levels to watch:
- Upside: $3,365 → $3,396 → $3,410
- Downside: $3,335 → $3,325 → $3,285
- Trend Bias: Short-term bullish as long as price stays above 3325
Note
Please risk management in trading is a Key so use your money accordingly. If you like the idea then please like and boost. Thank you and Good Luck!

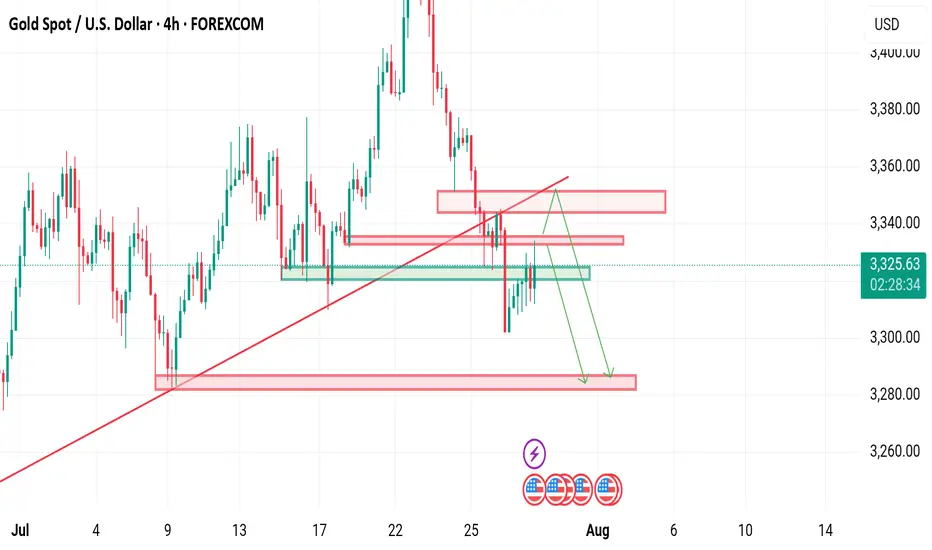
XAUUSD idea for upcoming weekThe chart presents a bearish outlook for gold based on a retracement and continuation pattern. Here's a detailed analysis:
🔍 Chart Summary:
Current Price: Around 3336
Bias: Bearish (after retracement)
Resistance Zone: 3370 – 3380
Sell Confirmation Area: Upon rejection from the 3370–3380 resistance zone
Target 1 (TP1): 3300
Target 2 (TP2): 3280
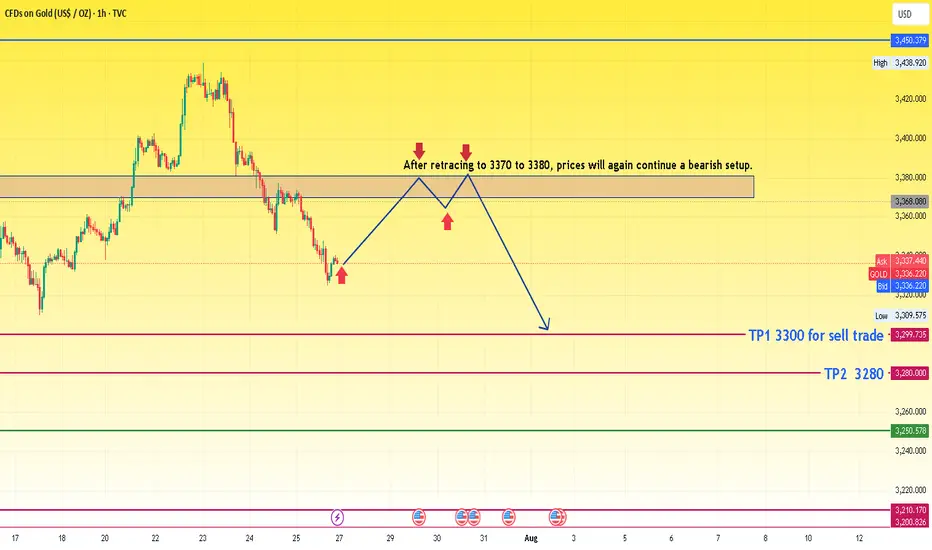
📈 Technical Structure:
Recent Trend:
The price has dropped sharply from its recent peak.
Now it's attempting a pullback to previous support, which has turned into a resistance zone (3370–3380).
Price Action Expectation:
A retracement is expected toward 3370–3380.
If the price gets rejected from this resistance block, the chart suggests the formation of a lower high.
After rejection, a bearish continuation is expected.
Projected Move:
Short entry around the resistance zone.
Targets:
TP1: 3300 (intermediate support)
TP2: 3280 (major support)
🧠 Trade Idea Logic:
The chart follows a classic bearish price action setup: impulse → retracement → continuation.
The consolidation and break area has flipped from support to resistance.
The retracement zone is clearly defined, making it a high-probability area for reversal if bearish signals (e.g., rejection candles) form.
⚠️ Key Considerations:
Wait for confirmation: Do not enter blindly at 3370–3380. Look for rejection patterns (like a bearish engulfing or pin bar).
Volume and fundamentals: Watch for economic data or geopolitical news that might invalidate the technical setup.
SL Suggestion: Above 3385 or 3390 to allow some room for wick spikes.
Weekly Trend Radar1. Macro Market Overview
Last week, the Federal Reserve kept interest rates unchanged, as widely expected. The decision was fully priced in, and the press conference offered no surprises: future rate cuts will depend on incoming economic data.
Markets initially reacted with a decline, but I do not see a structural break in the uptrend for commodities. It looks more like a healthy cooldown before the next leg higher .
However, the equity market is showing signs of deeper weakness . Historically, August tends to be a challenging month for stocks, and what we may be witnessing now is not a short-term correction but the early stages of a major downtrend.
Cryptocurrencies followed equities lower due to their high-beta, risk-on nature, but similar to metals, I believe the correction is temporary and the broader uptrend remains intact.
In energy markets, oil remains volatile — no clear setup for a long position yet. Natural gas has reached support and may offer a cautious long opportunity, though the medium-term trend is still bearish.
Overall, global markets are holding key levels, except for equities, which now look the weakest.
2. Metals
Buy the Dip!
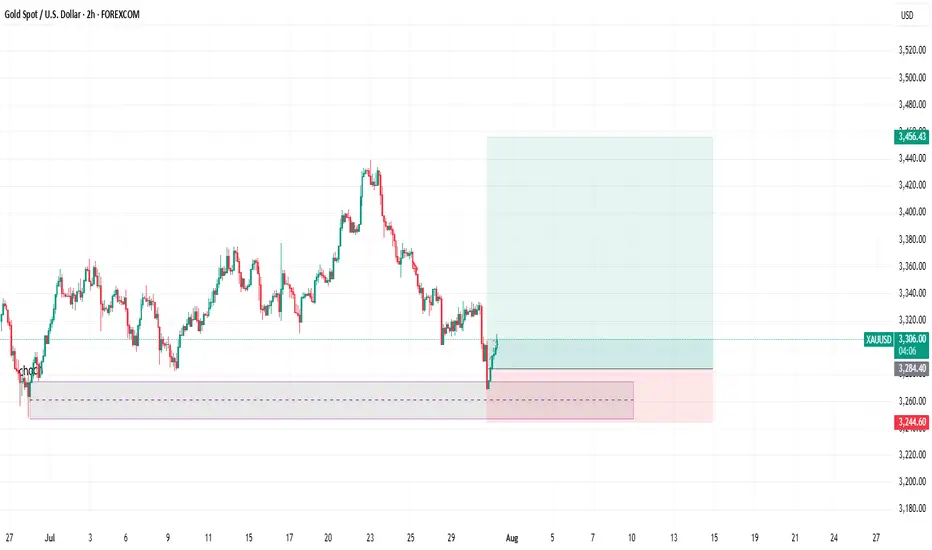
🥇Gold
Gold ended the week slightly higher — a strong performance considering the broader market weakness. Its resilience highlights its role as a safe-haven asset. The bullish trend remains intact, and institutional support appears to be holding.
Trend: Bullish
Key Levels: Support at 3245, resistance at 3450
Position: Looking for a long entry next week
🥈Silver
A more volatile asset compared to gold, silver has pulled back but remains within its bullish trend. Friday’s daily candle showed promise, bouncing from the 50-day moving average. Despite not closing above Thursday’s high, the setup is constructive.
Trend: Bullish
Key Levels: Support at 36.30, resistance at 38.00
Position: Long, stop below Friday’s low at 36.30. New entries still valid.
⚪️Platinum
Similar structure to silver. Friday’s reversal candle signals potential continuation of the bullish move.
Trend: Bullish
Key Levels: Support at 1280, resistance at 1480
Position: Long, with stop below Friday’s low. Valid setup for new positions.
🔘Palladium
Strong technical picture even without a test of the 50-day MA. Remember — these MAs are not entry signals, but trend indicators. Entry is based on confluence, not location alone. And it would be nice to finally see parity with platinum.
Trend: Bullish
Key Levels: Support at 1185, resistance at 1260, 1310, 1340, 1370
Position: Planning to enter long at Monday’s open if the market is supportive. No entry if risk-off sentiment dominates.
🟠Copper
Copper is one of the most compelling setups this week. After a sharp 25% decline, it remains in an overall uptrend. Friday’s bullish candle on the daily chart is promising. A potential new rally may start from here.
Trend: Bullish
Key Levels: Support at 4.35, resistance at 5.15
Position: Planning to enter at Monday’s open, stop below Friday’s low.
3. Energy Markets
🛢️Crude Oil
I'm leaning toward a long setup, but Friday’s red candle on the daily chart signals the need for caution. Waiting for a clear reversal candle before entry.
Trend: Bullish
Key Levels: Support at 68.30, resistance at 72.68, 75.00, 77.70
Position: Waiting for lower volatility and confirmation from daily chart structure.
🔥Natural Gas
The asset has reached a strong support zone. Daily candles are starting to form a potential bottoming pattern, but we need to break through resistance at 3.20 to gain confidence.
Trend: Bearish (medium-term)
Key Levels: Support at 3.00, resistance at 3.20, 3.35, 3.65
Position: Cautious long, small size. Stop-loss is wide, so risk management is key.
4. S&P 500
📉I believe we are entering a major downtrend in the stock market. This is not just a correction — it's likely the beginning of a more sustained decline. I’m shifting my bias to short.
Trend: Bearish
Key Levels: Support at 6150; resistance at 6430
Position: Waiting for short opportunity.
5. Bitcoin
₿Bitcoin followed the equity market lower. The trend is still technically bullish, but the recent risk-off tone in equities warrants caution. Crypto is not a defensive asset and tends to experience sharper drawdowns.
That said, I do not expect another prolonged "crypto winter." Institutional involvement has improved market depth and liquidity, reducing the severity of future crashes — though volatility will remain elevated.
Trend: Bullish
Key Levels: Support at 112.000; resistance at 117.000, 121.000, 123.300
Position: Long, stop below Friday’s low. Act with caution.

BUYS on XAUUSD 'Contextual Market Structure (30M)'
Past Trend:
Clear bearish structure with a descending channel and consistent LHs and LLs.
Price respected dynamic trendlines, forming confluences with supply zones.
Shift in Structure (Bullish Reversal):
Price broke out of the descending channel aggressively, due to the NFP news released on friday which was bad for USD
Candlestick Behavior
Breakout Candle: Large-bodied bullish engulfing — confirms buying pressure
Retest Wicks: Sharp rejection on wicks below HL (~$3,278) shows rejection of lower pricing
Continuation Candles: Series of higher closes, minimal upper wicks = strength
Formed HL → HH → HL → HH, confirming bullish structure.
Retest of broken structure + demand zone respected (confirmed by wick rejections and bullish engulfing candles).

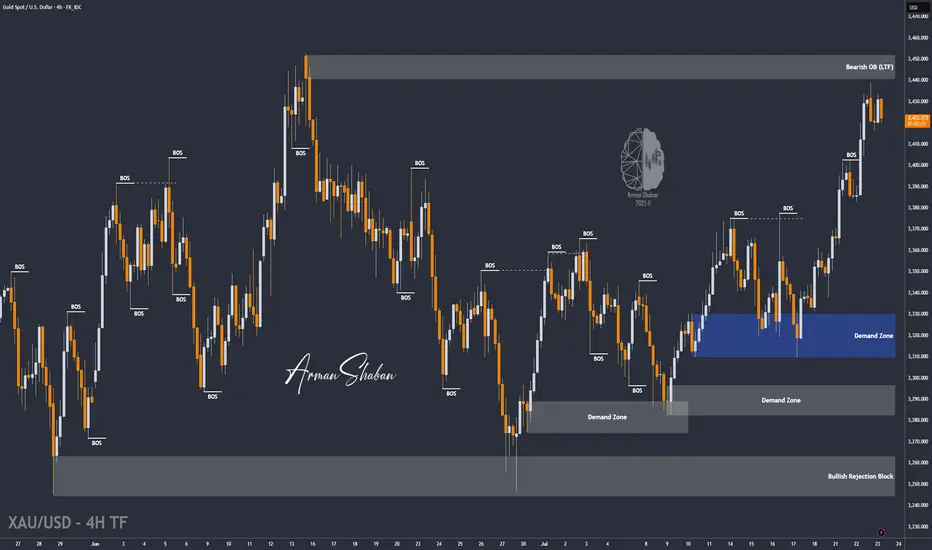
XAU/USD | Watching for Potential Drop Toward $3391! (READ)By analyzing the gold chart on the 4-hour timeframe, we can see that gold continued its bullish move after holding above $3409, successfully hitting the $3440 target and delivering over 200 pips in returns! After reaching this key supply zone, gold corrected down to $3415 and is now trading around $3421. If the price stabilizes below $3431, we can expect further downside movement, with the next bearish targets at $3415, $3404, and $3391. If this scenario fails, an alternative setup will be shared.
Please support me with your likes and comments to motivate me to share more analysis with you and share your opinion about the possible trend of this chart with me !
Best Regards , Arman Shaban
GOLD NEXT MOVE (expecting a mild bullish(24-07-2025)Go through the analysis carefully and do trade accordingly.
Anup 'BIAS for the day (24-07-2025)
Current price- 3357
"if Price stays above 3345, then next target is 3370, 3320 and 3400 and below that 3330 and 3310 ".
-POSSIBILITY-1
Wait (as geopolitical situation are worsening )
-POSSIBILITY-2
Wait (as geopolitical situation are worsening)
Best of luck
Never risk more than 1% of principal to follow any position.
Support us by liking and sharing the post.

Gold Crashes $100 After Hitting Monthly High | What’s Next?In this video, I break down everything that moved the price of gold last week, from the early-week rally toward $3,430 to the sharp midweek drop toward $3,325. We go beyond the surface, diving into what caused the reversal, and how I'm approaching next week’s market using a simple ascending channel on the 4-hour chart.
With major events like the FOMC rate decision, U.S. GDP, PCE inflation, NFP and the August 1 tariff deadline all on the radar, this analysis will help you stay grounded and prepare for volatility.
👉 If you find this content valuable, don’t forget to Boost, Comment, and Subscribe for weekly market breakdowns.
Disclaimer:
Based on experience and what I see on the charts, this is my take. It’s not financial advice—always do your research and consult a licensed advisor before trading.
#goldanalysis, #goldforecast, #xauusd, #goldpriceprediction, #technicalanalysis, #fundamentalanalysis, #tradingstrategy, #forextrader, #priceaction, #fomc, #usgdp, #pceinflation, #goldtrading, #forexeducation, #dollarvsgold, #tariffnews, #chartanalysis, #forexmentorship, #rebuildingthetraderwithin

How to correctly grasp the gold trading opportunities?Yesterday, gold prices saw a technical rally amidst volatile trading, followed by a downward trend under pressure. Bulls strongly supported a rebound at 3280 in the Asian session. The European session saw an accelerated upward move, breaking through 3314 before retreating under pressure. We also precisely positioned short positions below 3315, achieving a perfect target of 3290-3295. During the US session, the market again faced pressure at 3311, weakening in a volatile trend before breaking through 3300. The daily chart ultimately closed with a medium-sized bullish candlestick pattern, followed by a pullback and then a decline.
Overall, after yesterday's rebound, gold prices remain under pressure at the key resistance level of 3314. The short-term bearish weakness line has moved down to this level. If pressure continues in this area in the short term, gold will maintain a weak and volatile structure, with intraday trading remaining focused on rebounds and upward moves. If you are currently experiencing confusion or unsatisfactory trading strategies, please feel free to discuss your options and help avoid investment pitfalls.
From a 4-hour analysis perspective, focus on resistance at 3305-3315 on the upside. A rebound to this level is a good opportunity to short against resistance. Focus on support at 3280-3270 on the downside. Unless the price stabilizes strongly, consider not entering long positions below this level. The overall strategy remains to short on rebounds, with the same rhythm. I will provide timely notifications of specific levels from the bottom, so keep an eye on them.
Gold Trading Strategy: Short on rebounds near 3305-3315, with targets at 3290-3280-3270.
XAUUSD ShortElite analysis - NEWS TRADE
Executed of a 3m OB
Targeting lower LPs
Price is reacting at New Event of this OB.
Gold Price Update – Bearish Flag Signals Possible Drop AheadGold is currently trading around $3,324, showing consolidation after a recent decline from the $3,345 region. The chart shows a bearish flag pattern forming after the sharp drop, indicating potential continuation of the downtrend. If gold fails to break above this region, sellers may push the price lower towards $3,301 and possibly $3,275.
The descending trend line adds further bearish pressure, limiting upside momentum unless gold decisively breaks and holds above $3,345. Overall, gold remains under short-term bearish sentiment, with the focus on support retests. Any bullish momentum will only be confirmed if the price closes above the flag and trendline resistance.
Key Points
Resistance Zones: $3,328 (0.618 Fib), $3,345 (flag top).
Support Zones: $3,301 (Fib base), $3,284, and $3,275 (bearish extension).
Trend Outlook: Short-term bearish unless price breaks above $3,345 with volume.
Bearish Targets: $3,301 → $3,284 → $3,275.
Bullish Invalidations: Break and close above $3,345 may shift bias to bullish.
Note
Please risk management in trading is a Key so use your money accordingly. If you like the idea then please like and boost. Thank you and Good Luck!

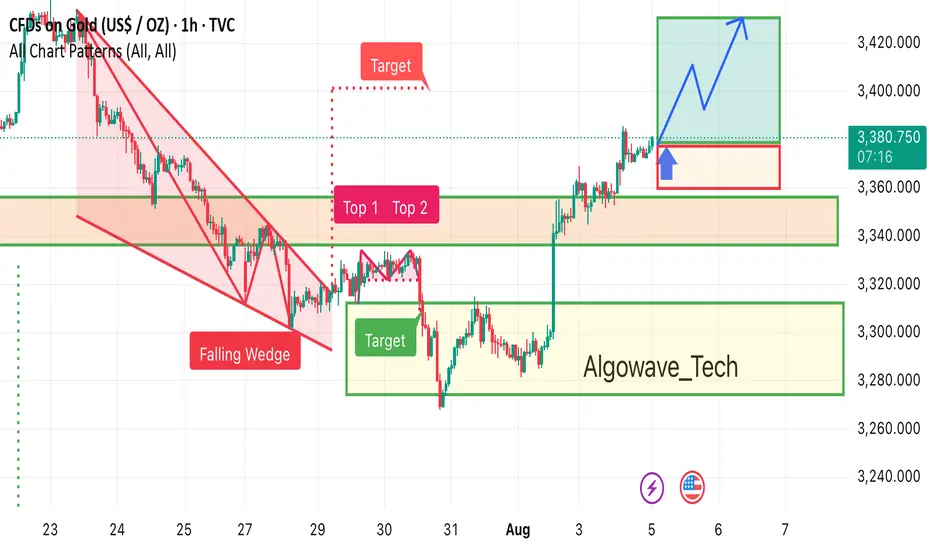
Gold 1h chart pattern Gold has broken out of the falling wedge pattern, showing strong bullish momentum. If price holds above the highlighted support zone, the next potential upside target lies in the 3,425 area. Watching for a healthy retest before continuation.
As the bull market continues, is gold poised to hit new highs?Judging from the current gold trend, the technical side opened high and closed low, releasing the demand for short-term adjustments. The intraday low hit 3344 and then rebounded, which is enough to reflect the resilience of the bulls. The hourly doji continued to rise, and the 3353 line was pulled up again. It is expected that it will be difficult to give an entry opportunity near 3340-3345 again. Since the new high has been refreshed again, the technical short-term adjustment may have ended. With the current strong bull structure, further testing the 3370-3380 area is a high probability event. If it unexpectedly falls below 3340 in the future, the bulls will no longer defend strongly, and the market may turn to volatility. Breaking below 3340 is also expected to open up short-term short space, but this is a later story. The current market structure is clear, and we continue to see a strong upward trend for the bulls. At least at the beginning of the week, I do not think the bull market is nearing its end.
Gold operation suggestion: go long around 3360-3355, target 3370-3380.Strictly set stop loss and control your position.
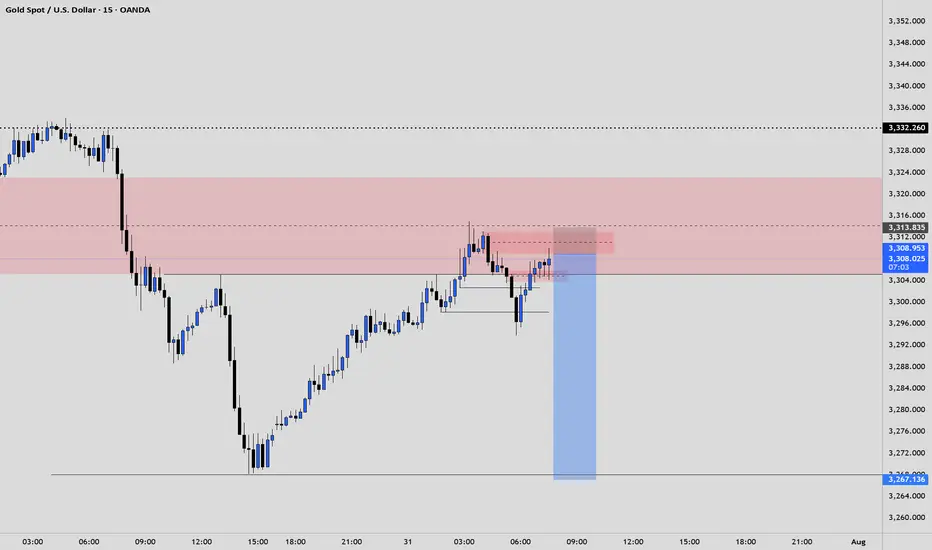
XAUUSD bullish reversal from a demand zoneThe setup also aligns with a liquidity sweep below previous lows, which could trigger a reversal. Price is now breaking minor resistance levels, creating early confirmation for bullish momentum.
XAUUSD is still bearish Gold is currently below rising channel and holding the Range of 3320-3335,although yesterday implusive drop is incompleted without testing 3290-3280
What's possible scanarios we have?
▪️I'm still on bearish side till 3345 is invalidated and candle flips above. I open sell trades at 3332 again and holds it .
if H4 & H1 candle close above 3345 I will not hold or renter sell.
▪️Secondly if H4 candle closing above 3345 this down move will be invalid and Price-action will reached 3370.
Monday's market forecast and related layout#XAUUSD
Judging from the monthly chart, although July closed with a large positive line, there is still great resistance above 3439-3501. Possible gold price trends for next week are as follows:
1. If gold prices open higher, focus on the previous highs of 3375-3385. If resistance and pressure are encountered, consider shorting, aiming for a volatile decline, retracing Friday's gains.
2. The market is volatile and sideways, so wait and see.
3. Gold fell back. Referring to Friday’s trading strategy, you can consider going long around 3335 to bet on a short-term rebound. Leave yourself some room for participation (the possibility of touching 3338 again and rebounding is not ruled out)

