Gold deeper consolidation supported at 3266The Gold remains in a bullish trend, with recent price action showing signs of a continuation breakout within the broader uptrend.
Support Zone: 3266 – a key level from previous consolidation. Price is currently testing or approaching this level.
A bullish rebound from 3266 would confirm ongoing upside momentum, with potential targets at:
3335 – initial resistance
3351 – psychological and structural level
3366 – extended resistance on the longer-term chart
Bearish Scenario:
A confirmed break and daily close below 3308 would weaken the bullish outlook and suggest deeper downside risk toward:
3250 – minor support
3230 – stronger support and potential demand zone
Outlook:
Bullish bias remains intact while the Gold holds above 3266. A sustained break below this level could shift momentum to the downside in the short term.
This communication is for informational purposes only and should not be viewed as any form of recommendation as to a particular course of action or as investment advice. It is not intended as an offer or solicitation for the purchase or sale of any financial instrument or as an official confirmation of any transaction. Opinions, estimates and assumptions expressed herein are made as of the date of this communication and are subject to change without notice. This communication has been prepared based upon information, including market prices, data and other information, believed to be reliable; however, Trade Nation does not warrant its completeness or accuracy. All market prices and market data contained in or attached to this communication are indicative and subject to change without notice.
GOLD trade ideas

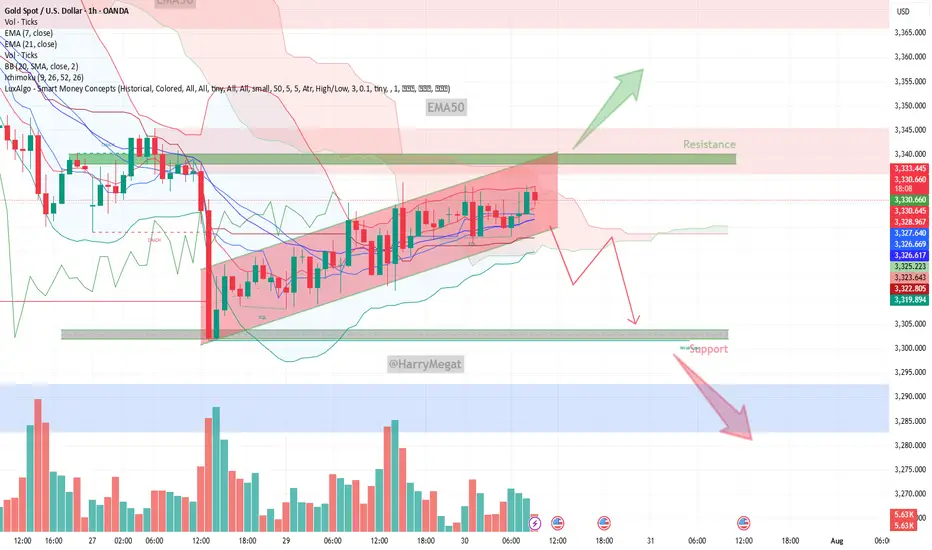
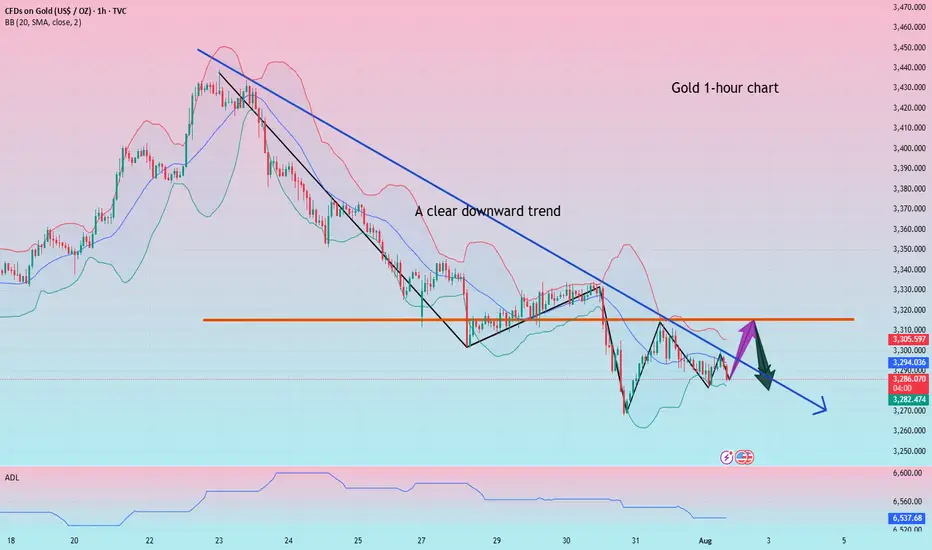
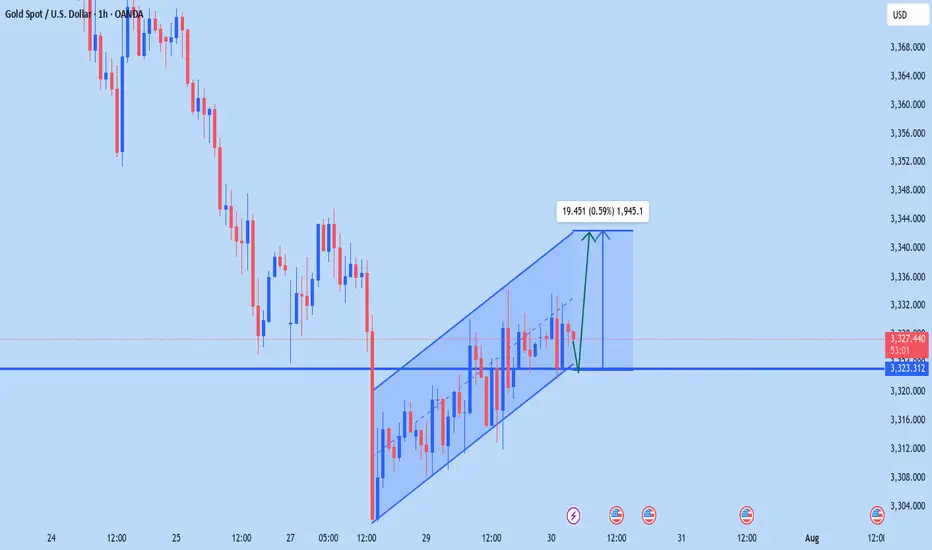
Gold (XAU/USD) on the 1‑hour timeframeGold (XAU/USD) on the 1‑hour timeframe
Chart Structure & Bias
* Price remains trapped in a **rising channel** (\~\$3,328–3,333), pressing against resistance near **\$3,340–3,345**.
* Short-term momentum is bearish: both EMA 7 and EMA 21 sit above current price, with declining volume signaling weakening buyer strength.
* Overall trend leans neutral‑to‑bearish until market clears key zones decisively.
Trade Scenarios
**Bearish Breakdown (Preferred)**
* **Trigger:** Break and close below channel support (\~\$3,326).
* **Targets:** Initial drop toward **\$3,320**, then **\$3,300**, and possibly lower if momentum intensifies.
* **Invalidation:** Price pushes back above **\$3,333–3,335**, negating bearish structure.
**Bullish Breakout (Conditional)**
* **Trigger:** Clean breakout and sustained close above **\$3,342–3,345**.
* **Targets:** Upward stretch toward **\$3,355–3,360**, and if strong, **\$3,367–3,375+**.
* **Invalidation:** Fails to hold structure—retesting from above back beneath **\~\$3,338**.
Macro Drivers & Market Conditions
* Caution prevails pre‑Fed decision and ADP / GDP releases—market awaits cues on interest rate direction.
* Safe‑haven demand has softened as global trade sentiment improves, while U.S. dollar strength continues to cap upside in gold.
* Analysts favor **sell‑on‑rise positioning**, bumping up potential for controlled pullbacks.
Verdict
Gold is consolidating in a tight upward channel, showing short-term bearish pressure. The **bearish breakdown scenario holds the edge** unless price convincingly clears above **\$3,345** on strong volume, which could flip bias. A confirmed break below **\$3,326** sets the stage for downward moves toward **\$3,300** or lower.
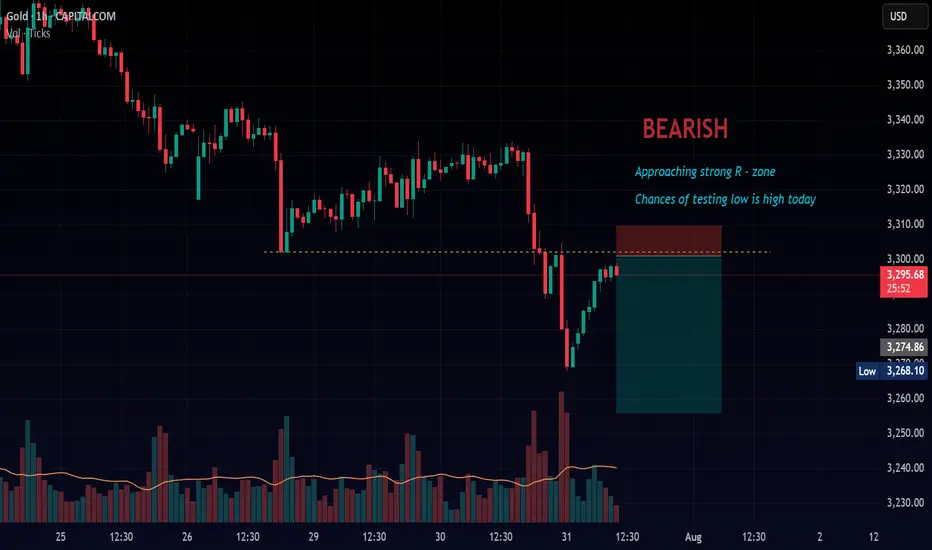
Gold Bearish OpportunityStrong bearish momentum
Close below 3300 could trigger further sell off
Possibility of liquidity & volatility is high due to monthly close - Stay Cautious
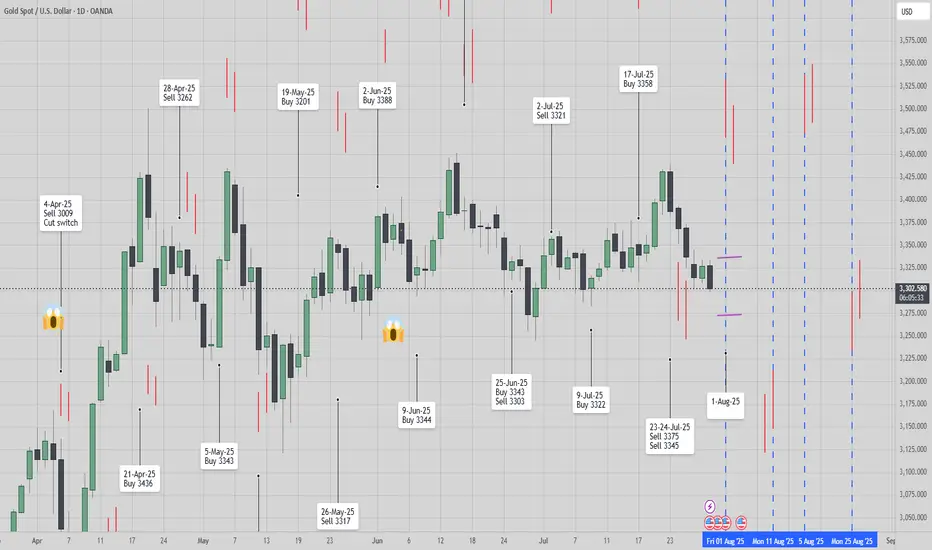
[ TimeLine ] Gold 31 July 2025📆 Today’s Date: Wednesday, July 30, 2025
📌 Upcoming Signal Dates:
• July 31, 2025 (Thursday) — Single-candle setup
• July 31–August 1, 2025 (Thursday–Friday) — Two-candle combined range
🧠 Trading Outlook & Notes
✅ Gold has recently dropped sharply from 3439 to 3298, and current conditions suggest this bearish momentum may continue.
✅ I’ll be actively trading both the July 31 and July 31–August 1 setups as part of my ongoing strategy testing and live analysis.
✅ This method and timing structure can also be applied to other assets like BTC, the US Index, and various commodities.
⚠️ For those taking a more cautious approach, it’s absolutely okay to skip the single-candle setup on July 31 and wait for the more confirmed 2-day range setup (July 31–August 1).
📋 Execution Guidelines
🔹 Range Identification:
• Let the Hi-Lo range of the chosen candle(s) form completely.
• Purple lines will mark these ranges on the chart.
• After the daily close, charts will be updated to include a 60-pip buffer, Fibonacci zones, and relevant indicators.
🔹 Entry Conditions:
• Trades are triggered only if price breaks above/below the full range, including the buffer zone.
🔹 Risk Management – Recovery Logic:
• If the Stop Loss is triggered, the trade is exited or switched, and the next valid breakout setup will use a doubled lot size to attempt recovery.
📉📈 Chart Snapshot
🔗 Paste this in TradingView: TV/x/fykxBG6w/
📌 Stick to the plan, follow the system, and let the chart lead the way.
🛡️ Capital protection comes first — always manage your risk.
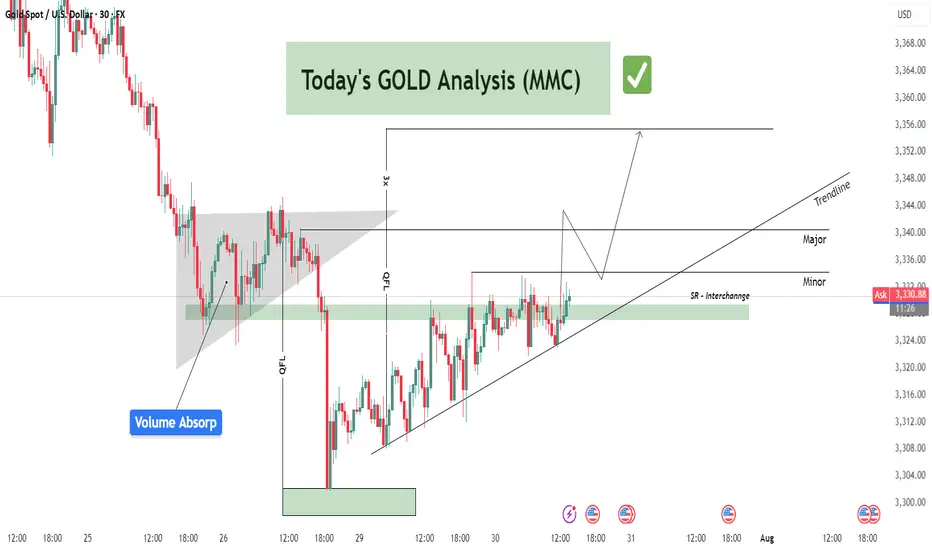
GOLD (XAUUSD) Analysis : Major Break + Bullish Setup + Target🟩 Today’s GOLD Analysis based on Volume Behavior, Smart Money Traps & Market Structure (MMC)
🔍 Chart Breakdown and MMC Concepts Explained:
1. Preceding Downtrend – Smart Money Trap Initiated
The chart begins with an extended downtrend, marking significant bearish pressure. However, deeper into the move, we notice price entering a Volume Absorption (VA) Zone — a key MMC signal where institutional orders quietly absorb aggressive retail selling.
This Volume Absorption Zone is highlighted on the left of the chart.
Smart money quietly positions longs here while inducing panic-selling from retail traders.
Wicks and indecision candles show early signs of sell exhaustion.
2. QFL Breakdown & Liquidity Sweep
The breakdown from the QFL (Quick Flip Level) is another hallmark of MMC behavior. The market intentionally breaks previous lows to trigger stop-loss clusters — known as a liquidity sweep or stop-hunt.
Price aggressively drops to a well-marked demand zone.
Massive bullish reaction from this zone confirms that smart money has completed accumulation.
The QFL move is not a true breakout, but a trap, designed to mislead retail into chasing shorts.
3. Demand Zone Reaction – Shift in Momentum
Price finds support at the demand zone (highlighted in green) and starts forming higher lows. This transition from lower lows to higher lows is a structural confirmation of market reversal.
Buyers have regained control.
Large bullish candles and wick rejections at key levels signal institutional entry.
4. SR Interchange Zone – Key MMC Confirmation
One of the most important zones on this chart is the SR Interchange area.
This level was previously resistance and is now acting as support — a concept known as support-resistance flip.
MMC teaches us that this is where smart money re-tests the breakout zone to trap late sellers and confirm the trend.
This zone is reinforced by:
Previous rejections
Retest with wicks
Alignment with ascending trendline support
5. Minor & Major Resistance Levels
Currently, price is attempting to break above a minor resistance at ~$3,330–3,332.
If it breaks, the next major target lies at the ~$3,340–3,345 level, marked on the chart.
This zone is crucial for short-term targets and may act as a profit-taking zone for early bulls.
Once this major resistance is cleared, the trendline projection suggests a continuation toward higher highs.
📐 Trendline Analysis
An ascending trendline is supporting price action. Each bounce off this line has led to higher lows — a clear sign of bullish intent.
Trendline + SR Interchange = Confluence zone
Traders should watch for bullish engulfing candles or strong wick rejections at this trendline area for re-entry or add-ons.
🧠 MMC Strategy Interpretation (Mirror Market Concepts)
This chart perfectly follows the MMC logic:
Trap retail sellers during the downtrend.
Absorb their volume at a key zone (Volume Absorp).
Sweep liquidity below QFL level.
Reverse structure with a shift to higher highs and higher lows.
Interchange SR zone to test buyers' strength.
Continue trend post-confirmation with breakout above resistance.
This is the classic "trap-to-trend" sequence smart money uses repeatedly in gold and other volatile markets.
✅ Trade Setup Summary:
Bias: Strongly Bullish (based on market structure shift)
Entry #1: Pullback into SR Interchange (ideal if price rejects 3,326–3,328)
Entry #2: Break and retest of Minor Resistance (3,332–3,334)
Targets:
TP1: 3,340 (Major Resistance)
TP2: 3,345–3,350 (Projection based on breakout path)
Invalidation: Clean break below trendline and demand zone (~3,318)
🧭 Final Words for Traders:
Gold is currently positioned at a critical junction where structure, volume, and institutional behavior all align. If you're following MMC strategies, this is a textbook scenario:
Trap ✅
Absorption ✅
Structure Shift ✅
Trendline Support ✅
SR Interchange ✅
Now, we wait for confirmation and execute with discipline.
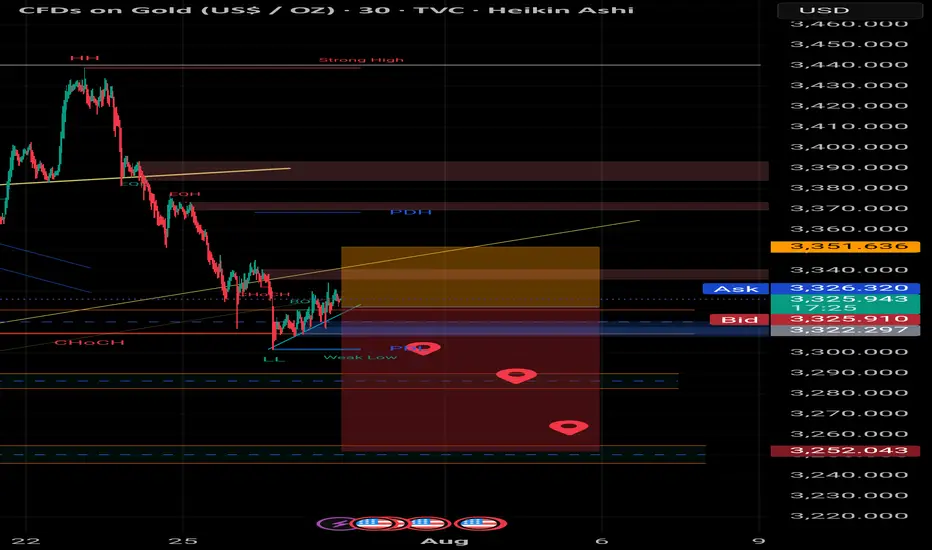
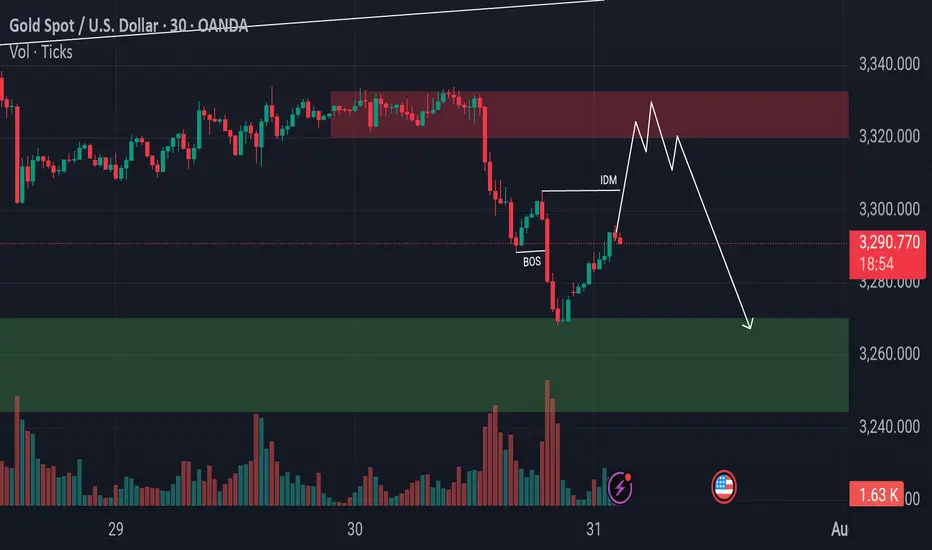
Sell Analysis – 30M Smart Money Concept Sell Analysis – 30M Smart Money Concept
📊 Chart Context:
Timeframe: 30M
Market: Gold (XAUUSD)
Bias: Bearish – Scalp Sell
---
🔍 Key Observations:
Premium Zone Rejection:
Price tapped into a premium supply zone formed after a clear break of structure (BoS) to the downside. This confirms seller dominance at higher pricing levels.
FVG (Fair Value Gap) Fill:
The price filled a previous FVG imbalance and showed rejection without closing above the origin of the impulse. This shows liquidity grab behavior typical in smart money moves.
Bearish Order Block Confirmation:
A bearish OB was respected and reacted to. The latest candle shows strong rejection with a long upper wick and volume tapering — an early confirmation of potential entry trigger for scalp short.
---
🧨 Entry Strategy (Scalp Sell):
Entry Zone:
Inside the reaction to the OB and FVG (just below the premium zone)
✅ 3325 ~3330
Stop Loss:
Just above the last high or FVG origin
✅ 3340
Take Profit:
TP1: Towards the equilibrium of the recent impulse leg
✅ 3300
TP2: Below the discount zone, targeting liquidity under recent lows
✅ 3280
---
⚠️ Risk Note:
This is a scalping setup, not a swing trade. Higher timeframes still show mixed signals, so risk management is key. Avoid over-leveraging.
---
🏁 Summary:
> A high-probability scalp sell setup confirmed by smart money concepts: BOS → FVG Fill → OB Rejection → Liquidity Grab → Bearish Continuation.
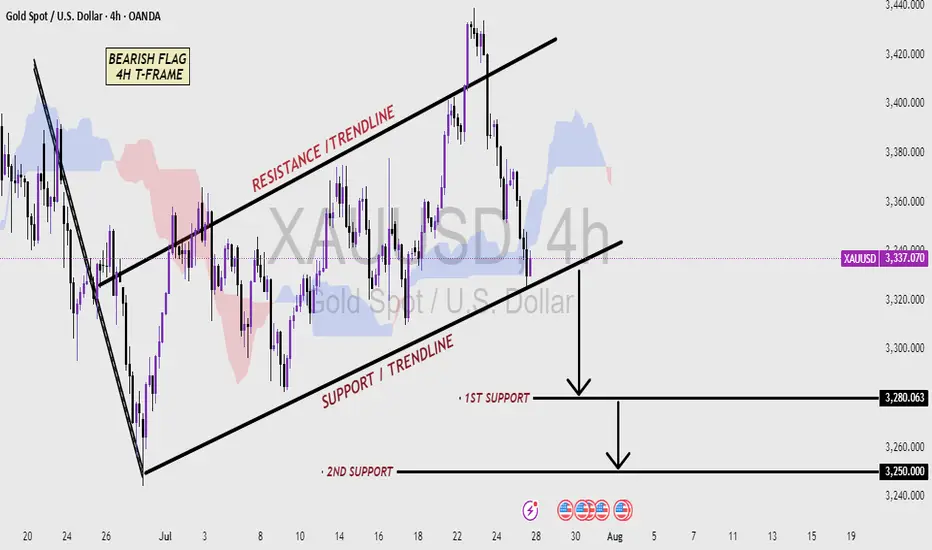
XAUUSD 4H CHART - Bearish pattern Analysis (read the caption)📉 XAUUSD 4H Chart – Bearish Flag Pattern Analysis
This 4-hour chart of Gold (XAUUSD) shows a classic Bearish Flag pattern, which is typically a continuation signal in a downtrend. After a strong bearish move, price entered a consolidation phase inside a rising channel, forming higher highs and higher lows—this creates the flag structure.
The price is currently trading within the Resistance and Support Trendlines of the flag. A break below the Support Trendline would confirm the bearish flag breakout, suggesting a continuation of the downtrend.
Key support levels to watch:
🔻 First Support: 3280.063 – Initial target after breakout
🔻 Second Support: 3250.000 – Extended target if bearish momentum continues
Traders should monitor for a confirmed breakdown with volume and bearish candlestick confirmation to validate short entries. This setup favors sellers if the support breaks decisively.
Go long on the pullback and head straight to new highs!Gold fell back and stabilized at 3345 yesterday, and continued to rise during the US trading session, reaching a high of 3385. The overnight daily line closed positive again, which is in line with our expectations, so there is still room for growth. We will continue to take a bullish approach today. In the 4H cycle, the Bollinger opening is in the stage of large volume, and the consecutive positive lines are rising steadily based on the moving average. The support below is 3370-3360, and the intraday watershed is at 3360. The operation is mainly to go long on pullbacks. First look at the pressure of the 3385 high point. If it breaks, continue to look at 3395 and 3410.
Gold operation suggestion: go long on gold around 3370-3360, and look at 3385 and 3400.

RIDE THE TREND OPPORTUNITYPrice seems to have a correction movement before continue flying to next supply area.

XAUUSD Technical Analysis – Bullish Continuation SetupXAUUSD Technical Analysis – Bullish Continuation Setup
📊 Market Structure Overview:
The chart shows a clear bullish structure shift, marked by multiple Break of Structure (BOS) events that validate strength from buyers. After forming equal lows and a liquidity sweep at the strong support zone, price has aggressively moved higher, breaking through minor resistance levels and showing clear bullish intent.
🧱 Key Technical Elements:
🔹 1. Strong Support Zone (Demand Rejection)
Price respected the strong demand zone between $3,260 – $3,280, where aggressive buying was seen after forming a bullish engulfing breakout. This zone aligns with previous demand and a major BOS, confirming institutional buying interest.
🔹 2. Bullish Order Flow & Break of Structure (BOS)
Multiple BOS levels across July and early August highlight a sequence of higher highs and higher lows, indicating trend continuation.
The most recent BOS after July 30 shows an impulsive break, confirming bullish dominance and clean order flow.
🔹 3. Fair Value Gaps (FVGs)
Bullish FVG (Mid-July): Price respected and bounced from this zone, showing previous imbalance was filled and used as a base for continuation.
New FVG (Above $3,420): The current upside target lies within this area, acting as a magnet for price due to unfilled orders.
🔹 4. Buy-Side Liquidity & Target Zone
The market is approaching a buy-side liquidity zone around $3,385, a key short-term target where previous highs and stop orders are likely pooled.
If liquidity above $3,385 is taken efficiently, price may expand into the FVG zone between $3,420 – $3,460.
🔹 5. Bullish Confirmation & Momentum
The candle structure shows a clean bullish impulsive move, followed by minor consolidation—likely a bullish flag/pennant indicating potential for further continuation.
Momentum is favoring buyers, and short-term consolidation above $3,340 is healthy for continuation.
🔐 Liquidity & Institutional Narrative
Equal Lows (EQL) and FVG fills suggest prior liquidity was swept and used to fuel institutional long positions.
The recent BOS confirmed that smart money has shifted bias toward longs, and price is now targeting remaining inefficiencies to the upside.
The clear alignment of BOS, liquidity sweep, and bullish FVGs reinforces a strong institutional footprint on this move.
🔍 Key Levels to Watch:
Level Type Price Zone (USD)
🔺 Resistance / FVG 3,420 – 3,460
🎯 Immediate Target 3,385
📉 Short-Term Support 3,340 – 3,320
🛡️ Major Demand Zone 3,260 – 3,280
📌 Conclusion & Outlook:
XAUUSD has initiated a strong bullish leg from the demand zone, confirming accumulation and structural reversal. Price is now moving toward the buy-side liquidity target of $3,385, with potential continuation toward the FVG resistance zone of $3,420–$3,460.
As long as price remains above the $3,320 structure support, the bullish bias remains intact. Any pullbacks should be seen as buying opportunities, especially on lower timeframe confirmations.

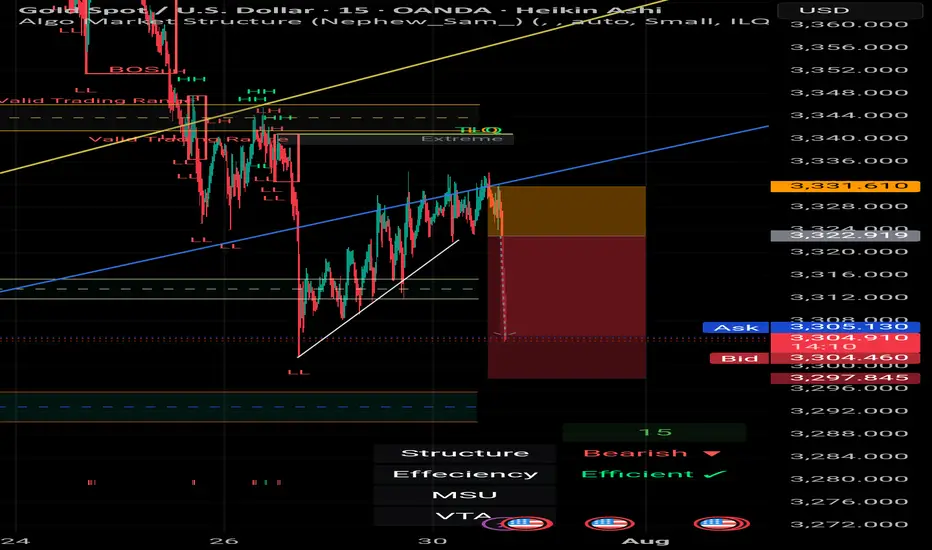
(XAUUSD) H1 timeframe sell analysis(XAUUSD) H1 timeframe sell analysis:
Sell Analysis for Gold OANDA:XAUUSD (XAUUSD) – H1 Timeframe
Technical Structure:
1. Downtrend Channel:
Price was previously trading within a downward sloping channel.
A breakout occurred to the upside (bullish breakout).
2. Order Block (OB):
Price made a strong bullish move from the OB zone.
3. Reversal Swing:
Price tested the resistance level around 3,364.800.
Weak bullish momentum is visible, indicating a possible reversal.
Sell Entry Zone:
Entry Price: Around 3,356 (Reversal swing area).
Stop Loss: Above the resistance – 3,378.000
Confirmation: Look for bearish candle formation near the resistance zone.
Take Profit Levels:
1. TP1: 3,344.000
2. TP2: 3,326.000
3. TP3: 3,306.000
Stop loss 3,378
You can select TP1, TP2, or TP3 depending on your risk appetite.
Reasoning for Bearish Bias:
A rejection wick has formed at the resistance level.
The reversal swing suggests price may be forming a lower high.
Multiple take profit levels are aligned with Fibonacci levels and previous support zones.
After a strong bullish move from the OB zone, a correction is expected.

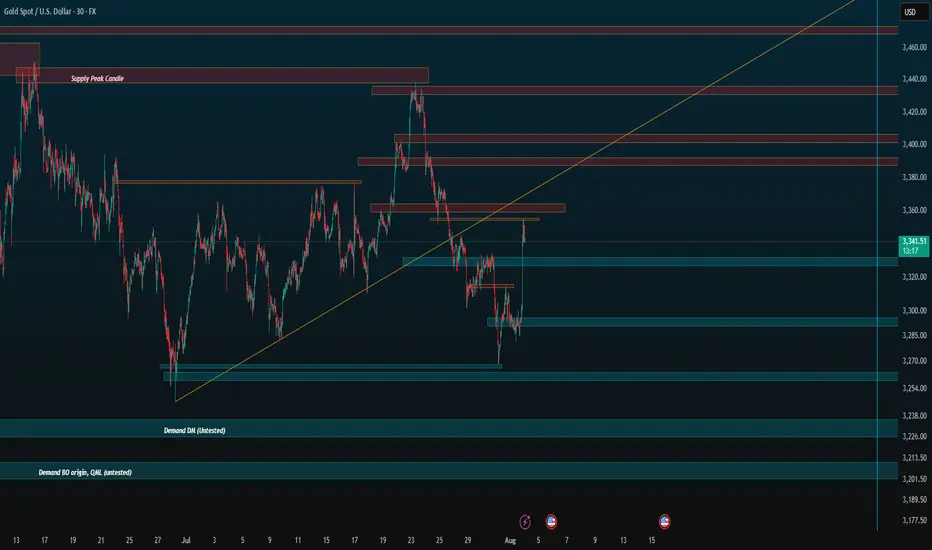
Zones for the rest of August (if no ATH)Just simple zones, ignore. I want to compare to the end of the month later.
Keep trading simple. These are the zones I made after drawing from 4H all the way to 5 minute candle for precision. I already have my own speculation but feel free to use it for your own.
Goodbye, trade safe.
Gold rebound is weak, short below 3315
Gold remains weak, with multiple intraday rebounds failing to maintain momentum. The upper moving average continues to suppress the market, and the short-term market remains dominated by bears. Today, we are following the trend and taking a bearish stance. The key upside level is around 3315. If it reaches this level before the US market opens or if it peaks in the short term, we will short sell. The non-farm payroll data will be released today, and we will consider reversing our direction based on the situation after the data.
Gold prices have once again encountered resistance to their upward trend, and the volatile pattern continues. The gold price trend is trending lower highs, and today's low is expected to be lower than yesterday's. Therefore, our intraday short target could be 3268 or even lower, so it's crucial to seize the right entry point.
If you're new to the market, come to me. I'll teach you how to trade while you learn. If you're already in the market and struggling, come to me. I'll help you avoid repeating the same mistakes. If you've already experienced this market and are battered, come to me. I'm confident I can help you regain confidence. If you're stuck in a position, I'll develop a strategy tailored to your entry point. Because everyone's trapped positions are different, the solutions will vary, some suitable for conservative traders and others for aggressive ones. However, I can't offer a perfect answer to every situation. I suggest you bring your order with you. Once you contact me, I'll use the most appropriate method to resolve your situation and help you exit the market.
Specific Strategy
Short gold at 3315, stop loss at 3325, target at 3280
XAUUSD
XAUUSD Updated in 15M :
The gold signal is marked on the chart based on the latest price changes and the supply and demand in the market. These points include the entry point, stop loss, and take profit
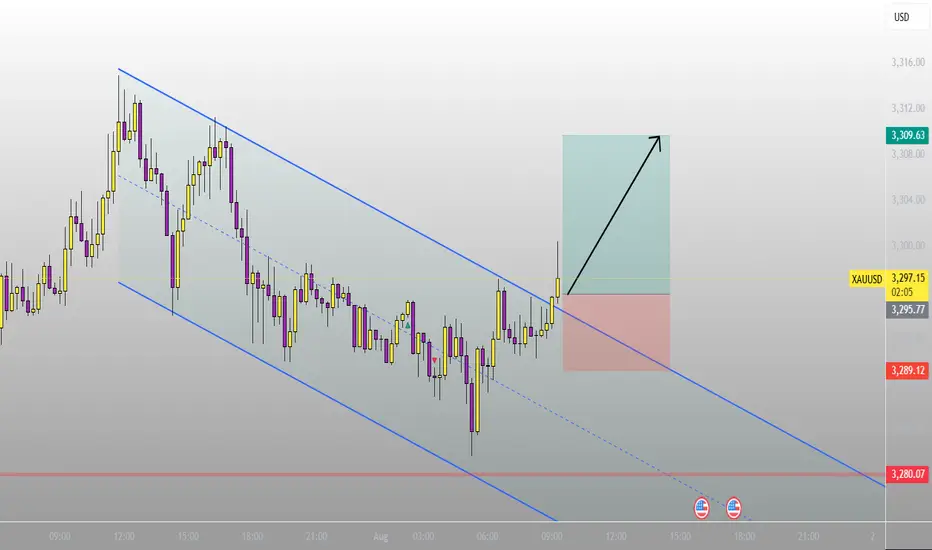
Gold Bulls Charging to 3305 But What’s Waiting There?Gold has recently taken support from the lower levels and has also shown a Break of Structure (BoS) to the downside. Currently, there is Imbalance and Internal Draw on Liquidity (IDM) resting around the 3305 level. The market appears to be moving upward to mitigate that imbalance. It's important to closely monitor this zone, as once the market reaches and fills this area, there is a high probability of a potential rejection or bearish move from that level
Scalping Sell Setup – Trendline Break & Pullback Confirmation📉 Scalping Sell Setup – Trendline Break & Pullback Confirmation
Posted earlier – trade progressing as planned.
As shared in the previous chart, a Sell scalp position was executed based on the trendline break followed by a pullback retest.
Three Take-Profit levels were marked and the price is moving in line with the forecast. ✅
🟢 TP1 Hit
🟢 TP2 Reached
🔵 TP3 in progress
📌 The setup remains valid, and as long as structure holds below the retested trendline, the bearish bias continues.
We will monitor price action near TP3 zone for final exit or trailing stop update.
> Analysis worked perfectly so far – let’s see if TP3 gets cleared soon. 🔍💥
Gold VS US 10- year yield Gold pared most of its gains on a strong US dollar. It hits an intraday low of $3307 and is currently trading around $3311.
Any breach below $3305 (365- 4H EMA) confirms trend weakness and a dip to $3245/$3200 is possible. The strong US dollar and surge in US 10-year yield after strong US jobless claims and GDP data.
It is good ot sell below $3305 with an SL around $3330 for a TP of $3245/$3200.

Gold Channel on 1h chartThis is Gold channel on 1H chart it is showing support and resistance levels. If Gold cross this channel then an strong trend could be possible.

XAUUSD CAN FLY HIGHXauusd market running in side from last few days now market will touch the support zone so if you to buy gold then you have to good oppourtanity to buy from support level
TRADE AT YOUR OWN RISK
REGARD ALBERT
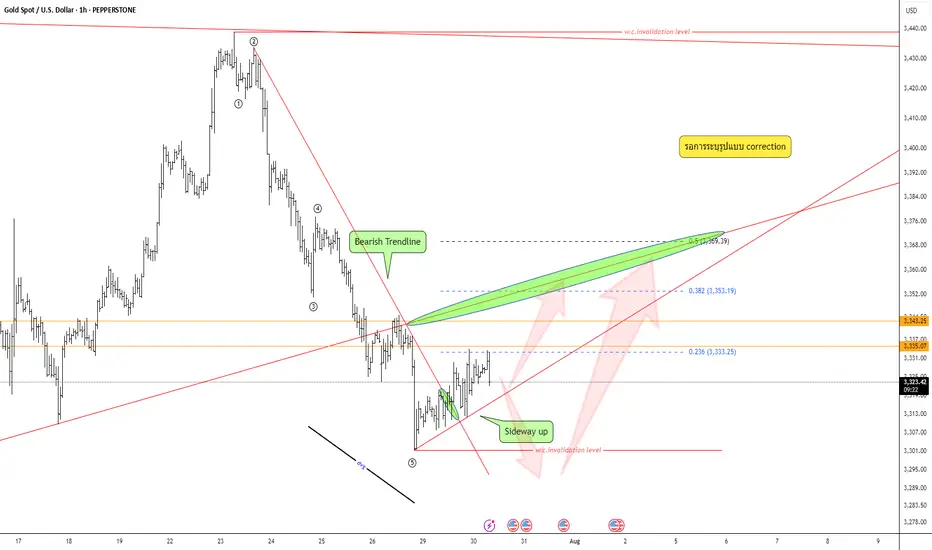
Keep an eye on the correction pattern —Quick Take:
- Strong bearish move, but wave structure still unclear — not a confirmed impulse.
- Bear trendline has broken; market now leaning toward sideways-up.
- Divergence is visible.
Plan:
Wait for correction pattern → confirm with your system → execute only with full data and strict risk management.
Gold Struggles Near Resistance – Eyes on 3313 for Further DropXAU/USD Slips as Dollar Gains on Trade Deal – Bearish Below Pivot Zone
Gold is under pressure as the U.S. dollar strengthens on optimism around a trade agreement. Risk appetite has returned, weighing on safe-haven demand.
Price failed to hold the pivot zone (3347–3360) and is now slipping below 3327. A 4H close below 3313 will likely trigger further downside.
Until bulls reclaim the pivot, bias stays bearish. Next support sits near 3287 if 3313 breaks clean.
Key Levels:
Resistance: 3388 – 3390 – 3412
Pivot Zone: 3340 – 3347
Support: 3313 – 3263

My plan for GoldShould we plan for a 600 pip profit on gold this week? I suggest you check the chart after withdrawing the liquidity shown.

Gold Analysis and Trading Strategy | August 5✅ Fundamental Analysis
🔹 Rising Geopolitical Risks: Military tensions between the U.S. and Russia are escalating in Eastern Europe, while the humanitarian crisis in the Middle East continues to intensify. This has heightened risk-off sentiment and supported demand for gold as a safe haven.
🔹 Tightening Global Trade Conditions: The U.S. has announced new tariffs on imports from countries such as Switzerland and India, raising concerns over global supply chains. This has triggered risk aversion and prompted capital to flow into safe-haven assets like gold.
🔹 Weaker U.S. Dollar: The U.S. Dollar Index has fallen to 98.786, hitting a new short-term low and providing a favorable monetary environment for gold.
🔹 Upcoming Data Impact: Market participants are closely watching today’s release of the U.S. July ISM Non-Manufacturing PMI. A weaker-than-expected reading could further weigh on the dollar and help push gold through key resistance levels.
✅ Technical Analysis
🔸 The market is currently in a post–non-farm payroll recovery phase. Gold prices have continued rising without a meaningful pullback, which suggests that the rally is being driven by momentum. However, such slow and steady gains often precede short-term corrections as bulls may begin to take profits. Caution is warranted for potential volatility or reversal at higher levels.
🔸 On the hourly chart, gold remains within an upward channel, although bullish momentum is gradually weakening. Yesterday’s low around 3345 serves as a key support level, while the 3385–3390 zone is a crucial short-term resistance. A retest of this area could lead to a modest pullback.
🔸 On the 30-minute chart, early signs of a potential top are emerging. Technical indicators are in overbought territory, and candlestick behavior shows price stalling near highs. A possible double-top pattern is forming around 3385. If the price breaks below the neckline at 3370, the pattern would be confirmed, opening up short-term downside potential.
🔴 Resistance Levels: 3385–3390 / 3400–3405
🟢 Support Levels: 3370–3360 / 3345–3335
✅ Trading Strategy Reference:
🔻 Short Position Strategy:
🔰Consider entering short positions in batches if gold rebounds to the 3385-3390 area. Target: 3370-3350;If support breaks, the move may extend to 3340.
🔺 Long Position Strategy:
🔰Consider entering long positions in batches if gold pulls back to the 3340-3345 area. Target: 3365-3375;If resistance breaks, the move may extend to 3385.
🔥Trading Reminder: Trading strategies are time-sensitive, and market conditions can change rapidly. Please adjust your trading plan based on real-time market conditions. If you have any questions or need one-on-one guidance, feel free to contact me🤝
