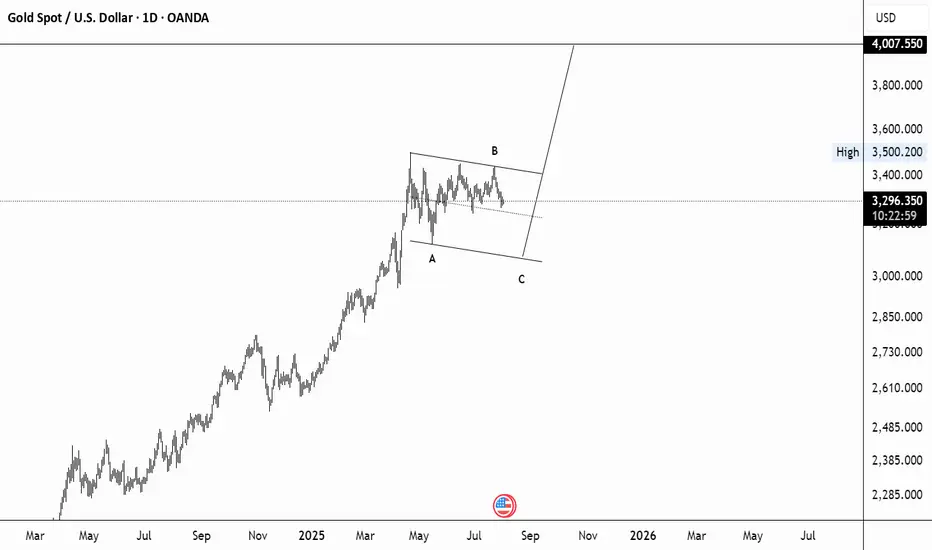
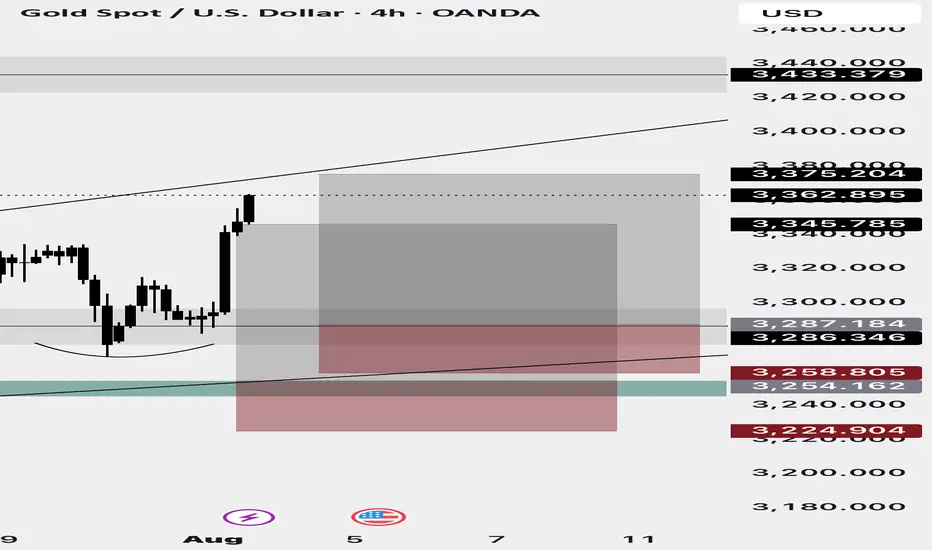
gold 4ooo projectionHello, me thinks gold is ready for a midterm correction, which in turn can propel it to 4ooo. This is just an idea, not financial advice. Cheers
GOLD trade ideas
GOLD NON FARM ANALYSISAs you can see market is moving round and round inside bullish FVG from thursday night 31 july and making sell side liquidity which is till 3382 so possible move can be an expansion which will be bullish.4H bullish FVG indicates that market does not wants to go down.

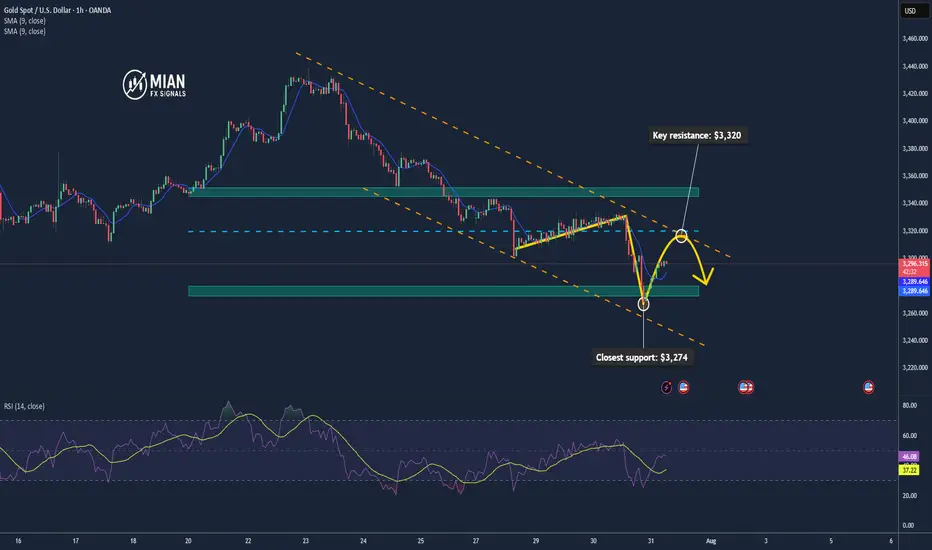
Gold May Rise Technically after Testing the $3,300 Zone📊 Market Overview:
Spot gold is trading around $3,295–$3,301/oz, influenced by slightly lower U.S. Treasury yields and a softer dollar tone. Analyst consensus from Reuters projects gold likely to stay above $3,220/oz through 2025 and possibly hit $3,400 in 2026 amid continued safe-haven demand
📉 Technical Analysis:
• Key resistance: $3,320 / $3,345
• Closest support: $3,274 – $3,280
• EMA09: Price is currently below the 9 period EMA on H1, indicating a short-term bearish bias.
• Candlestick / volume / momentum: There was a minor bounce from the support zone around $3,274, but volume remains low. RSI isn't oversold, suggesting room for technical pullback.
📌 Outlook:
Gold may experience a technical rebound if it holds above $3,280. A breakout above $3,320 would likely require clear catalyst—such as weak U.S. data or a dovish Fed tone.
💡 Suggested Trading Strategy:
SELL XAU/USD: $3,320 – $3,323
🎯 TP: 40/80/200 pips
❌ SL: $3,326
BUY XAU/USD: $3,279 – $3,282
🎯 TP: 40/80/200 pips
❌ SL: $3376
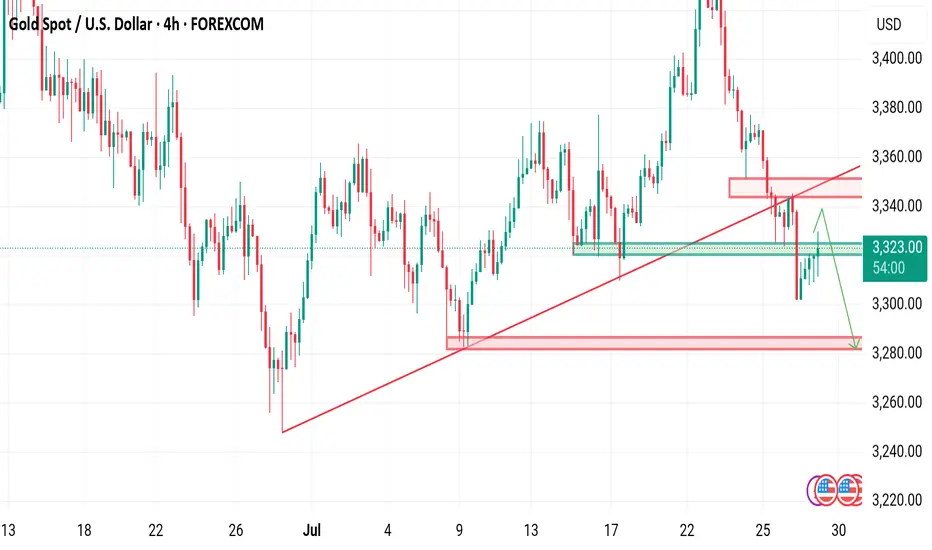
Gold (XAU/USD) Analysis:Following yesterday's Fed statements regarding the economic impact of tariffs and the decision to keep interest rates unchanged, gold prices dropped to $3,268, before rebounding today to retest the $3,310 zone. The short-term trend remains bearish.
1️⃣ A break and hold below $3,300 may push the price toward $3,280, and potentially $3,260.
🔻 A confirmed break below $3,260 could lead to a deeper decline toward a strong support zone near $3,245.
2️⃣ On the other hand, if bullish momentum appears and the price breaks above $3,310, it may open the path to $3,330 — a key level that could trigger a bearish rejection.
📈 However, if the price holds above $3,330, the next target would be $3,350.
⚠️ Disclaimer:
This analysis is not financial advice. It is recommended to monitor the markets and carefully analyze the data before making any investment decisions.

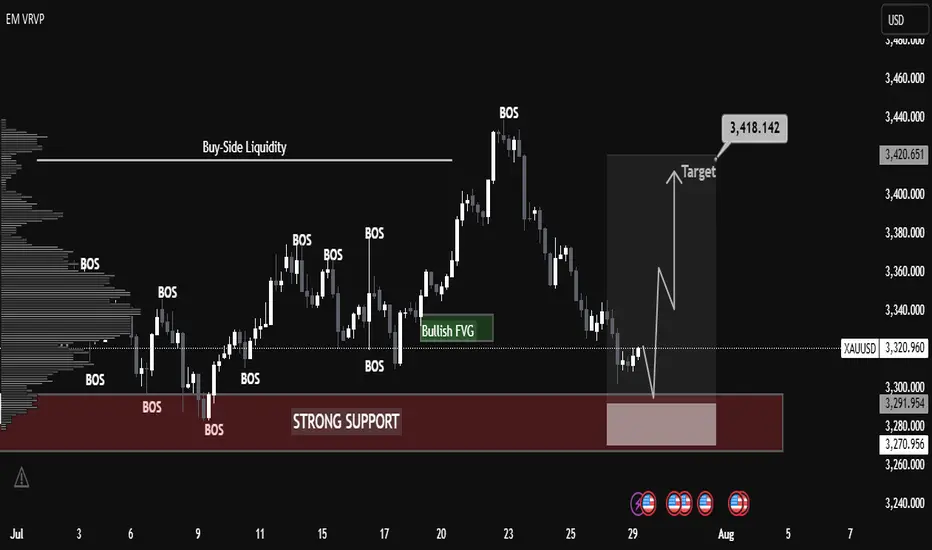
XAUUSD Technical Analysis – Strong Bullish Move Expected XAUUSD Technical Analysis – Strong Bullish Move Expected from Support Zone
Date: July 29, 2025
Chart Type: Price Action | Smart Money Concept (SMC) | Volume Profile
🧠 Educational Breakdown:
1. Strong Support Zone (Demand Area):
Price has entered a clearly marked strong support zone around $3,270 - $3,292.
This zone has previously acted as a major demand level, where buyers stepped in to reverse bearish pressure.
High volume node from the Volume Profile on the left confirms significant historical interest in this price region.
2. BOS – Break of Structure:
Multiple Break of Structures (BOS) throughout the uptrend confirm bullish market intent.
The recent decline appears corrective, not impulsive, suggesting a potential bullish continuation.
3. Bullish Fair Value Gap (FVG):
A Bullish FVG is visible just above current price, acting as a magnet for price action.
This imbalance is often targeted before further market movement, supporting the idea of an upcoming bullish move.
4. Liquidity Grab Setup:
Price dipped into the support area likely to sweep liquidity (stop losses) before a reversal.
This is a common Smart Money trap, where institutional players grab liquidity before moving the market in the intended direction.
5. Target Zone:
A clear target is set around $3,418, aligning with previous highs and potential Buy-Side Liquidity.
The projected move represents a clean higher high, following the higher low formed at the support zone.
Confirmation: Wait for bullish engulfing or displacement candle on lower timeframe (M15-H1).
Volume Support: Look for rising volume during the reversal to confirm smart money participation.
📘 Conclusion:
Gold (XAUUSD) is showing a textbook bullish reversal setup from a high-demand zone. With strong structural support, fair value gap targeting, and buy-side liquidity above, the setup favors bullish continuation toward $3,418.
Xausd techinical analysis.Xausd techinical analysis next move posibale at h1 time frame not finchinal advice.

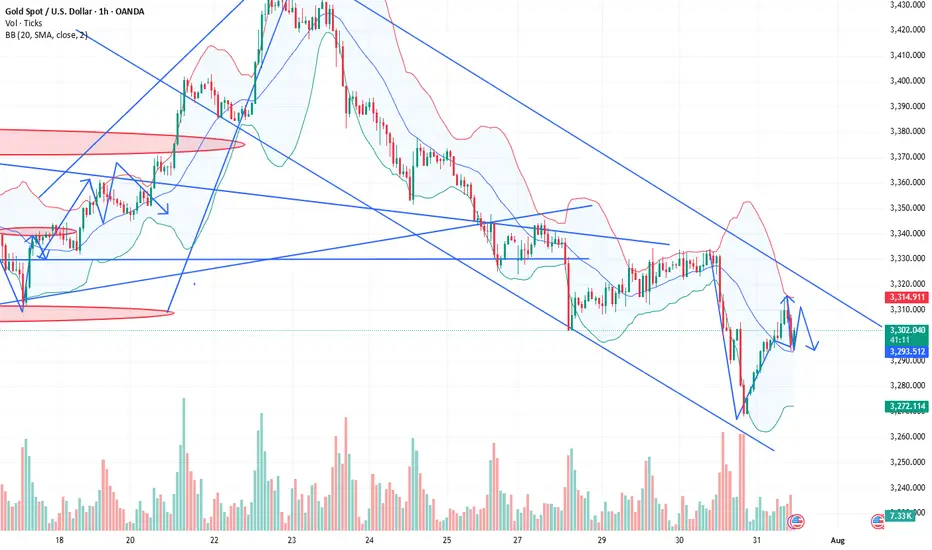
XAUUSD on Bearish values and volume Gold is currently below rising channel and holding the Range of 3320-3335,although yesterday implusive drop is incompleted without testing 3290-3280
Eyes on DXY
What's possible scanarios we have?
▪️I will wait next for my sell trades at 3338-3345 area but what we have to watch during that time H4 candle closing.if H4 & H1 candle close above I will not hold or renter sell also below 3320 we have implusive drop.
▪️Secondly if H4 candle closing above 3345 this down move will be invalid and Price-action will reached 3370.
#XAUUSD
THE KOG REPORT - UpdateEnd of day update from us here at KOG:
Not bad play at all with the red boxes working well, KOG's bias of the day and the red box targets working well and of course the indicators and our trusted algo Excalibur guiding the way completing the move that we wanted downside. We then got a fantastic long from the bias level and red box activation up into where we are now.
So, what now?
We have resistance and a red box above which is broken suggesting we may see some more movement downside in the coming sessions. This would also align with the hunt and undercut low that can take place at this key level. We're a bit too low to short, so we'll either look for the break above 3375 to go higher, or, we'll wait lower for a potential long trade from the red box region.
Immediate support here is 3360-5 and resistance 3375.
Price: 3364
KOG’s Bias of the day:
Bullish above 3350 with targets above 3358✅, 3365✅ and above that 3379✅
Bearish on break of 3350 with target below 3337 and below that 3330
RED BOXES:
Break above 3365 for 3372✅, 3375✅, 3388 and 3406 in extension of the move
Break below 3350 for 3335, 3330, 3326 and 3307 in extension of the move
As always, trade safe.
KOG
XAUUSD 30M Range Trap Holding, But Will Bulls Break Above $3366Gold is currently trading within a well defined intraday range, with clear resistance around $3,366.36 and support near $3,339.78. After a strong initial move, price action has stalled, reflecting indecision and balanced order flow between buyers and sellers.
The market now approaches a key inflection point:
→ A confirmed 30 minute candle close above $3,366.36 would signal potential bullish continuation, with immediate targets at $3,368.99 and $3,371.11
→ Conversely, a close below $3,339.78 may trigger a downside move toward $3,331.66, followed by $3,328.21
Momentum remains neutral within the range, and any premature entries carry increased risk of whipsaw. Patience is essential, a clean breakout with structure and volume confirmation will offer higher probability trade setups.
This remains a rangebound environment until proven otherwise. Breakout traders should stay alert, but disciplined.
#XAUUSD #Gold #TechnicalAnalysis #PriceAction #SupportResistance #BreakoutWatch #MarketStructure #30mChart

XAUUSDXAUUSD breakout falling channle and resistance zone.
Buy above 3295
Stop Loss: 3291
1st TP: 3308
2nd TP: 3313
3rd TP: 3322
4th TP: 3333
Elliott Wave Perspective: Triangle Completion in Sightrom the Elliott Wave viewpoint, the current pattern suggests a potential completion of the triangle formation.
To confirm this scenario, a breakout above the bd trendline is required.

Target 3470 Tests zone Gold will going towards 3470/3480 zone for retesting area its because of fill imbalance over long term candle stick , Two area need to watched one 3470/3480 or 3520

XAUUSD Gold Trading Plan – Monday, 4th August 2025Strategy Type: Intraday / Short-term swing
Bias: Bullish (Buy-the-dip)
Methodology: Price Action + Fibonacci Retracement + Momentum Confirmation
Key Zones: 3366, 3377, 3388
Market Overview
As we head into Monday, 4th August, Gold (XAUUSD) remains in an overall uptrend, supported by bullish macro sentiment driven by weakening USD strength and ongoing uncertainty in global risk assets. Despite last week’s slight pullback, the structure still supports a continuation pattern, especially above the 3350 support region.
The previous week closed with a higher low formation, and current price action shows a healthy retracement rather than a reversal. We anticipate that Gold will respect key Fibonacci retracement levels and rally in phases, allowing for multiple entries and scaling opportunities.
🔍 Trading Plan Summary
✅ Step 1: Buy on Retracement to 3366 (1st Target Area)
Entry Zone: Around 3366
Reasoning: This level is a confluence zone — minor support from Friday’s breakout, aligning with intraday Fibonacci retracement (~38.2% pullback from recent swing low to high).
Confirmation: I’ll look for bullish candle confirmation on 15m/30m chart (e.g., bullish engulfing, pin bar, or strong rejection wick) before entering.
Stop Loss: Below 3356 (previous swing low / invalidation level)
🎯 Target 1: 3377
This will be the first take-profit zone after price reaches the next resistance / previous order block zone.
I will secure partial profits here and trail SL to entry or +5 to lock in risk-free trade.
✅ Step 2: Wait for Retracement Again (Post-3377 Pullback)
If price pulls back after hitting 3377, I’ll wait for the new higher low to form — ideally somewhere between 3370–3373.
I’ll re-enter long with confirmation, targeting the next key level.
🎯 Target 2: 3388
This level is the next visible resistance on 1H/4H structure and may trigger profit-taking or reversal pressure.
I plan to close the majority of my position here unless price shows strong breakout momentum.
⚠️ Risk Management Notes
Maximum total exposure: 1.5% of account (0.5% per trade entry)
All trades will have a defined SL; no averaging down.
Avoid entering if price gaps up directly above 3377 on Monday open — in that case, I’ll reassess structure and wait for new retracement levels.
🛠 Tools to Watch
DXY (Dollar Index): If DXY weakens further below 104.50, this supports the bullish Gold thesis.
US Bond Yields: Any decline in yields also gives bullish pressure on Gold.
Volume & RSI Divergence: For entry and exit confidence.
News Risk: Keep an eye on any surprise geopolitical tensions or Fed commentary, though major data events are limited on Monday.
🔁 Summary of Execution Plan
First Buy Entry: 3366 → TP1: 3377
Second Buy Entry (on retracement): ~3371 → TP2: 3388
SL Discipline: Below swing structure, never moved unless TP1 hits.
Profit Securing: Partial at 3377, majority at 3388
Trade Review: At EOD, whether plan was followed or not

Gold (XAU/USD): Supply Zone Rejection & Bearish Breakdown Chart Breakdown:
Supply zone rejection: Gold revisited the “supply zone” (light green/grey area) and failed to break above — a classic signal of seller dominance.
Uptrend invalidated: A sharp rise (steep black trendline) ended with a peak marked by the green arrow, followed by a decisive breakdown.
Ichimoku Cloud test: Prices slipped through the Ichimoku components, reinforcing the shift to bearish sentiment.
Potential targets: The red/green risk‑reward box highlights a short position, targeting ~3,347 then ~3,318 levels (blue labels) as initial support zones.
Strong supply base: The extensive grey zone below marks a "stronger supply zone" — this could cap any modest bounce and keep the downtrend intact.
🔍 Interpretation:
Bias: Bearish — sellers have taken control after a failed breakout.
Strategy: Short on rallies toward the mid‑green/red box (~3,373–3,380), targeting ~3,347 first and then ~3,319. Watch for support at the strong supply region (~3,292) for potential reversal or consolidation.
Risk management: Keep stop above the red zone—above recent highs (~3,380+) to limit risk.
🚀 In a nutshell: After failing to break supply and losing its short‑term uptrend, gold appears poised for a pullback. The next key levels to watch are ~3,347 and ~3,319—where buyers might step back in, or the downtrend continues toward the deeper supply base.

Trend continuation or reversal?Gold bounced strongly from the bottom of the higher time frame channel, and we should also consider that this bounce was triggered by news that was negative for the dollar on Friday. Now we need to wait and see whether this move is truly strong or if it's going to turn out to be a fake and head back down toward the bottom of the channel.

Final Plan with liquidities for Aug 4 onwardsAs after marking liquidities we can assume that Plan B will be more better for AUG 4 onwards trading.

XAUUSD TRADE UPDATE MISSED TRADE Hey everyone here’s a trade recap of the week at first we were interested to take buys at 3254 zone as first entry and scale in at 3287 zone but price pulled down slightly missed the first entry and I didn’t execute & the second entry didn’t execute that too and market skyrocket if price activated the first entry we would’ve caught a huge trade today,the first one didn’t activated so I didn’t execute the second entry which is the 3287 zone that buyers came in so we move on and I will keep on sharing potential good setups and have a beautiful weekend guys….
XAUUSD ShortElite Analysis
All confirmations were confirmed
Targeting lower liquidity pools
Executed in a small time frame
Thank You!
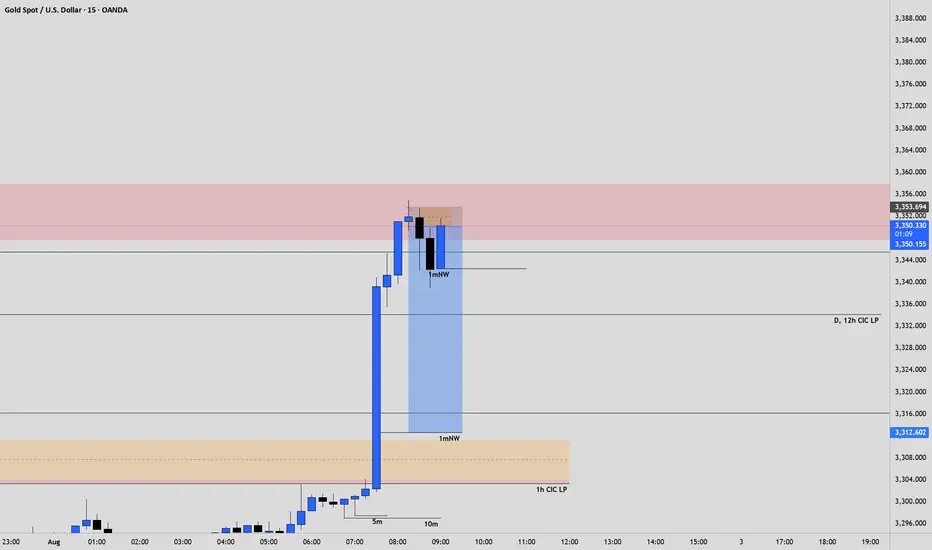
XAUUSD – Smart Money Sell Setup during New York Session | ICT St
Gold (XAUUSD) has just completed a classic liquidity grab above the London session highs, forming a potential Judas Swing as New York begins.
On the 4H timeframe, we clearly have a bearish BOS (Break of Structure), and price has returned to a Premium zone within a bearish FVG and OB (Order Block).
Today is NFP Friday, and after the Fed kept rates steady mid-week, we’re expecting high volatility.
Current price action has swept the overnight liquidity and is now reacting inside a Repricing Block, aligning perfectly with the NY Midnight Open level.
🎯 My Sell Plan (Live Execution):
Sell Limit: 3306.50
SL: 3317.50 (Above OB high)
TP1: 3281.20
TP2: 3268.50
TP3: 3253.90
🧠 Bias: Bearish
🕒 Session: New York
🧮 ADR: 43 pts
📉 Market Structure: Bearish
This setup follows the ICT methodology using time, liquidity, structure, and displacement.
If we break above 3317.50 with strong displacement, the idea becomes invalid.
Let's see if Smart Money takes it down into Friday’s close.
xauusdGold enters support by reaching daily trend line
If gold continues to hold support
Gold is expected to reach its previous high again
Full review of my NY basket and trading ideas for todayFull analysis and trading ideas for todays NY session for DXY, Silver, Gold, WTI, NAS, S&P, DJ30

Short position profit. Latest strategyYesterday's gold price fluctuated: it maintained sideways fluctuations in the morning and started a downward channel after the opening of the US market. The Federal Reserve's interest rate decision remained unchanged. In addition, Powell's speech suppressed expectations of a September rate cut. The gold price directly fell to around 3267 and closed the day with a negative line, which exceeded expectations.
Looking back at recent trends, gold prices saw a brief correction on Tuesday after four consecutive days of decline, but failed to sustain the upward trend, falling sharply again yesterday, demonstrating that the weak market remains intact. Judging from today's market, theoretically there is still room for further decline, but before yesterday's low is broken, we don't expect a big drop for the time being; if the support here is effective, the market may tend to correct.
Pay attention to the daily resistance near 3315, and try shorting with a light position; the hourly resistance is near 3301, which is also a good position for shorting; the intraday bull-bear watershed is near 3294. If the market falls weakly and rebounds here, there may be a decline. The target below will first look at 3275. If yesterday's low of 3267 is broken, look further to 3250: On the long side, pay attention to the 3249 support below. If it is close to broken, you can try short-term buying.
【Operation ideas】👇
The bearish strategy in the morning remains unchanged. The short position at 3315 was publicly set up in the morning. The market rebounded to 3314 and then went down directly. The idea of setting up short positions at 3301 in the morning session remains unchanged. Friends who did not follow up with the short positions at 3315 can now add short positions with a light position at 3300.
PEPPERSTONE:XAUUSD ACTIVTRADES:GOLD VANTAGE:XAUUSD ACTIVTRADES:GOLD ICMARKETS:XAUUSD VELOCITY:GOLD PYTH:XAUUSD