Gold Crashing After Hot U.S. Data – More Pain Ahead?Minutes ago, important indices were released from the US , which catalyzed the continuation of gold's downward trend .
Key U.S. Economic Data Just Dropped!
ADP Employment: 104K
GDP q/q: 3.0%
Both came in stronger than expected , signaling that the U.S. economy is holding up better than many thought!
Strong job growth
Solid economic expansion
The result? A stronger U.S. dollar ( TVC:DXY ) and potential downward pressure on Gold .
All eyes are now on FOMC meeting .
Will the Fed still hint at future rate cuts despite the solid data? Or is the easing cycle officially on hold? What is your idea!?
----------------------
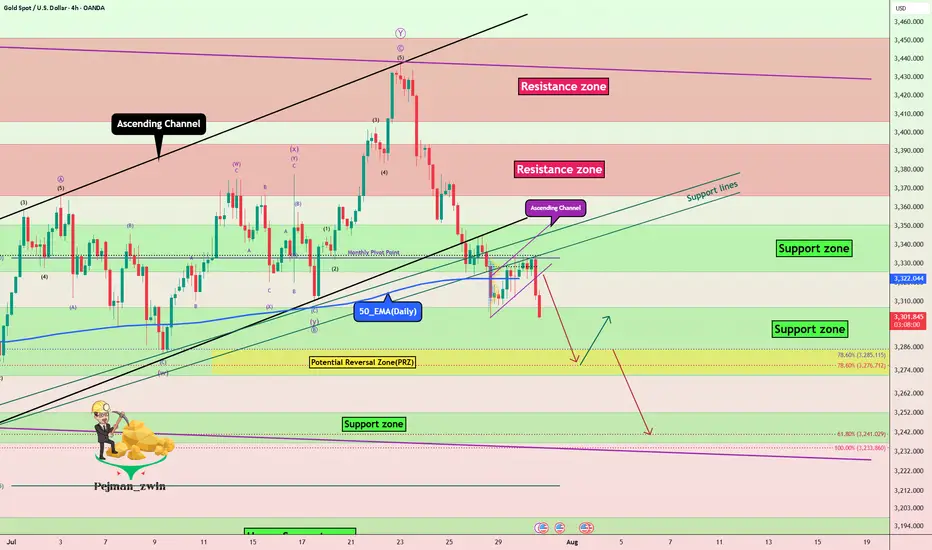
Gold ( OANDA:XAUUSD ) has already managed to break the Support zone($3,350-$3,326) , Monthly Pivot Point , 50_EMA(Daily) , Support lines , and the lower line of the ascending channel . Also, Gold trading below $3,333 plays an important role for me, which can increase the possibility of a continuation of the downtrend .
I expect Gold to drop to at least the Potential Reversal Zone(PRZ) before the FOMO meeting and if the Support zone($3,307-$3,272) is broken, we can expect further declines to $3,253(Second Target) .
--------------------------------
Information we need to know:
How should the Federal Funds Rate be announced to cause a deeper drop in Gold ?
The Fed needs to take a hawkish stance — meaning:
They keep rates unchanged, but make it clear they intend to keep them elevated for a prolonged period.
They emphasize strong economic data like today's solid ADP and GDP numbers .
They express concern that inflationary risks remain, and cutting rates isn’t on the table anytime soon.
In this case, markets get disappointed, rate cut hopes fade, and gold drops as real yields( TVC:US10Y ) rise and the U.S. dollar strengthens.
--------------------------------
Note: Stop Loss (SL) = $3,340
Gold Analyze (XAUUSD), 4-hour time frame.
Be sure to follow the updated ideas.
Do not forget to put a Stop loss for your positions (For every position you want to open).
Please follow your strategy; this is just my idea, and I will gladly see your ideas in this post.
Please do not forget the ✅ ' like ' ✅ button 🙏😊 & Share it with your friends; thanks, and Trade safe.
GOLD trade ideas
DeGRAM | GOLD reached the $3300 level📊 Technical Analysis
● XAUUSD remains capped below a broken trendline retest near 3,355, while price forms a lower-high inside a descending channel.
● The repeated rejection of the 3,357.83 resistance level, coupled with failed bullish continuation, points to renewed downside toward 3,300 and 3,262.
💡 Fundamental Analysis
● A rebound in the DXY after strong US consumer sentiment and pending home sales adds pressure to gold, reaffirming real-yield strength.
● Traders are reducing long exposure ahead of upcoming NFP data and Powell’s next statement, shifting bias away from risk hedges.
✨ Summary
Short bias below 3,355. Break under 3,320 eyes 3,300 → 3,262. Key breakdown risk if lower trendline fails.
-------------------
Share your opinion in the comments and support the idea with a like. Thanks for your support!

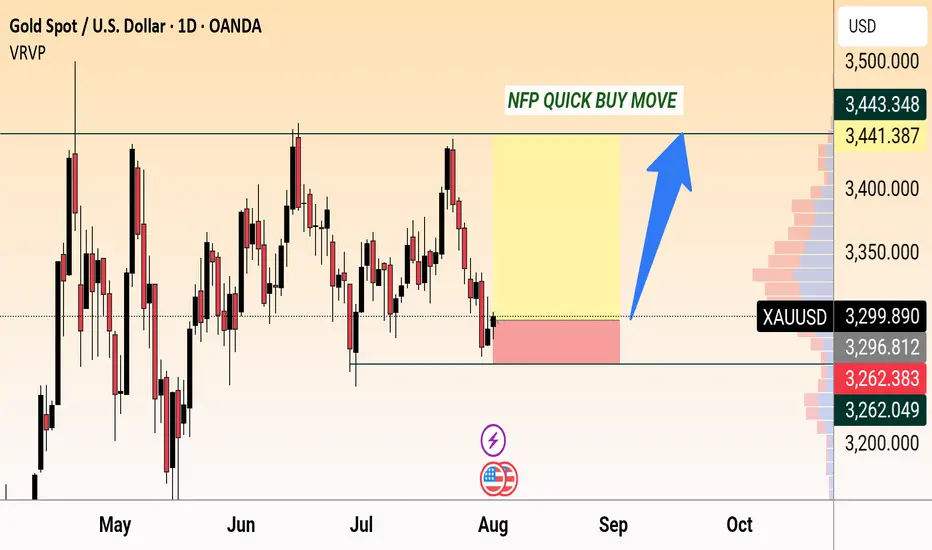
NFP quick buy moveGold (XAUUSD) forms support near 3,262 with a potential bullish move expected on NFP news. Targeting 3,443 resistance zone for a quick buy opportunity.
#XAUUSD: Gold is likely to create a record highGold will be bullish since the US and Russia tension rises, creating uncertainty within the global investors. As of now gold rejected nicely due to negative NFP data affected the US Dollar. We have now two strong fundamentals views that is supporting our view. Please use accurate risk management while trading gold.
Good luck and trade safe. Please like and share for more
Team Setupsfx

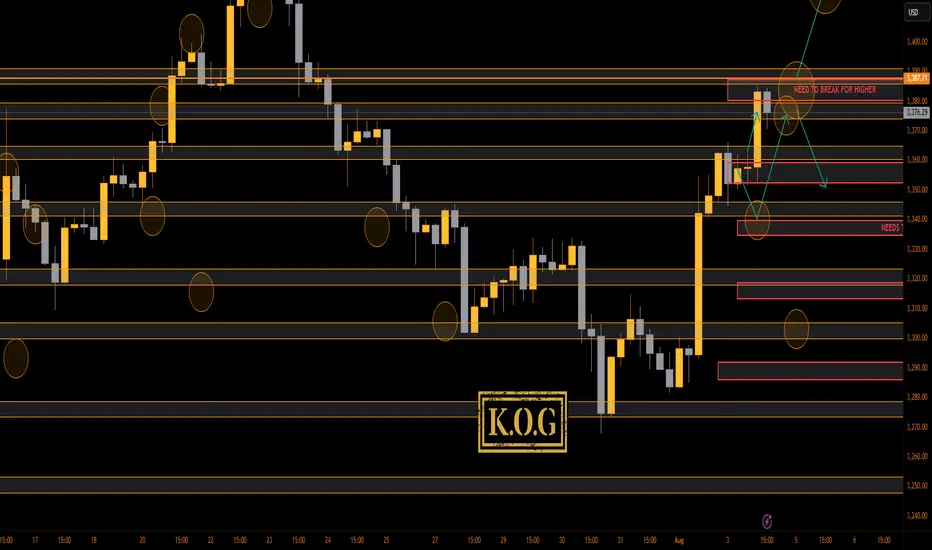
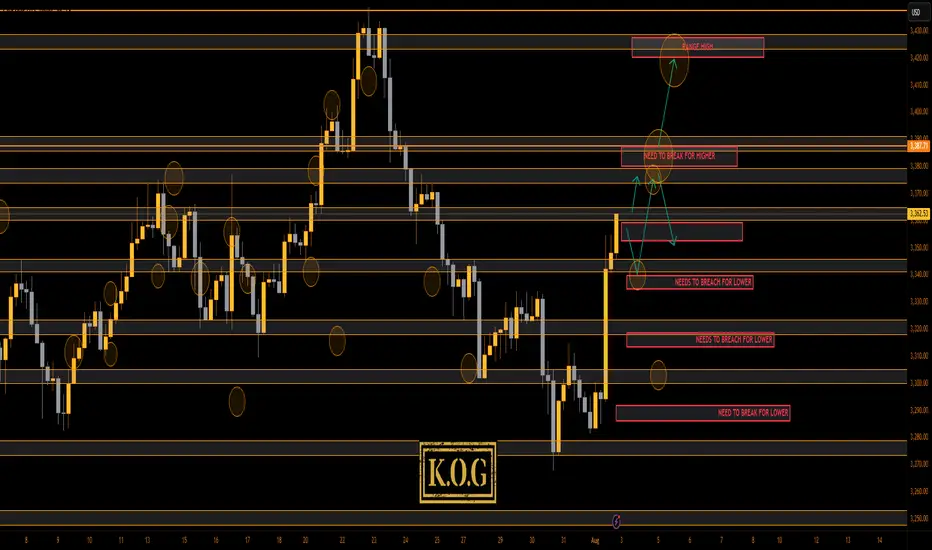
THE KOG REPORT - UpdateEnd of day update from us here at KOG:
Not a bad day at all on the markets with gold holding the 3345-50 support level and giving the push upside as we wanted. We managed to complete our Excalibur targets and hit the ideal target level which was share in the NFP KOG report to complete the move.
Now, we need to play a little caution here as we have bounced the red box box as anticipated and a small RIP is in progress. Support stands at the 3364 level with resistance above 3377. We'll expect there to be a hunt above so lets make sure to protect and manage.
KOG’s bias for the week:
Bullish above 3340 with targets above 3370✅, 3373✅, 3379✅ and above that 3384✅
Bearish on break of 3340 with targets below 3330, 3320 and below that 3310
RED BOXES:
Break above 3365 for 3372✅, 3375✅, 3379✅, 3384✅ and 3390 in extension of the move
Break below 3350 for 3346, 3340, 3335 and 3330 in extension of the move
As always, trade safe.
KOG
Gold 30Min Engaged ( Bearish & Bullish Entry Detected )Time Frame: 30-Minute Warfare
Entry Protocol: Only after volume-verified breakout
🩸Bearish From now Price - 3373
🩸Bullish Reversal : 3341
➗ Hanzo Protocol: Volume-Tiered Entry Authority
➕ Zone Activated: Dynamic market pressure detected.
The level isn’t just price — it’s a memory of where they moved size.
Volume is rising beneath the surface — not noise, but preparation.
🔥 Tactical Note:
We wait for the energy signature — when volume betrays intention.
The trap gets set. The weak follow. We execute.

Lingrid | GOLD Potential Bullish Extension Following Pullback OANDA:XAUUSD is rebounding strongly from the support zone after a deep correction from the previous top near 3,437. The price has broken back above the range and formed a new impulse leg, now hovering just above the upward trendline. As long as the structure holds above 3,330, further continuation toward the 3,410–3,437 resistance zone remains likely. The projected wave path shows a bullish scenario targeting a retest of the top trendline.
📉 Key Levels
Buy trigger: Above 3,360
Buy zone: 3,330–3,340
Target: 3,410
Invalidation: Below 3,320
💡 Risks
Rejection from 3,360 trendline may lead to retracement
Failure to hold above 3,330 support could shift bias bearish
Upcoming macroeconomic data might increase volatility
If this idea resonates with you or you have your own opinion, traders, hit the comments. I’m excited to read your thoughts!

THE KOG REPORT THE KOG REPORT:
Due to there being no KOG Report last week so we won’t reference it, however, we did post the FOMC and NFP reports for the wider community to help them navigate the moves, which as you can see from the pinned ideas worked well.
So, what can we expect in the week ahead?
After the move we observed for NFP on Friday we would like to see some retracement in the sessions ahead. Looking at the 4H chart we have a reversal in play, but we still have no break out of this range! We’re simply playing the highs and the lows while price chops and whipsaws within it, which could be causing some new traders confusion and frustration.
We have a support level below 3350 and below that 3340 which will be the bias level for this week as bullish above. We then have the intra-day resistance level 3365-70 while there is an extension of the move into the 3385 level. Ideally, what we want to see here is support levels hold or a quick continuation on the open into the higher red box levels and the a potential for a RIP. That RIP however is most likely going to be a scalp unless we come down and break below that 3345-50 level.
We want to see how this reacts at these higher levels and if we do get a break of the boxes, otherwise, there is a chance we see another curveball like we suggested a couple of weeks ago, and we correct this whole move back downside with the first hurdle being 3340-35 on the flip.
We’re going to keep it simple here for now and usual we’ll update during the week once we have a clearer understanding of whether this wants to attempt a new all time high or not.
Please note, our liquidity indicator is suggesting a little higher but a pullback is on the way.
We’ll keep you updated.
KOG’s bias for the week:
Bullish above 3340 with targets above 3370, 3373, 3379 and above that 3384
Bearish on break of 3340 with targets below 3330, 3320 and below that 3310
RED BOXES:
Break above 3365 for 3372, 3375, 3379, 3384 and 3390 in extension of the move
Break below 3350 for 3346, 3340, 3335 and 3330 in extension of the move
Please do support us by hitting the like button, leaving a comment, and giving us a follow. We’ve been doing this for a long time now providing traders with in-depth free analysis on Gold, so your likes and comments are very much appreciated.
As always, trade safe.
KOG
XAUUSD – Bears in Control, but Watch for a Rebound FirstYesterday, after a small bounce from the ascending trendline, Gold broke down and printed an intraday low around $3300.
Right now, the market appears bear-dominated, and further downside continuation is likely in the coming days.
________________________________________
📉 But there’s a catch:
From last week's top, Gold has dropped over 1400 pips without any meaningful correction.
That opens the door for a possible short-term rebound, which could be just a setup for new short entries.
________________________________________
📌 Key levels to watch:
• First resistance: $3350
• Major resistance: $3375 – Only a daily close above this level would shift control back to the bulls
🎯 Until then, any bounce is an opportunity to sell into strength.
A break below $3300 opens the path to $3280, with a likely extension toward $3250.
________________________________________
Conclusion:
The trend is bearish, but don’t chase.
Wait for a corrective rally, then look to sell the rip—unless bulls reclaim $3375, it’s still a bear market.
Let’s see if Gold gives us the setup. 🎯
Disclosure: I am part of TradeNation's Influencer program and receive a monthly fee for using their TradingView charts in my analyses and educational articles.
GOLD (XAUUSD): Massive BreakoutGOLD has fallen significantly and closed below an important support level.
The broken structure has now become a strong resistance.
I anticipate further downward movement, with the next support level at 3262.

Gold Bearish Breakdown Setup – Targeting 3324 ZoneGold is showing a potential bearish setup on the 1-hour chart. A break below the key support zone at 3345 could trigger a downward move toward the target at 3324.579. Price action suggests a possible lower high formation before the drop.

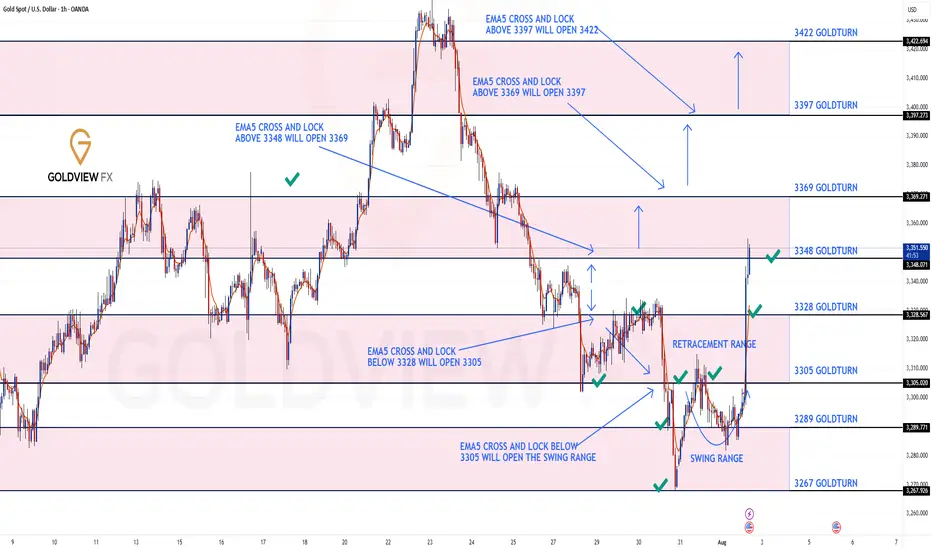
GOLD ROUTE MAP UPDATEHey Everyone,
What a PIPTASTIC finish to the week! 🚀. We tracked the move down with precision durung the week and then rode the momentum right back up.
Yesterday, we confirmed the swing range activation and bounce, and that bullish follow through carried beautifully into today, completing our Bullish Target at 3348. Just perfect execution all around.
BULLISH TARGET
3348 - DONE
BEARISH TARGETS
3328 - DONE
EMA5 CROSS AND LOCK BELOW 3328 WILL OPEN THE FOLLOWING BEARISH TARGET
3305 - DONE
EMA5 CROSS AND LOCK BELOW 3305 WILL OPEN THE SWING RANGE
3289 - DONE
3267 - DONE
We will now come back Sunday with a full multi timeframe analysis to prepare for next week’s setups, including updated views on the higher timeframes, EMA alignments, and structure expectations going forward.
Thanks again for all your likes, comments, and follows.
Wishing you all a fantastic weekend!!
Mr Gold
GoldViewFX
DeGRAM | GOLD reached the resistance level📊 Technical Analysis
● XAUUSD rebounded from the lower channel boundary near 3,294 and reclaimed resistance at 3,357.8, confirming bullish continuation inside the rising structure.
● Breakout above the triangle’s descending resistance line opens upside toward 3,435 and possibly 3,487 on strong momentum continuation.
💡 Fundamental Analysis
● Gold found renewed support as US NFP and ISM data showed softness, weakening the dollar and lowering real yields.
● Rising geopolitical risk and increased central bank gold buying in July continue to support bullish sentiment.
✨ Summary
Long above 3,357. Target 3,435 ➜ 3,487. Setup holds while price stays above 3,294 channel base.
-------------------
Share your opinion in the comments and support the idea with a like. Thanks for your support!

XAU/USD | Bounce in Play – Watching $3350 Support for Next Move!By analyzing the gold chart on the 4-hour timeframe, we can see that after hitting the first target at $3361, gold continued its rally and reached our second supply level at $3385. Upon reaching this key level, the price faced strong selling pressure, dropping over 350 pips down to $3349. Gold is now trading around $3363, and if it can hold above the $3350 support level, we could expect another bullish push. The next upside targets are $3367, $3375, and $3385. This analysis will be updated in the coming hours with your continued support!
Please support me with your likes and comments to motivate me to share more analysis with you and share your opinion about the possible trend of this chart with me !
Best Regards , Arman Shaban

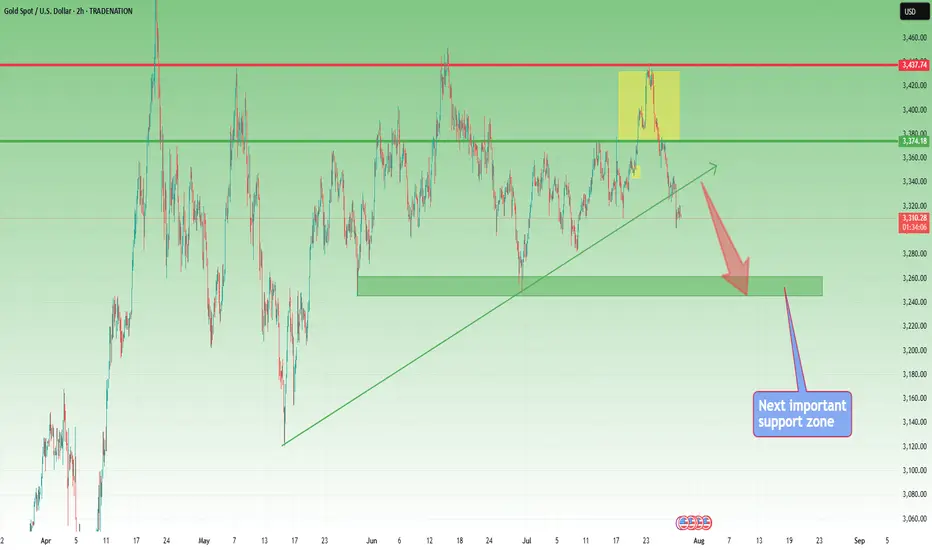
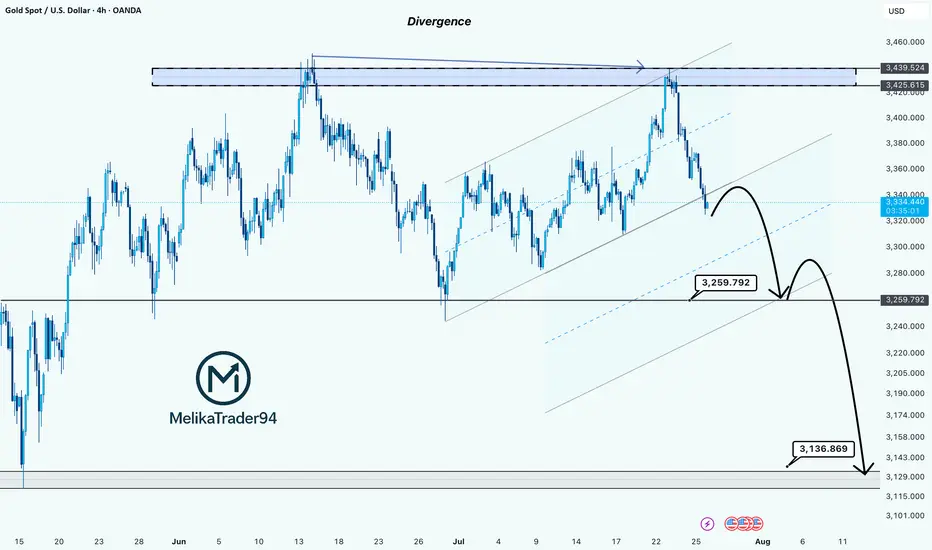
Gold Showing Signs of Reversal After Hitting Key ResistanceHello Guys.
Gold has reached a major resistance zone around 3439–3425, which has already acted as a strong ceiling in the past. The price tapped into this area again, forming a clear divergence, and failed to break higher.
Here’s what stands out:
Divergence signals a weakening bullish momentum at the top.
The price rejected the resistance and is now breaking structure to the downside.
A minor pullback may occur before continuation, as shown in the projected moves.
First target: 3259.792
Second target (if support breaks): 3136.869, a deeper zone for potential bounce or further drop.
This setup hints at a bearish trend building up. Stay cautious on longs unless the price structure changes again.
Gold - The diligent top formation!🏆Gold ( TVC:GOLD ) finished the bullrun:
🔎Analysis summary:
For the past 10 years, Gold has been trading in a very strong expected bullrun. Just like we witnessed it in 2011, a 10 year bullrun is followed by a shorter term bearmarket. Gold is starting to lose its strength, which is a clear sign of weakness and the beginning of a bearish reversal.
📝Levels to watch:
$2.800
SwingTraderPhil
SwingTrading.Simplified. | Investing.Simplified. | #LONGTERMVISION

Gold 4H timeframe Based on the chart my shared (Gold 4H timeframe with Ichimoku cloud), here are the identified target points:
📈 Upside Targets:
1. First Target: 3380
This is marked just above the Ichimoku cloud breakout.
It is a short-term resistance zone.
2. Second Target: 3420
This is the higher target zone indicated in the chart.
It aligns with a previous high and potential resistance area.
---
🟡 Key Support:
Support Zone: Around 3322 – 3353
Price needs to hold above this zone to maintain the bullish momentum.

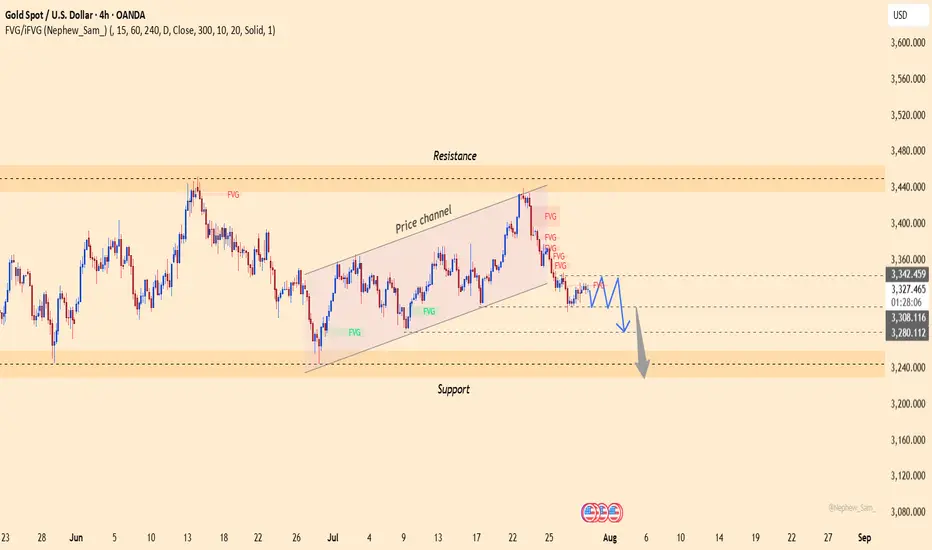
XAUUSD – Downtrend Continues as USD StrengthensGold remains under significant pressure as the U.S. dollar continues to gain strength following a series of positive economic data from the U.S. Specifically, GDP grew by 2.5%, beating expectations, while ADP Non-Farm Employment data also came in strong. This suggests the U.S. economy remains resilient, supporting the Fed's hawkish stance and keeping the dollar strong.
On the 4H chart, XAUUSD has broken below the previous ascending price channel and is now trading under the 3,340.400 resistance zone – an area packed with unfilled FVGs. The current price structure leans bearish, with any rebounds likely to be temporary pullbacks.
If USD strength continues, gold could drop further toward the support zone at 3,279.200 or even lower near 3,240.
Trading Strategy: Focus on SELL
Entry: Around 3,325 – 3,340.400 upon price rejection signals.
Target: 3,279.200 or lower.
Stop-loss: Above 3,342.459
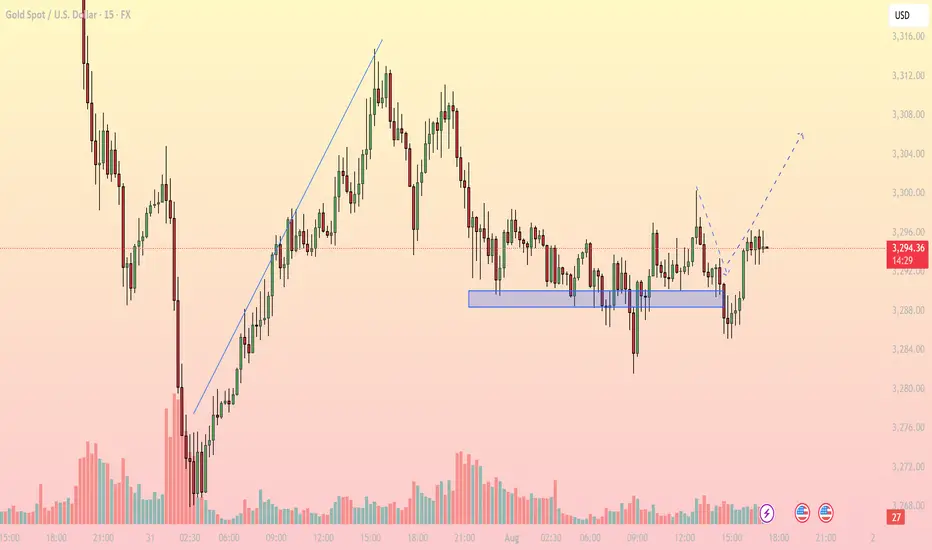
Bullish Rejection from Support, Upside in FocusMarket Overview: On the M15 timeframe, XAUUSD shows signs of a short-term bullish reversal after a prolonged sideways range around the key support zone of 3,286 – 3,289 USD. Price faked out below this support but quickly recovered, forming a V-shape reversal, suggesting strong buying interest has returned.
Key Levels to Watch:
Support Zones:
- 3,286 – 3,289: Strong intraday support, tested multiple times with sharp rejections
- 3,274: Next significant support if the above zone fails
Resistance Zones:
- 3,300 – 3,304: First resistance target aligned with the recent high
- 3,308 – 3,312: Higher resistance area where supply may emerge
Technical Indicators:
EMA: Price has reclaimed the short-term EMAs, indicating bullish momentum on lower timeframes
RSI: Rising above 50 but not yet overbought – there’s room for further upside
Volume: Increasing volume during the bounce confirms buying strength
Trading Strategy:
- Bullish Scenario (Preferred): Entry Zone: Watch for pullback toward 3,290 – 3,292
Stop Loss: Below 3,285
Take Profit 1: 3,300
Take Profit 2: 3,304
Extended Target: 3,308 – 3,312 (if bullish momentum continues beyond breakout zone)
- Bearish Scenario (Alternate): Only valid if price breaks and closes strongly below 3,286
Short Target: 3,274 – 3,270
Note: Counter-trend strategy – higher risk, requires strong confirmation
Conclusion: Gold is showing a bullish price structure on the 15-minute chart. As long as price holds above the 3,286 – 3,289 support zone, the path of least resistance appears to be upward, with 3,300 and 3,304 as the next logical targets. Monitor price action closely during the U.S. session for a potential long setup.
- Follow for more real-time gold trading strategies and save this idea if you find it helpful!
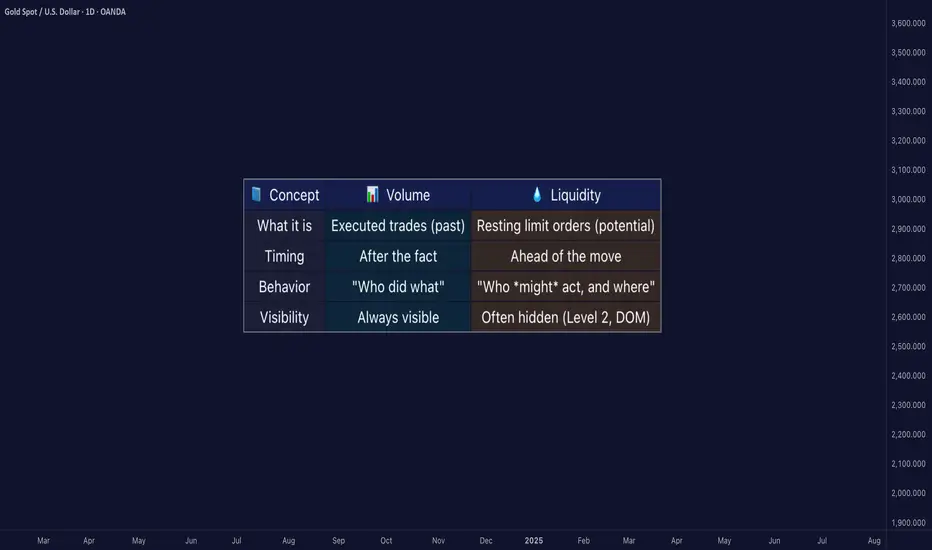
Liquidity ≠ Volume: The Truth Most Traders Never Learn█ Liquidity ≠ Volume: The Truth Most Traders Never Learn
Most traders obsess over volume bars, but volume is the footprint, not the path forward.
If you’ve ever seen price explode with no volume or fail despite strong volume, you’ve witnessed liquidity in action.
█ Here’s what you need to know
⚪ Volume Is Reactive — Liquidity Is Predictive
Volume tells you what happened.
Liquidity tells you what can happen.
█ Scenario 1: Price Jumps on Low Volume
❝ A price can jump on low volume if no liquidity exists above.❞
⚪ What’s happening?
The order book is thin above the current price (i.e., few or no sellers).
Even a small market buy order clears out available asks and pushes price up multiple levels.
Volume is low, but the impact is high because there’s no resistance.
⚪ Implication:
This is called a liquidity vacuum.
It can happen before news, during rebalancing, before session openings, on illiquid instruments, or during off-hours.
Traders often overestimate the strength of the move because they only see the candle, not the absence of offers behind it.
█ Scenario 2: Move Fails on High Volume
❝ A move can fail on high volume if it runs into a wall of offers or bids.❞
⚪ What’s happening?
There’s a strong surge of aggressive buying or selling (high volume).
But the order book has deep liquidity at that level — large resting limit orders.
The aggressive traders can’t chew through the liquidity wall, and price stalls or reverses.
⚪ Implication:
This is called liquidity absorption.
Market makers or institutions may intentionally absorb flow to stop a breakout.
Many retail traders mistake this for “fakeouts,” but it’s really liquidity defending a level.
⚪ What the Research Says
Cont, Stoikov, Talreja (2014): Price responds more to order book imbalance than trade volume.
Bouchaud et al. (2009): Liquidity gaps, not trade size, are what truly move markets.
Hasbrouck (1991): Trades only impact price if they consume liquidity.
Institutions don’t chase candles — they model depth, imbalance, and liquidity resilience.
⚪ Where the Alpha Lives
Liquidity tells you where the market is weak, strong, or vulnerable — before price moves.
Fakeouts happen in thin books.
Reversals occur at hidden walls of liquidity.
Breakouts sustain when liquidity follows the price, not pulls away.
If you understand this, you can:
Enter before volume shows up
Avoid chasing dead breakouts
Fade failed moves into empty space
█ Final Truth
Volume is the echo. Liquidity is the terrain. Alpha is in reading the terrain. You want to study the structure, because price moves toward weakness and away from strength. Learn to see where liquidity is, or where it’s missing, and you’ll see trading with new eyes.
-----------------
Disclaimer
The content provided in my scripts, indicators, ideas, algorithms, and systems is for educational and informational purposes only. It does not constitute financial advice, investment recommendations, or a solicitation to buy or sell any financial instruments. I will not accept liability for any loss or damage, including without limitation any loss of profit, which may arise directly or indirectly from the use of or reliance on such information.
All investments involve risk, and the past performance of a security, industry, sector, market, financial product, trading strategy, backtest, or individual's trading does not guarantee future results or returns. Investors are fully responsible for any investment decisions they make. Such decisions should be based solely on an evaluation of their financial circumstances, investment objectives, risk tolerance, and liquidity needs.
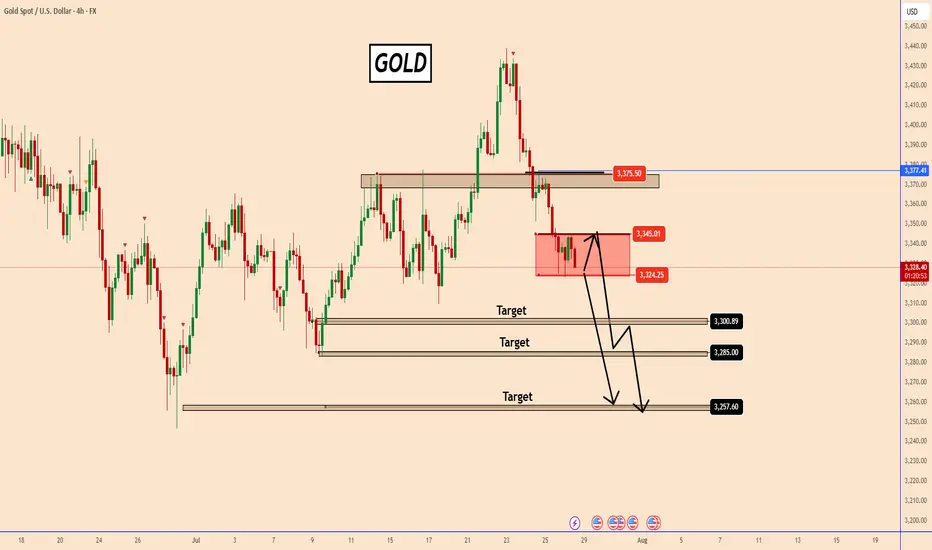
Gold : Holding Ground Below 3345 Amid USD SurgeGold : Holding Ground Below 3345 Amid USD Surge
Gold's upward potential from Friday appears limited by the 3345 level—a narrow but firm resistance zone. As long as price fails to break above it, this zone has a high importance.
If gold holds below 3345, the probability of further downside increases significantly.
Meanwhile, the recent US–EU agreement has strengthened the USD. While this isn’t expected to severely impact gold, short-term fluctuations can’t be ruled out.
If price stabilizes in the red zone, it may consolidate ahead of the upcoming FOMC meeting. In such cases, volatility could erupt based on news-driven catalysts—so be prepared for unexpected moves.
You may find more details in the chart!
Thank you and Good Luck!
PS: Please support with a like or comment if you find this analysis useful for your trading day
XAU/USD Buy Setup 1H Analysis Trendline breakout.Instrument: Gold Spot / USD
Timeframe: 1H (1 Hour)
Chart Tools Used:
Ichimoku Cloud
Trendline breakout
Target projection (highlighted in blue arrow and price levels)
Volume not shown directly but momentum is clear from breakout
---
💹 Buy Setup Analysis
✳ Current Price: $3,362.895
🔼 Entry (Buy): Around $3,363.590 (as marked on the chart)
🎯 Targets:
Target Number Price Level Approx Gain % Move
1st Target $3,393.481 ~$30 ~0.89%
2nd Target $3,433.864 ~$70 ~2.06%
🔻 Stop-Loss (Suggested): Below Ichimoku Cloud, ideally near $3,315.860 or $3,322.672
---
🧠 Strategy Logic
The chart shows a clean bullish breakout of the trendline and Ichimoku cloud.
Strong upward momentum candle confirms the breakout.
Targets are based on measured move and previous resistance zones.
Volume and sentiment look bullish, aligning with the breakout.
A pullback to the breakout zone (~$3,340–$3,350) would be healthy for re-entry.
---
📝 Summary of Buy Setup
Parameter Value
Entry $3,363.590
Target 1 $3,393.481
Target 2 $3,433.864
Stop-Loss $3,322.672–$3,315.860 (zone below cloud)
Risk-Reward ~2:1 to 3:1 based on SL/TP choice

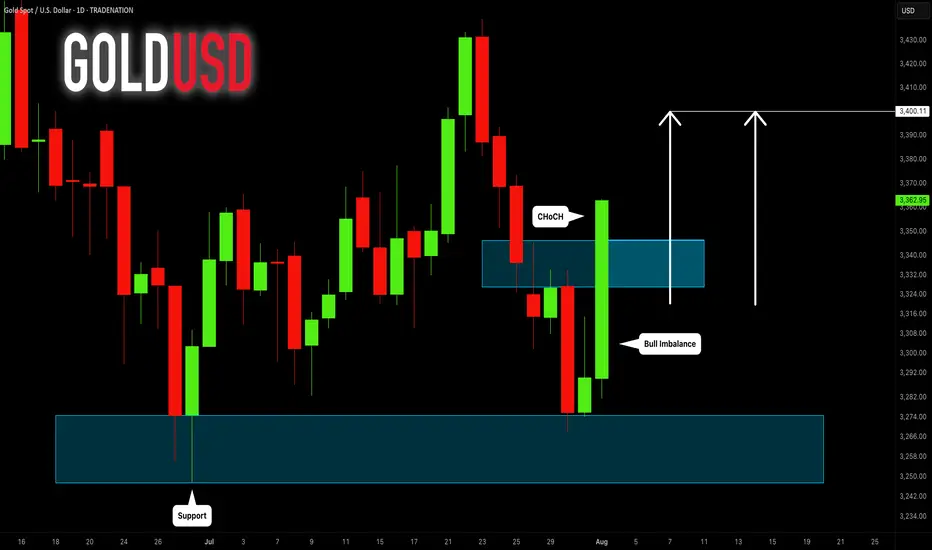
GOLD (XAUUSD): Move Up Ahead?!
Friday's fundamentals made Gold very bullish during the New York session.
The price formed a high momentum bullish candle on a daily,
breaking a minor daily resistance area.
It gives us a confirmed Change of Character CHoCH and indicates
a highly probable bullish continuation next week.
I think that the price will reach 3400 level.
❤️Please, support my work with like, thank you!❤️
I am part of Trade Nation's Influencer program and receive a monthly fee for using their TradingView charts in my analysis.