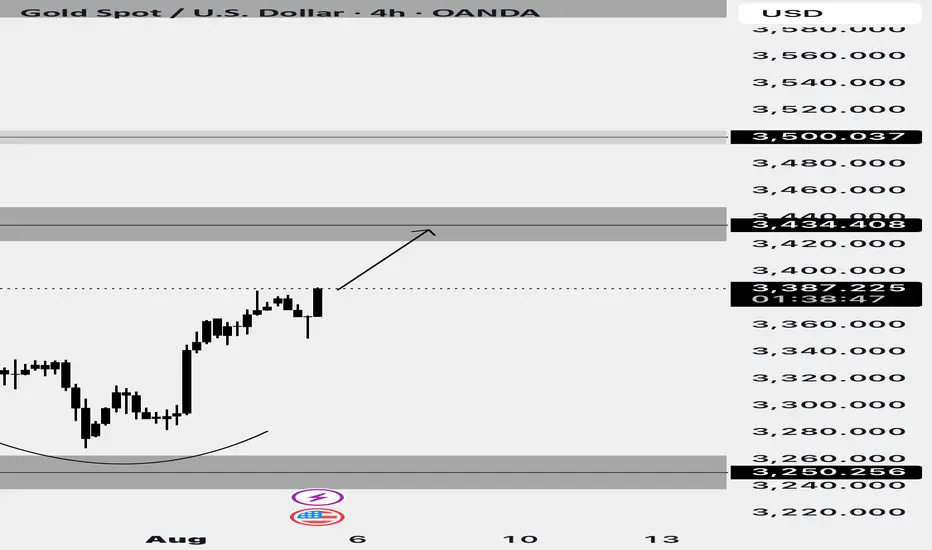
TRADE UPDATE XAUUSD Hey everyone at the start of the week we was waiting to see if price would pullback to 3,250 zone to take buys after price missed our entry just a little bit of pips if you check out my last few posts but my projections for Gold is that price might be heading to 3434 zone and can’t see a pullback to our area of interest and if price get to the 3434 zone I will be waiting to see if sellers would jump in or I wait for a breakout so I will update you guys before the week ends or if am about to execute a trade….
GOLD trade ideas
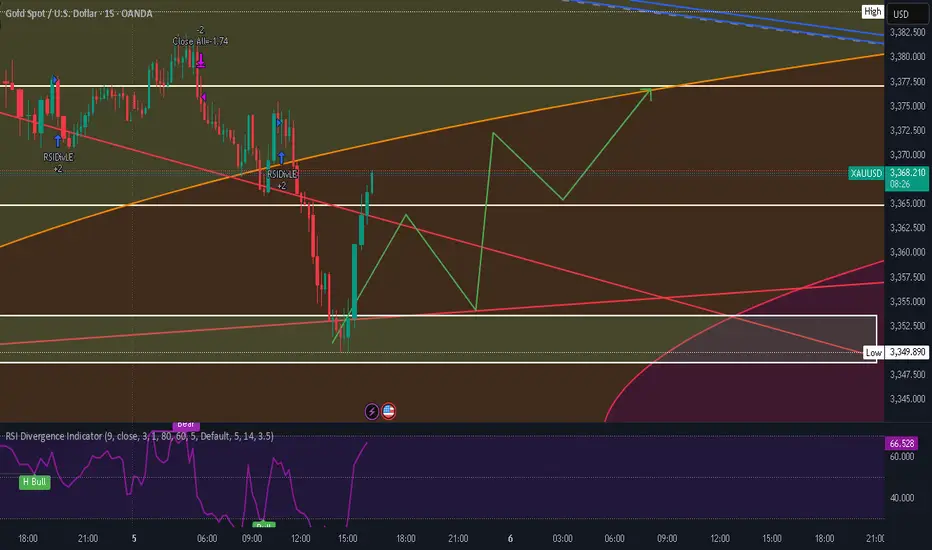
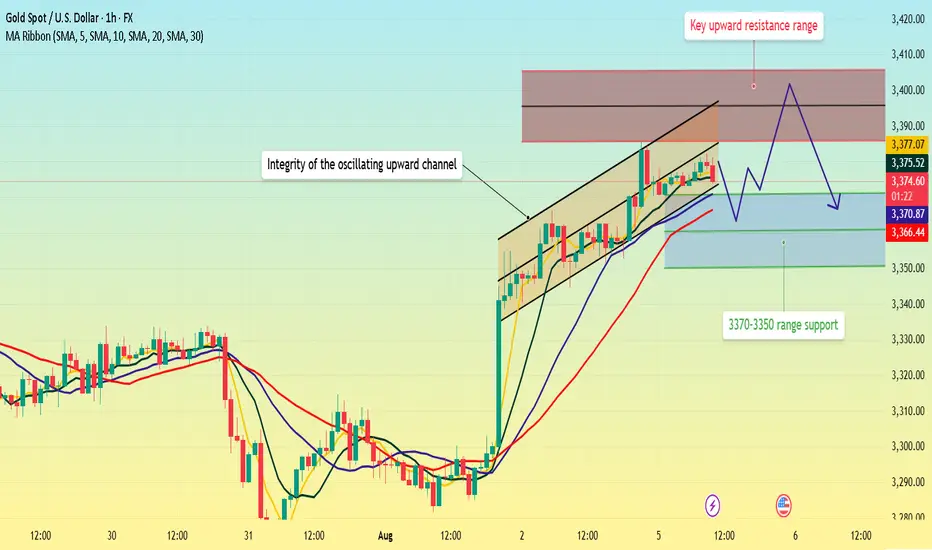
XAUUSD Critical movement !!!The 3351 4h frame was so critical as I said and showed the movement will make the decision.
Flying now with
tp : 3385
tp:3400
tp : 3413
Better wait for another confirmation on the breaker block 3370 closing above it with green candle . push the price higher as showed
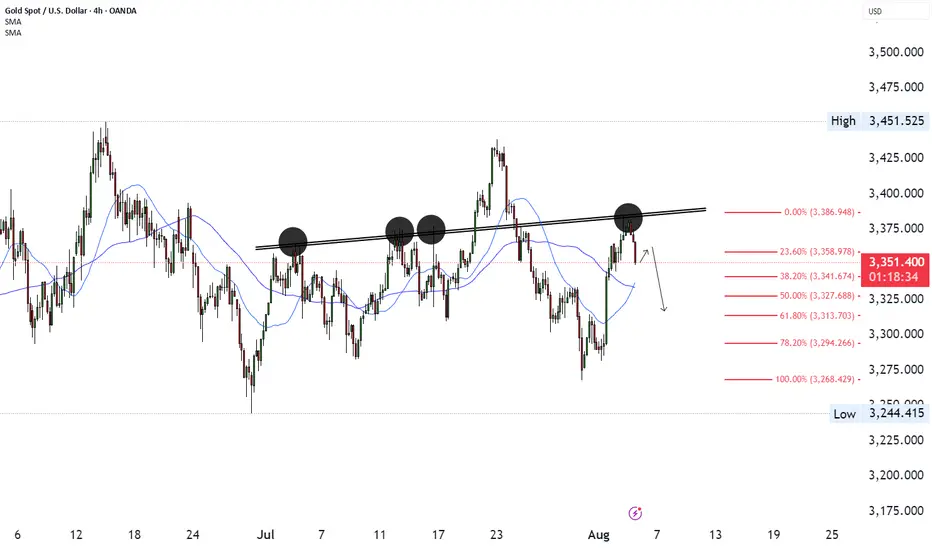
GOLD POSSIBLE SHORT (LT Buy Oriented)Things are starting to calm down. Gold might see a shift in demand and calm down.
XAUUSD 3300 NEXT?#XAUUSD With that massive rejection off the resistance! 🔴
My Next targets for this correction are 3341 and 3327.
If this gets driven by some catalyst, then we might see 3313 and even 3293 depending on the strength!
Gold (XAU/USD)Gold (XAU/USD) — price rejected resistance zone (~3380), potential move towards 3223 support.
#XAU

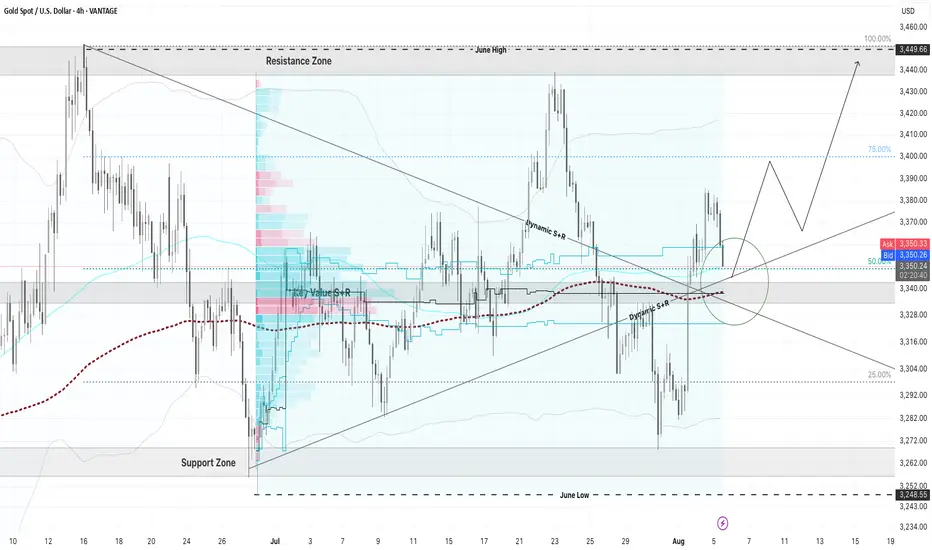
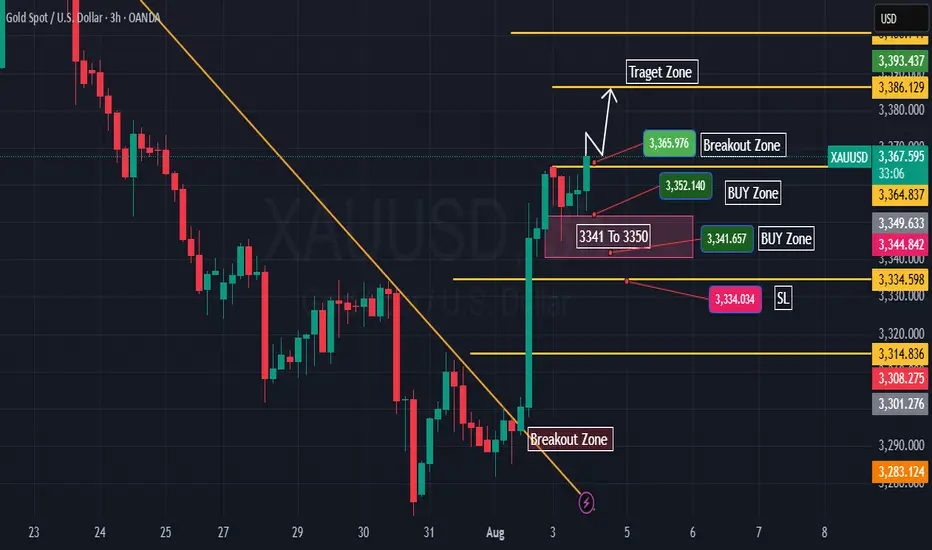
Gold Traders Pay Attention! Major Moves Incoming ? XAU/USD is setting up for a monster move — and all the signs are lining up! 👇
This is a perfect storm of technical confluence you don’t want to miss:
📊 After weeks of consolidation, gold has just broken out of a downtrend, retested the zone, and is now sitting on a major decision point. This zone is packed with:
✅ A dynamic trendline flip (was resistance, now acting as support)
✅ 200 EMA cushioning the retest
✅ 50% Fibonacci retracement aligning perfectly
✅ High-volume node from the volume profile = big player interest
✅ Mid-Bollinger Band offering bounce potential
✅ Strong bullish market structure forming
All eyes are on this green circle zone— a critical battle between bulls and bears. If bulls win here, we could see a powerful move straight into the upper resistance zone, possibly breaking previous June highs! 🦍💥
This is what smart money setups look like — multiple confirmations, clean structure, and asymmetric reward potential. 🔑📈
Tag a gold trader who needs to see this, and drop a ⚡️ if you're locked in on this breakout setup!
VANTAGE:XAUUSD FOREXCOM:XAUUSD EIGHTCAP:XAUUSD
Gold is fluctuating at a high level. Latest analysis.On Monday, gold surged to around 3370 in the morning before retreating slightly. It fell back to support near $3345 in the European session. The dividing line between bulls and bears lies below 3340, which also marks the support level and the top-bottom reversal before the close of last Friday's non-farm payroll report.
Quaid planned to go long near 3340 on Monday, but the price rebounded to 3345, halting its decline and then fluctuating sideways, preventing an entry opportunity. However, a short opportunity near 3385 was successfully implemented with a slight pullback. Although it did not reach the expected target, a small profit was achieved after the pullback to 3370.
Monday showed an overall upward trend, with the closing price fluctuating at a high level, reaching a high around 3385 before retracing to confirm 3370. The overall market trend remains upward, with a temporary potential for a move to around $3400. Quaid recommends a buy-on-low strategy today. Currently, the 1-hour moving average is trending flat, and the trend of prices continuing to fluctuate at high levels cannot be ruled out.
Support for Tuesday's pullback lies near 3370. The key to a renewed rally lies at 3360, also the level of resistance before Monday's US market opening. As long as this level remains intact, the overall strategy remains unchanged. Alternatively, watch for a re-break of 3385, with upside targets at 3385-3390-3400.
Strategy:
Long at 3360-3365, stop-loss at 3355, profit range at 3380-3400;
Short at 3395-3400, stop-loss at 3410, profit range at 3370-3350;
Key Points:
First Support Level: 3370, Second Support Level: 3360, Third Support Level: 3350
First Resistance Level: 3385, Second Resistance Level: 3395, Third Resistance Level: 3405.
8/5: Watch for Short Opportunities Near 3400Good morning, everyone!
On Wednesday, gold held above the key support area at 3343–3337, and subsequently broke through the 3372–3378 resistance zone, leading to a strong bullish move and solid long-side gains.
Today, attention should shift to the major resistance around 3400. If bullish momentum continues, price may approach the secondary resistance near 3420. However, from a technical perspective, signs of bearish divergence have begun to emerge. Should price continue rising while momentum weakens, the risk of a short-term correction increases accordingly.
Key levels to monitor:
Primary resistance zone: 3404–3416
Intermediate supply area: around 3398
Crucial support zone: 3372–3363 (a hold here could support further upside)
⚠️ Cautionary Note:
The US PMI data release during the New York session could introduce volatility. Be sure to maintain strict risk management and stop-loss discipline during periods of increased uncertainty.
🔁 Trading Bias for Today:
Prefer selling into strength near resistance, while cautiously considering buying on dips near support.
The 3343–3337 area continues to serve as the primary support zone, and price action around this level will be critical in determining the next directional move
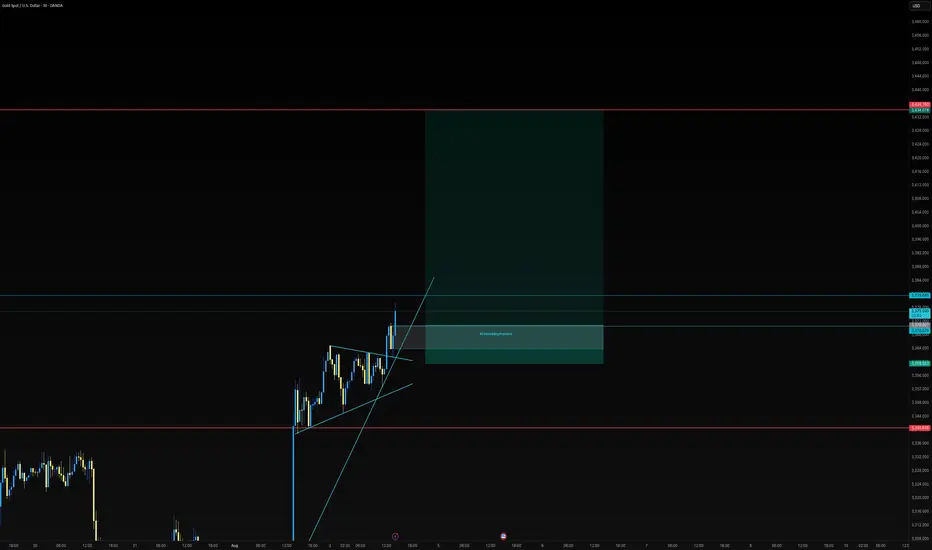
GOLD is Flying High, I won't miss the rocketConfirmation:
If 4H price action closes above Previous Day's High (PDH), I will be looking for longs.
Within my Area of Opportunity (AoO), I have outlined targets with their success rate.

180 Pips Secured on GOLD! | Sniper Strategy in Action📈 Tired of Gold Trades Going Against You? This Sniper Strategy Just Bagged +180 Pips!
Hello Traders,
Struggling with XAUUSD’s volatility?
Taking small wins but suffering big losses?
You’re not alone — and we’ve built something just for you.
🔥 Introducing GOLD SNIPER — a high-probability strategy engineered for serious Gold traders.
With a consistent 1:2 risk-reward and precision entry logic, it’s designed to help you ride big moves and avoid common traps in XAUUSD.
🚀 Today’s Live Trade Recap:
Signal 1
🟢 Buy @ 3355.91
🔴 SL @ 3349.91
🟢 TP @ 3367.91
✅ Result: +120 Pips
Signal 2
🟢 Buy @ 3368.32
🔴 SL @ 3362.32
🟢 TP @ 3380.32
❌ Result: -60 Pips
Signal 3
🟢 Buy @ 3373.29
🔴 SL @ 3367.29
🟢 TP @ 3385.29
✅ Result: +120 Pips
📊 Total Profit Today: +180 Pips
✅ What Makes Gold Sniper So Effective?
✔️ Catches real momentum, not noise
✔️ Keeps entries & exits disciplined and mechanical
✔️ Aims for high-reward trades, not scalp scraps
🎯 Want better entries and more consistent wins on XAUUSD?
📩 DM us now to get instant access and start using Gold Sniper on your TradingView chart.
If this helped you, like the idea and drop a comment — let’s grow together!
Happy Trading,
InvestPro India

In-depth Analysis of the Gold Bull-Bear Game on August 4th:
I. Gold's Current Core Contradiction
Bull Support Factors
Weak non-farm payroll data reinforces expectations of a Fed rate cut, with the market betting on an over 80% probability of a September rate cut.
Risk Aversion: Although the tariff extension has not yet been finalized, the market remains concerned about escalating trade frictions, and gold is in high demand as a safe-haven asset.
Technical Breakout: Friday saw a strong breakout above the 3340-3350 resistance zone, with the daily chart showing a positive enveloping negative trend. Short-term bullish momentum prevails.
Potential Short-Term Opportunities
Monthly Top Signal: Consecutive high-level doji candlesticks with long upper shadows suggest medium-term selling pressure.
Fundamental Bearish Hidden Dangers:
The Fed's independence remains, and Powell may not cut interest rates prematurely due to pressure from Trump.
II. Key Technical Signals
1. Weekly Level: Range Unbroken
The 3268-3438 range persists, currently nearing its upper limit, so be wary of a pullback.
Bollinger Bands are converging, with the MA5/MA10 convergence signaling an approaching market reversal window.
2. Daily and short-term cycles: Overbought correction needs
After Friday's surge: 4-hour/1-hour RSI is overbought, the Bollinger Band opening is unsustainable, and a technical retracement is needed.
Key positions:
Resistance: 3376 (previous high) + 3385 (Fibonacci expansion level);
Support: 3340 (top and bottom conversion) + 3315 (bull defense line).
3. Triangle convergence pattern:
If it opens high and breaks through 3376 on Monday, August 4, it may test 3400; if it opens low and falls below 3340, it will look down to 3315-3280.
III. Operation strategy for next week on August 4
(1) Response to three opening scenarios
Scenario 1: Opening high (above 3370)
Strategy: Short in batches in the 3376-3385 area, stop loss at 3400, target 3340→3315.
Logic: Positive overdraft + technical overbought, betting on a pullback.
Scenario 2: Flat opening (around 3360)
Strategy: If the price rises from 3366 but does not break through, go short with a light position, stop loss at 3376, target 3340; if it falls below 3340, go short and look at 3315.
Alternative: If the support at 3340 is effective, go long, stop loss at 3330, target 3360.
Scenario 3: Low opening (below 3340)
Strategy: Go long in the 3338-3340 area, stop loss at 3325, target 3360; if it breaks through 3315, go short.
(2) Mid-term layout
Short opportunity: Go short in the 3385-3400 area, stop loss at 3420, target 3245 (monthly support).
Buy opportunity: If the price falls back to 3315-3280 at the beginning of the week and stabilizes, go long in the mid-term, stop loss at 3260, target 3400.
IV. Risks and Warnings
Beware of institutional manipulation: Friday's late-day surge may be a trap for buying; beware of a flash crash at Monday's opening.
Data disturbance: Pay close attention to the speeches of Fed officials. If inflation rebounds or hawkish remarks are made, it will be bearish for gold.
Undetermined trend: The market is still volatile and unilateral trends need to wait for confirmation of a breakthrough in the range.
Conclusion
Short-term: Prioritize shorting in the 3370-3385 area, and enter long positions in the 3340-3315 area when appropriate, maintaining strict stop-loss orders.
Mid-term: The monthly bearish pattern has not changed, and above 3385 is the ideal entry point for short positions.
Key Strategies: "Don't chase long positions during strong resistance; don't sell short during deep declines; follow the trend after a breakout; exercise caution in controlling the market."
GOLD: Next Move Is Down! Short!
My dear friends,
Today we will analyse GOLD together☺️
The price is near a wide key level
and the pair is approaching a significant decision level of 3,372.04 Therefore, a strong bearish reaction here could determine the next move down.We will watch for a confirmation candle, and then target the next key level of 3,363.00..Recommend Stop-loss is beyond the current level.
❤️Sending you lots of Love and Hugs❤️

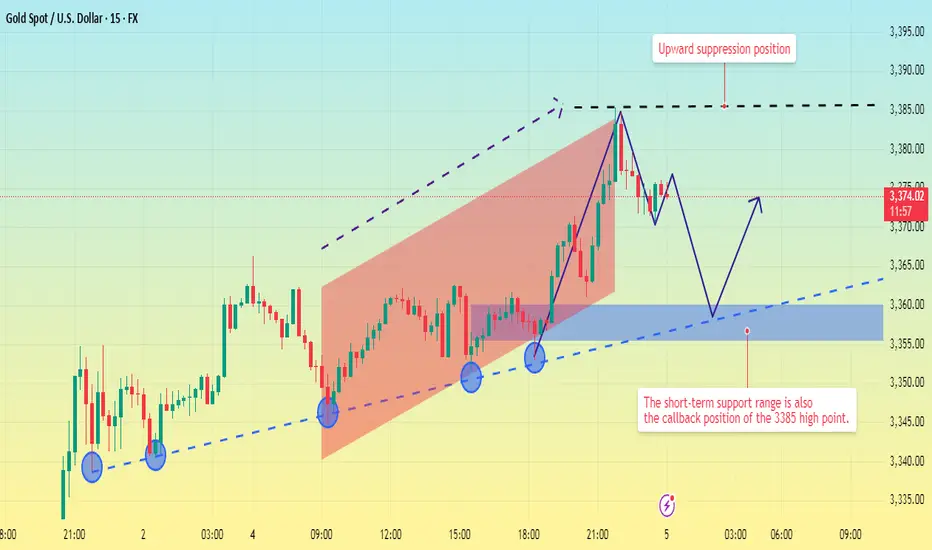
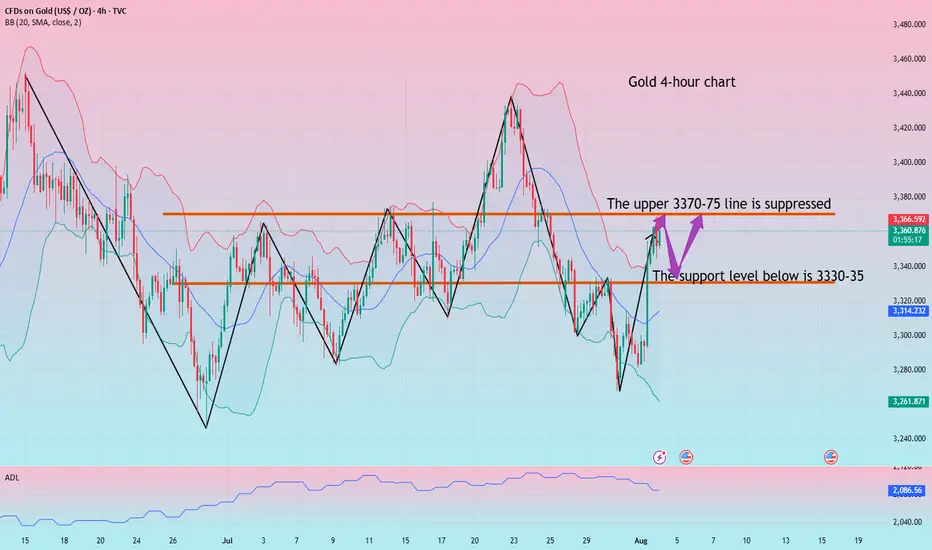
Upward movement suppressed. Price pullback?Gold prices have now perfectly reached the short-selling target range predicted by Quaid.
The current 4-hour chart clearly shows that gold's current resistance level remains around 3385.
Looking at the shorter 15-minute chart, gold has been slowly rising within an upward channel today. The resistance level of 3385 has not been effectively broken, and there is a high probability of a further pullback to test the 15-minute trendline.
Currently, 15-minute trendline support remains around 3355-3360. Focus on this support range in the short term, as it also represents a profit-taking opportunity after shorting at the 3385 high. This level can also be considered a watershed between bulls and bears. If the price pulls back to this level and does not continue to decline, there is a high probability of another upward move at this level.
However, if it falls below the 3350 trendline, the market will enter a downward trend.
Good luck to everyone in the new week.
4H Gold/USD - Decoding the liquidity zones 📈 Smart Money Concept: Liquidity Grab & Market Shift
This 4H Gold/USD chart shows a classic liquidity sweep below a key level (Sell-side liquidity) followed by a CHoCH (Change of Character) — signaling a bullish market structure shift. A fair value gap (FVG) is formed as price aggressively breaks previous highs, offering a clean entry point on the retest.

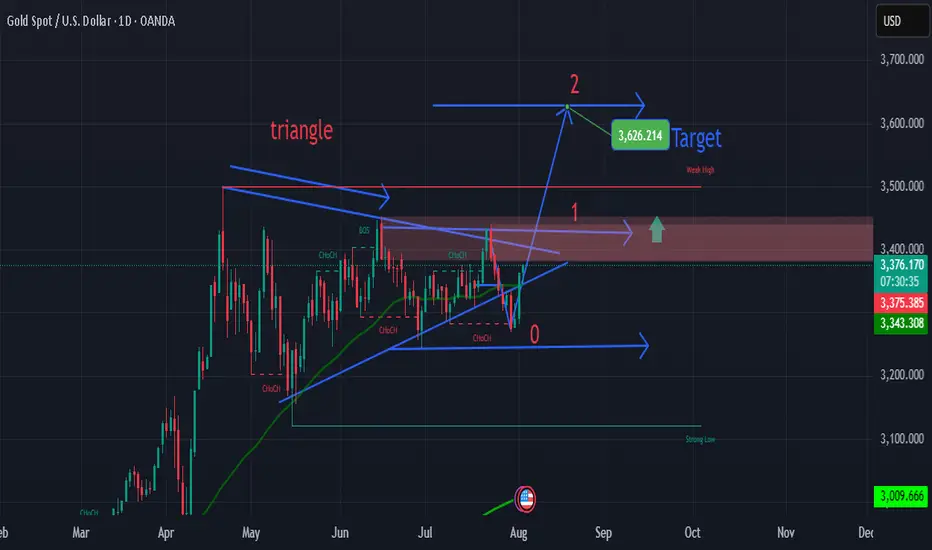
XAU/USD DAILY - TRIANGLE BREAKOUT CONFIRMED Gold has just broken out of a symmetrical triangle after several weeks of price compression. The price bounced cleanly from the lower trendline (point 0), signaling completed accumulation. The projected target based on the triangle breakout is $3,626, with a protective stop loss at $3,340. Clean breakout with strong indicator confluence. One to watch closely 👀
🎯 Take Profit (TP): 3,626
🛡️ Stop Loss (SL): 3,340
📈 Buy Confidence Level: 88%
🔍 Pure technical analysis – not financial advice.
#Gold #XAUUSD #Breakout #TechnicalAnalysis #TrianglePattern #TradingView #PriceAction
XAUUSD Outlook – From Bias to Execution Previous day (Friday) closed bullish, leading to a buy bias on XAUUSD, Narrowing down to the 4H timeframe, I identified my recent and important supply and demand zones, On the 45M timeframe, I then looked out for a possible entry and exit zone.
XAUUSD Signal Today | Do you think Gold will retest $3400XAUUSD Buy Sell Signal Today | Do you think Gold will retest $3400 resistance? Every gold trader should watch today! In this video, we have the latest XAUUSD technical analysis and provide clear buy and sell levels for scalpers and swing traders. If you want to know if Gold will retest $3400 resistance, stay tuned until the end for exclusive insights, real chart breakdowns, and the best price action strategies. This video will help both new and professional traders make smart trading decisions with live examples and updated gold signals.
#GoldPrice
#XAUUSD
#GoldSignal
#GoldTrading
#TechnicalAnalysis
#GoldForecast
#BuySellSignal
#GoldResistance
#ForexTrading
#livegoldanalysis
Gold falls back and looks for opportunities to go long
Bullish momentum remains the primary trend. The market opened higher near 3368 before experiencing a period of volatile decline under pressure. Technically, the market has tested resistance and needs to adjust. Overall support at higher levels has also weakened, so it's best not to chase the market too much. Opportunistically, buy on dips and stabilization before buying.
From a 4-hour analysis, short-term resistance is expected to be near 3370-3375, with a key resistance area at 3395-3400. Support is expected at 3330-35, so consider buying on dips. In the middle, maintain a cautious wait-and-see approach. I'll provide detailed trading strategies during the trading session, so stay tuned.
Gold Trading Strategy:
Buy on dips to 3330-35, with a stop-loss at 3318 and a target at 3370-3375. Continue holding if the market breaks above.
Gold XAUUSD Weekly Analysis 4-8 August 2025XAUUSD Weekly Outlook (SWING)
Price is currently approaching a crucial resistance and supply zone between 3363 – 3373. This area has historically acted as a strong rejection point and remains a significant decision level for upcoming market direction.
Bullish Scenario:
If price breaks and closes above the 3363–3373 zone and later retests it successfully—potentially around the 3400 level—this would indicate a bullish market structure shift. A strong reaction from the retest could open the path toward 3438, with a possible extension to 3500.
Bearish Scenario:
Alternatively, a rejection from the 3363–3373 supply zone without a confirmed breakout would likely trigger a downside move, targeting the lower demand area near 3250.
This 3363–3373 zone remains the key pivot. Watch for price action confirmation to validate either scenario.

GOLD SHORT TRADE VIEWAronnoFX will not accept any liability for loss or damage as a result of
reliance on the information contained within this channel including
data, quotes, charts and buy/sell signals.
If you like this idea, do not forget to support with a like and follow.
Traders, if you like this idea or have your own opinion, please feel free command me.

Gold (XAU/USD) Technical Analysis – NeoWave Perspective📅 August 2025 | 📈 4H Chart
📍Posted by: @ CryptoPilot
Gold completed a corrective Wave A near $3160 at the bottom of the descending channel. It then rallied to $3440, followed by a decline toward the channel’s midline at $3227, beginning a potential Wave C.
Attempts to break and hold above the channel failed. Price has since broken below the trendline and is now pulling back to retest it from below.
⸻
🔍 Key Insights:
• 📉 No long entries recommended at current levels
• ✅ Bullish confirmation requires a clear breakout and close above the channel top
• 🛒 Safer long setup may emerge near $3120 at the channel bottom and possible Wave C completion zone.
⸻
🔑 Key Levels:
• Resistance: $3380–$3440
• Support: $3120
• Invalidation / Stop-loss: Below $3110
⸻
📌 Follow @ CryptoPilot for more wave structure insights, SMC confluence, and multi-timeframe strategies.
💬 Drop your thoughts and alternate counts in the comments below!

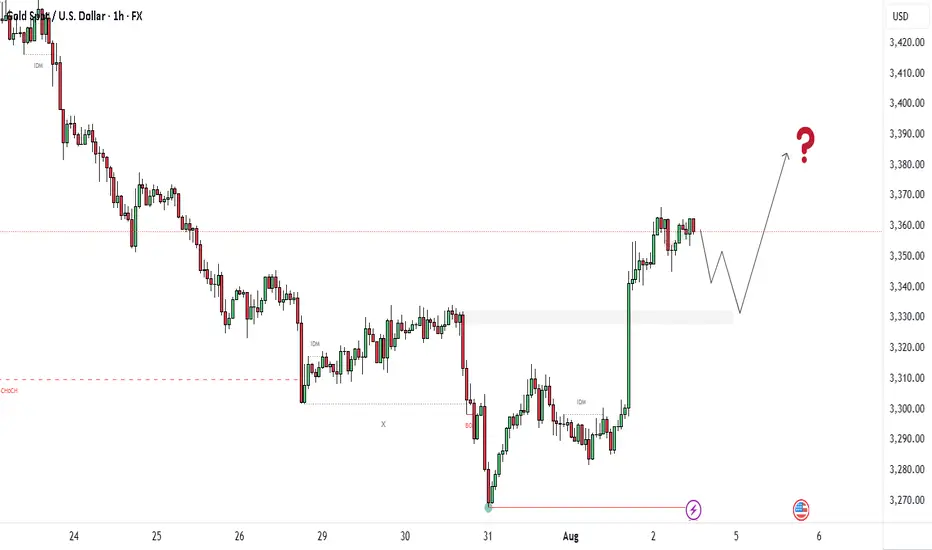
GOLD/USD – 1H ChartGold has recently shown a clear Change of Character (CHoCH) near the 3275 level, signaling a potential shift from bearish to bullish momentum. After a strong downtrend, the market formed a base and then launched an aggressive bullish rally, breaking previous structure and indicating a possible trend reversal. Currently, price is consolidating around the 3350–3360 zone, just above a key demand zone between 3330 and 3340, which is likely to act as a support area. This zone also aligns with a previous supply area that has now flipped into demand, confirming smart money interest.
The projected move shows a potential short-term dip into this demand zone before continuing the upward push toward the 3370–3390 range, where buy-side liquidity is likely resting. This level could act as a near-term target or resistance. If price holds above 3330 and shows bullish confirmation (like an engulfing pattern or FVG reaction), buyers could look for opportunities with targets near 3370 and 3390. However, if the price breaks below 3330 with strong bearish momentum, the bullish bias may be invalidated, and we could see further downside.
Overall, the structure is bullish, but traders should watch for a retest of the demand zone before entering long positions. Risk should be managed carefully with stops below 3330.
What You Should Watch:
Entry confirmation around 3,335–3,340 with bullish engulfing or FVG reaction
Set TP1 = 3,370
TP2 = 3,390
SL = Below 3,330
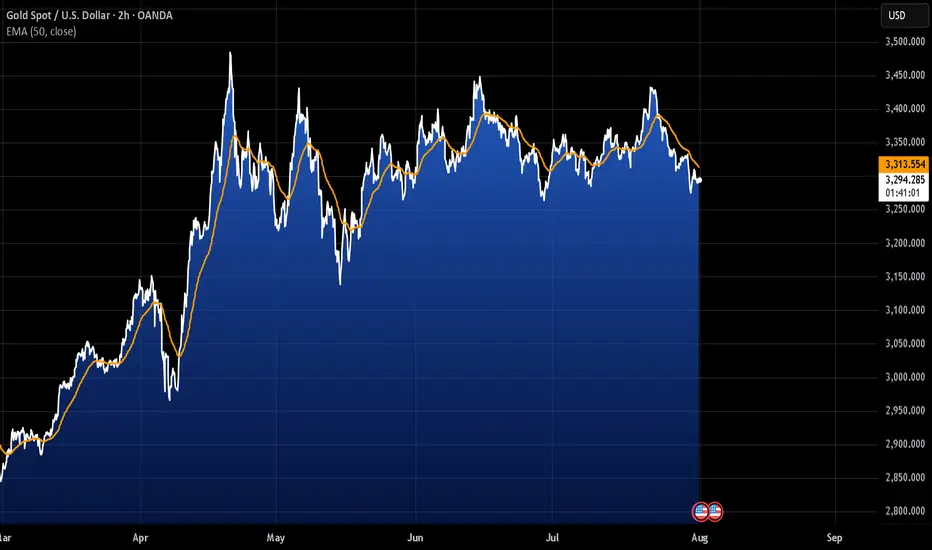
Weak non-farm payroll data injects newconfidence into gold bullsGold rebounded strongly late last week, shaking off early-week losses and surging toward key resistance at $3,400 per ounce as weak US jobs data rekindled hopes for a September rate cut by the Federal Reserve.
Spot gold closed at $3,363.16 on Friday (August 1st), up 2.23% on the day, or $73.24, after hitting a high of $3,363.37.
Lukman Otunuga, senior market strategist at FXTM, said Friday's rally in gold prices was impressive, driven by a plunging US dollar.
"From the chart, bulls were on a rampage that day, with $3,400 within 2% of the price at that point," he said. "With prices breaking through $3,330 resistance, the weekly chart is significantly bullish. A weekly close above this level could signal a move toward $3,400."
Last week, gold faced significant selling pressure after the Federal Reserve held interest rates steady and Chairman Powell raised uncertainty about a possible September rate cut.
"We haven't made a decision about September yet," Powell said at a press conference following the Fed's decision.
After disappointing U.S. job market data, lingering doubts about a September rate cut dissipated. According to the Bureau of Labor Statistics, the U.S. economy created only 73,000 jobs last month. Furthermore, total job growth in May and June was revised downward by 258,000. According to the revised data, only 14,000 jobs were created in June and 19,000 in May.
"This weaker-than-expected jobs report has dented confidence in the U.S. economy and put pressure on the dollar as markets anticipate a more dovish Fed, potentially leaning toward rate cuts to stimulate growth," said Aaron Hill, senior market analyst at FP Markets. "For gold, the disappointing jobs data reinforces its role as a hedge against economic uncertainty, supporting prices as investors seek stability."
According to the CME FedWatch tool, the market currently sees a 92% probability of the Fed easing monetary policy in September. Last Thursday, the market saw only a 38% chance of a rate cut.
Jamie Cox, managing partner at Harris Financial Group, said the Federal Reserve may ultimately regret its decision to hold interest rates steady earlier this week.
"A rate cut in September is a definite possibility, perhaps even a 50 basis point cut, to make up for lost time," he said.
Naeem Aslam, chief investment officer at Zaye Capital Markets, said he sees the potential for gold prices to steadily rise to $3,400 an ounce given the sharp shift in interest rate expectations.
"If the Fed signals a dovish stance, speculative inflows could push gold prices above the psychological $3,400 level, especially as investors seek safe havens during economic uncertainty," he said. "Technical indicators, such as a bullish trend in gold ETFs and rising open interest, support this potential breakout. We believe traders are already positioning for a dip bounce, with some analysts pointing to seasonal patterns in gold that typically gain traction after August. While volatility may still limit near-term gains, the overall trend looks positive, and the typical summer lull may be over."
This week will be light on economic data, with investors continuing to digest Friday's jobs report. Meanwhile, some analysts expect the economic uncertainty stemming from President Trump's ongoing trade war and global tariffs to further boost safe-haven demand for gold.
Trade tensions are providing another layer of support for gold. President Trump set an August 1st deadline for countries to finalize a trade deal. While the United States reached agreements with Japan and the European Union, resulting in a 15% increase in import tariffs, many major trading partners still face the risk of tariff increases.
As a result, exports from many countries now face significant cost increases. Specifically, Canada, the United States' second-largest trading partner, faces a 35% tariff increase. Meanwhile, India faces a 25% increase, Taiwanese exports will be subject to a 20% tariff, South African products face a 30% tariff, and Swiss goods face a 39% tariff.
Pepperstone market strategist Michael Brown said he remains bullish on gold, citing global trade uncertainty as a key factor driving its value as a monetary asset.
He said: "The diversification of reserves away from the US dollar and into gold, particularly in emerging markets, will continue for the foreseeable future. Of course, potential safe-haven demand stemming from concerns about the state of the US economy will further support the bullish view. The upside levels to watch remain the $3,400 mark, followed by a high of around $3,445, and then a potential run towards the all-time high of $3,500. I certainly wouldn't rule out the possibility of new highs in gold prices before the end of the year."
Chris Vecchio, Head of Futures Strategy and FX at Tastylive, said he sees gold as a very beneficial global currency.
"Tariffs mean that countries will trade less in US dollars, so I expect gold to continue to perform well as the world searches for an alternative monetary asset."
