GOLD USDHI GUYS.
H4 CHART here we see on going buys for sculppers and scul [ping sells around the coner.
forcus on the big pictucture more distance more pips as soon as h4 ,h2,h1 forms a (DB)
DOUBLE BOTTOM then we make entries on long position buys to clear upper area(3400,3439).
GOLD trade ideas

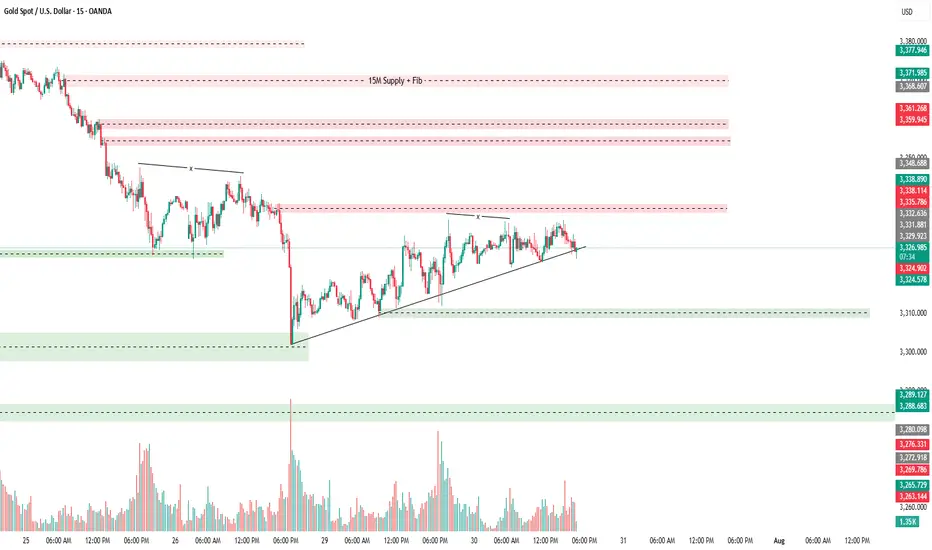
XAU/USD Intraday Plan | Support & Resistance to WatchGold staged a minor recovery overnight after bouncing from the 3,267 Support Zone, and is now trading around 3,305. Price remains below both the 50MA and 200MA, which continue to slope downward—confirming short-term bearish structure.
This current move is still corrective unless bulls manage to reclaim the 3,309–3,334 resistance zone. A clean break and hold above 3,334 would be the first sign of strength, opening up potential retests of 3,348 and 3,362.
Until then, any rallies into the 3,309–3,334 zone should be viewed with caution. If the bounce loses steam, watch for a retest of 3,289 - 3,267. A break below that would expose the 3,241 and 3,208 levels, with the HTF Support Zone (3,241–3,208) acting as a broader downside cushion.
📌 Key Levels to Watch
Resistance:
‣ 3,309
‣ 3,334
‣ 3,348
‣ 3,362
Support:
‣ 3,289
‣ 3,267
‣ 3,241
‣ 3,208
🔍 Fundamental Focus – Thursday, July 31
Big day for data.
🟥 Core PCE, Employment Cost Index, and Unemployment Claims — all critical for Fed outlook and could move gold sharply.
⚠️ Volatility expected around 2:30pm. Stay nimble and manage risk carefully.

gold has reach daily supportMomentum is still bearish however selling low is not advisable.
so there are certain point of interest that we want to look for as gold currently is at the support level. a strong one

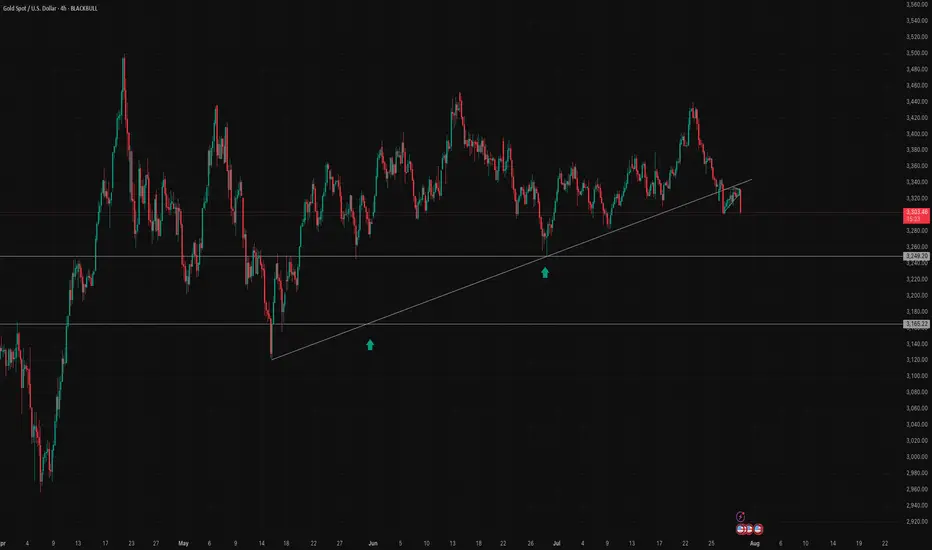
Gold (XAUUSD) Breaks Trendline – Potential Downside Ahead?Gold (XAU/USD) has officially broken below a long-term ascending trendline on the 4H chart, indicating a potential shift in market structure. The recent breakout from a bear flag pattern confirms bearish momentum, and price is now approaching a key horizontal support zone around $3,249 and $3,242.
🔹 Trendline support (now resistance) broken
🔹 Bear flag breakdown – strong bearish candle
🔹 Eyes on support levels: $3,249, $3,165, and possibly lower
🔹 Watch for a potential retest of the broken trendline for short opportunities
A clean break and close below $3,249 could open the door for further downside in the coming sessions. Trade cautiously and manage your risk!
XAUUSD BUY AND SELL LEVELSGold (XAUUSD) is currently showing key movement potential as it reacts to major levels. We are watching closely for price action near important support and resistance zones to identify the next trade setup.
📌 Stay alert for possible retracements or breakouts. Both buying and selling opportunities may arise depending on market reaction.
Trade with confirmation and always manage risk wisely.
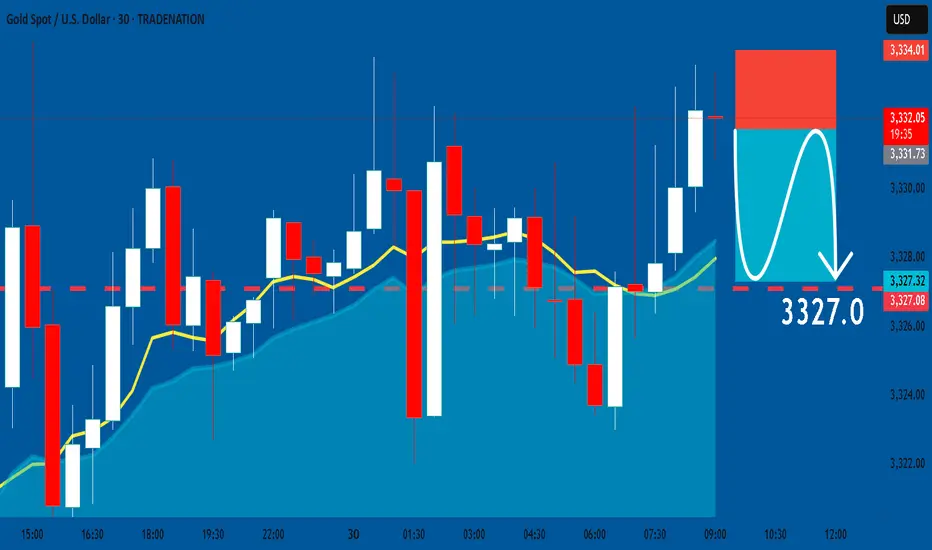
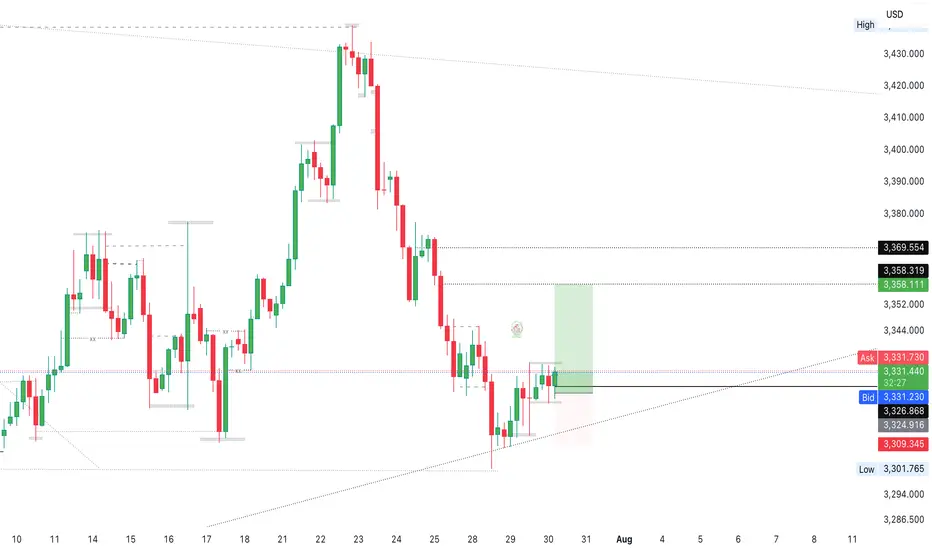
GOLD: Bearish Continuation & Short Trade
GOLD
- Classic bearish pattern
- Our team expects retracement
SUGGESTED TRADE:
Swing Trade
Sell GOLD
Entry - 3331.7
Stop - 3334.0
Take - 3327.0
Our Risk - 1%
Start protection of your profits from lower levels
Disclosure: I am part of Trade Nation's Influencer program and receive a monthly fee for using their TradingView charts in my analysis.
❤️ Please, support our work with like & comment! ❤️
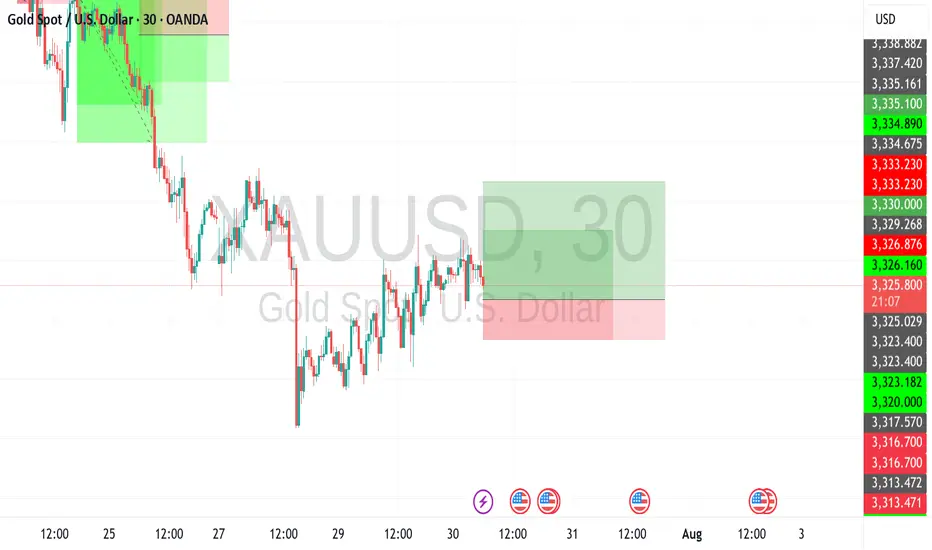
Gold Market Builds Momentum Toward 3358 Supply ZoneGold market continues to build momentum gradually, with price action targeting supply mitigation at 3358.
The duration of this stance depends on whether price can clear this zone decisively; failure may lead to short-term consolidation before the next stance.comment ,boost idea and follow for more informed decisions on gold market
Gold recently experienced a typical "suppression and release"Capital dynamics and sentiment modeling, found that the gold market has recently experienced a typical "suppression and release" type of reaction. After a period of sustained pressure on the emotional background, the dominant force of the short side began to weaken, and both long and short sentiment tends to be balanced, and the logic of gold as a safe-haven asset has been re-explored and recognized.
This type of trend is often non-explosive, but through the emotional layers of repair and structural slow reversal of the gradual unfolding. The current signal strength has reached the bearish threshold set by the system, with a certain operational feasibility.
It is recommended that traders try to follow up with a low percentage of positions, but still need to retain enough position space to cope with the possible continuation of fluctuations. The whole layout is mainly defensive and offensive, and it is appropriate to seek progress in a stable manner.
Gold (XAU/USD) – Technical UpdateDate: July 30, 2025
✅ Market Reaction Confirms the Forecast
In our previous analysis, we highlighted the $3,308–$3,315 region as a high-probability demand zone, reinforced by a deep retracement into the 89% Fibonacci level. We also pointed to a liquidity grab beneath $3,308 and projected a potential bullish reversal toward $3,345 and $3,398.
Today, price action has validated this view with precision.
✅ Price swept liquidity below $3,308 as expected, triggering a sharp rejection from our zone.
✅ A clear bounce followed, pushing price upward and confirming that large buyers stepped in—exactly where we anticipated.
✅ The structure is now shifting bullish, with price currently trading above $3,331, heading confidently toward our first target at $3,345.
📊 Why This Matters
This reaction was not random—it followed the logic laid out in the prior analysis:
-The demand zone was respected.
-The discounted pricing at 89% retracement offered maximum risk-reward.
-The internal imbalance between $3,345–$3,398 continues to act as a magnet, just as we outlined.
This is a textbook move where price hunted stops, tapped into demand, and began its upward drive—exactly as described in advance.
🎯 Targets Remain Valid
Target 1: $3,345 → Currently in progress. Price is gravitating toward this level, which also aligns with the 50% Fib retracement and minor supply.
Target 2: $3,398 → The final destination of this bullish move, completing the fill of the inefficiency left behind by the last drop.
🧠 Final Word
This is a strong confirmation of the original idea. The technical story has unfolded step by step as predicted, proving the reliability of the analysis. For traders following along, this not only reinforces confidence in the setup—but also showcases the power of disciplined, structure-based trading.
🔥 The move is unfolding exactly as projected. Patience, precision, and planning are now paying off.
consider like and follow so you don't miss any next analysis or update of the chart
you can ask me in the comment section

Please check how to trade later.Since the release of the trading strategy, I have been able to accurately predict market trends. I am also grateful to so many brothers for following me. My premium privileges are about to expire. I will put the subsequent trading content in the group. If any brothers are interested, they can find me through 🌐. As for how to deal with the future market, I have stated the extraordinary situation and will patiently wait for the rebound of gold. At the same time, I will pay attention to the impact of the Sino-US trade talks.

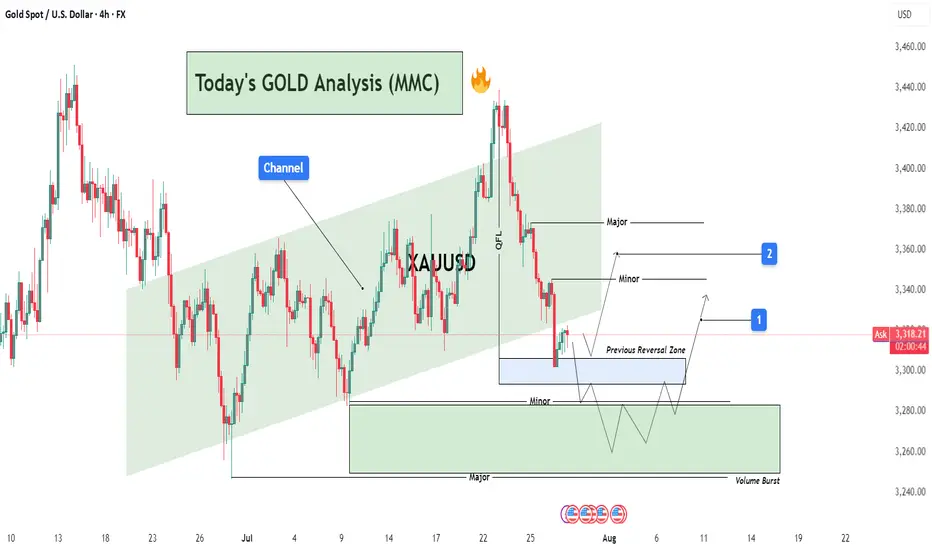
GOLD Analysis : XAUUSD Major Bullish Demand Zone🧠 Market Structure Context (MMC Framework)
Gold has recently shown a clean structural decline from its local highs within a well-defined ascending channel. This analysis highlights a reaction zone-based playbook, focusing on high-probability reversal scenarios guided by institutional footprints, volume reaction points, and MMC logic.
We’re currently trading near a previous reversal zone, where history tells us the market tends to shift behavior. Let’s dissect the key components.
📊 Key Technical Components
🔸 1. Ascending Channel Breakdown
The entire uptrend was respecting a well-established bullish channel until the recent drop violated the midline structure. This breakdown confirms a temporary bearish phase, with price breaking cleanly below a QFL base (Quick Flip Level)—a level where price reversed sharply before, which now acts as a major supply zone.
Psychological Insight: Channels give clues about momentum. Breaking below the lower band shows the market is preparing for a retest or a deeper liquidity hunt.
QFL Breakdown: Once broken, previous buyer confidence is shaken—inviting sellers to test demand zones.
🔸 2. Previous Reversal Zone (PRZ) Reaction
Currently, price is hovering inside the blue shaded Previous Reversal Zone, where bullish pressure previously kicked in. It’s a minor demand zone, but critical due to historical reaction. The projected structure shows a bounce from this area before deciding next direction.
MMC Insight: The first test of PRZ often leads to an initial reaction. But deeper liquidity lies just below in the major green demand zone.
🔸 3. Major Demand Zone + Volume Burst Area (The Real Magnet)
Below the PRZ lies the major reversal block—highlighted in green. This zone is significant because:
It aligns with a high-volume burst in the past, confirming institutional orders.
It's a cleaner structure level for smart money re-entry.
It also provides room for the “liquidity sweep” (stop hunt), collecting sell stops before a proper reversal.
💡 Expected Play: Price may fake out below PRZ, enter the major demand, and then initiate a multiple-leg bullish rally. Patience is key here.
🛠️ Trade Structure Outlook
✅ Scenario 1 – Aggressive Buyers (Marked "1"):
Buy from the current PRZ zone around $3,305–$3,315
Target: $3,340 (Minor Resistance)
Risk: Slippage into deeper demand zone
Stop-loss: Below $3,295
✅ Scenario 2 – Safer Entry from Major Demand (Marked "2"):
Let price dip into $3,270–$3,280 zone (green box)
Look for reversal candles or liquidity sweeps on lower timeframes
TP1: $3,330
TP2: $3,365 (Major Resistance)
📈 Resistance Levels to Watch:
Minor Resistance: $3,340 – Expect short-term pullbacks or hesitation.
Major Resistance: $3,365 – Key target for swing traders and potential reversal zone.
🔍 MMC Concepts in Action
✅ Channel Logic: Breakdown implies momentum shift—watch for retests.
✅ QFL: Previous bounce zone broken = supply now overhead.
✅ Volume Burst Zone: Strong historical reaction = institutional interest.
✅ Zone-to-Zone Trading: Instead of random entries, focus on logical zone interactions.
🧭 Conclusion – Path of Probability
Gold is currently in a transitional phase—shifting from bearish correction to potential bullish revival. Patience will reward those who wait for PRZ rejections or deeper liquidity taps. The MMC framework helps frame this market not as chaos, but a map of strategic reaction points.
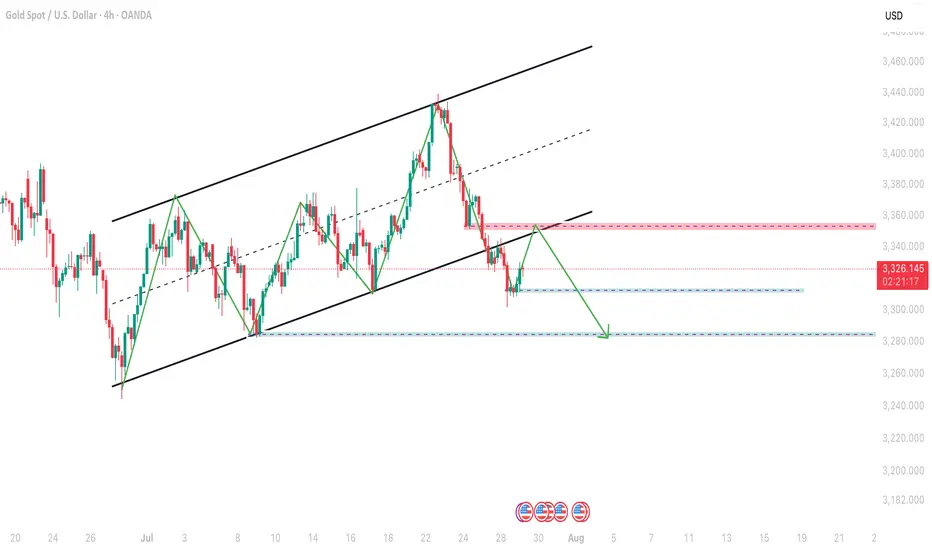
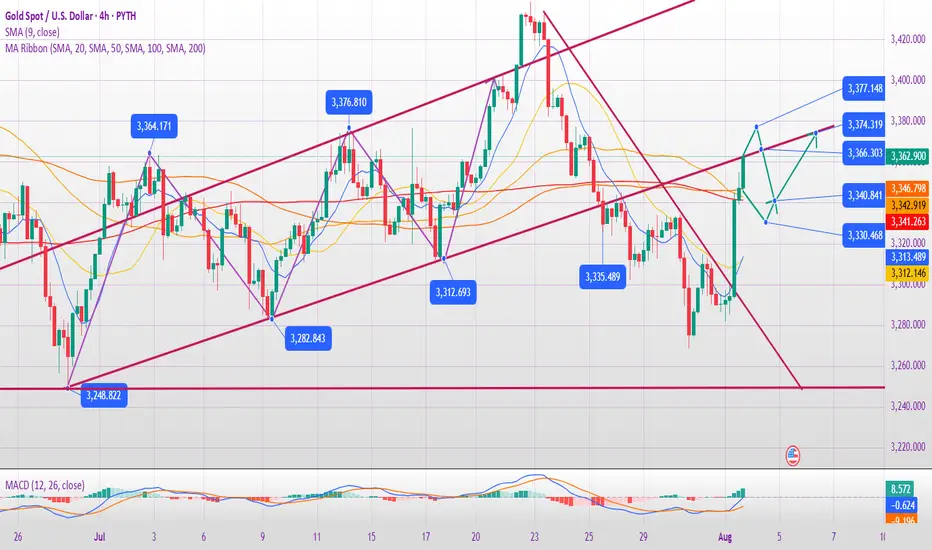
Gold 4H OverviewAs you can see Gold was running in a channel from last so many days which alreadh broke out 28 july 2025 so this is the time for retest of channel and then downtrend continuation.

Will gold break through on August 5th?
1. Key News Drivers
✅ Expectations of a Fed Rate Cut Strengthen (Core Logic)
Weak non-farm payroll data (the probability of a September rate cut soars to 90%) leads the market to anticipate two rate cuts this year, with the first likely in September.
The US dollar weakens: expectations of interest rate cuts suppress the US dollar, and the attractiveness of gold as an interest-free asset increases.
✅ Rising risk aversion
Trump's tariff policy has sparked trade concerns, compounded by global economic uncertainty (such as a slowdown in Europe and geopolitical risks).
Fragile market sentiment: If subsequent economic data (such as CPI and retail sales) falls short of expectations, gold could rally further.
⚠️ Risk Warning: If Fed officials signal hawkishness (such as downplaying rate cuts) or if economic data rebounds, gold could experience a short-term correction.
2. Key Technical Signals
📈 Bullish Trend Confirmation Conditions:
A break above $3,375 (previous resistance level) opens up upside potential, with targets between $3,390 and $3,400, or even $3,450. Hold the support of 3335 (bull defense line). If the pullback does not break this level, the trend will remain strong.
📉 Pullback Risk Warning:
If 3335 is broken, a pullback to 3300 (a key psychological barrier) is possible, turning into a volatile market.
4-hour chart is overbought: Be wary of short-term profit-taking after consecutive days of gains.
🔍 Key Levels:
Resistance: 3375 → 3390-3400 → 3450
Support: 3360-3350 → 3335 → 3300
3. Today's Trading Strategy
🎯 Main Strategy: Buy on pullbacks (low-cost buying), supplemented by shorting at key resistance levels.
👉 Long Opportunities:
Conservatives: Enter after a pullback to 3360-3350 and stabilization. Stop loss at 3340, target at 3380-3390.
Aggressive: If it breaks through 3375, go long with a light position, set a stop-loss at 3360, and target 3400.
👉 Short Opportunities:
Short if it first hits the 3390-3400 range and finds resistance, set a stop-loss at 3410, and target 3375-3360.
⚠️ Notes:
Avoid chasing the ups and downs, and wait for key levels to be confirmed.
If it falls below 3335, pause long positions and wait for support at 3300 before repositioning.
4. Medium- to Long-Term Outlook
Bull Market Start Signal: A weekly break above 3400 could confirm the start of the Fed's rate cut cycle.
Potential target: 3500-3600 (historical high area).
Risks: If US economic data improves or the Fed turns hawkish, gold could experience a deep correction to 3200-3150.
Summary
Short-term outlook: 3375 is the dividing line between bulls and bears. If it breaks through, go long; if it hits resistance, trade in a range.
Medium- to long-term: Focus on Fed policy and economic data. Trend-setting long positions should wait for clearer signals.
📌 Action suggestion: Give priority to callback of long orders during the day, strictly set stop-loss, and be wary of high-level shocks and washouts!

Gold (XAU/USD)Gold (XAU/USD) — price rejected resistance zone (~3380), potential move towards 3223 support.
#XAU

Gold Breaks Support – Risk of Pullback Toward $3,310📊 Market Summary:
Gold prices initially rose on weaker-than-expected U.S. jobs data, which lowered Treasury yields and weakened the U.S. dollar. However, after breaking the key support at $3,365, gold continued to decline toward $3,354, and briefly touched $3,352, signaling rising technical selling pressure. Despite a 92% market expectation for a Fed rate cut in September, the technical breach increases the risk of a deeper correction.
📉 Technical Analysis:
• Key Resistance: Around $3,365–$3,370 – this zone now acts as short-term resistance; stronger resistance lies at $3,375–$3,380 if prices recover.
• Nearest Support:
The $3,365 level was broken.
New support is seen at $3,352–$3,350; a continued drop may bring prices to $3,335, and possibly toward $3,310–$3,300.
• EMA 09: Price is now below the 9-day EMA, suggesting a short-term bearish trend.
• Momentum / Volume / Candlestick:
RSI is near 50, slightly bearish; volume is tapering on the downside, indicating distribution.
Early signs of a head-and-shoulders (H&S) pattern are developing.
📌 Outlook:
Gold may continue declining in the short term if it stays below the $3,350–$3,352 zone.
A further drop toward the $3,335 – $3,310 region is possible.
If price rebounds and closes above $3,365, the bearish momentum could be neutralized.
💡 Suggested Trade Strategy:
🔻 SELL XAU/USD : $3,355–$3,358
🎯 TP: 40/80/200 pips
❌ SL: ~$3,361
🔺 BUY XAU/USD : $3,305–$3,302 (if price pulls back deeper)
🎯 TP: 40/80/200 pips
❌ SL: ~$3,299

Gold Consolidates at the Top, Bearish Reversal Ahead?On the 15-minute chart, XAUUSD is showing signs of exhaustion after a strong bullish impulse. Price is currently consolidating around the 3,370–3,375 resistance area, failing to make a clean breakout. Volume is fading, suggesting buyer momentum is weakening.
Technical Breakdown:
1. Market Structure:
Since late July, the market has formed a clear uptrend with higher highs and higher lows.
However, recent price action is showing indecision at the top, with multiple rejection wicks – indicating a potential short-term distribution phase.
2. Price Action & Supply-Demand Zones:
Demand Zone 1: Around 3,310–3,320 acted as the launchpad for the strong bullish breakout on August 2.
Demand Zone 2: Around 3,345–3,350 provided support for the next leg up.
Current Supply Zone: Between 3,375–3,380 – multiple rejections have been observed here.
3. Indicators Overview:
EMA20 & EMA50 (not shown but inferred): Upward sloping, but starting to flatten – signaling potential consolidation or bearish divergence.
RSI (likely above 70 earlier): Now showing signs of bearish divergence, supporting a possible short-term correction.
4. Fibonacci Retracement Analysis:
From the recent bullish swing (3,310 → 3,375), key retracement levels are:
0.382 → ~3,350
0.5 → ~3,342
0.618 → ~3,334
This confluence around the 3,334–3,342 range makes it a critical zone for a potential bullish bounce.
Suggested Trading Strategies
Scenario 1 – Scalping the Rejection (Counter-trend short):
Entry: SELL limit at 3,375–3,380
Stop Loss: 3,386
Take Profits:
TP1: 3,350 (Fibonacci 0.382)
TP2: 3,335 (Fibonacci 0.618 + previous support)
Scenario 2 – Trend Confirmation (Breakdown Play):
Setup: Sell if price breaks below 3,350 with volume confirmation.
Target Zones:
Initial target: 3,310 (prior demand zone)
Extended target: 3,280–3,265 (possible Wyckoff distribution breakdown)
Key Levels to Watch:
Significance: 3,380 - Resistance - Short-term supply zone
3,350: Support - Key Fibonacci 0.382 level
3,334: Support - Strong confluence zone (Fibo + demand)
3,310: Support - Bullish breakout base
Conclusion:
Gold is currently in a vulnerable position with signs of bullish exhaustion. Traders should stay patient and wait for confirmation before entering. Watch the 3,350–3,334 zone for reaction – it will likely decide the next directional move.
If you found this analysis helpful, make sure to follow for more updated strategies and save this post for future reference.

XAUUSD Intraday Signal Analysis – Gold Price Momentum & RSI SetuIn today’s 1-hour chart of XAUUSD (Gold vs USD), we observe a strong upward momentum supported by technical indicators, suggesting a well-defined bullish trend in the short term. Traders looking to capture short-term profits may find this chart setup especially favorable. Here's a breakdown of the price action and what it could mean for intraday traders.
Price Action Overview
The price of gold has surged past the $3,320 mark, showing a clear bullish breakout with a series of higher highs and higher lows. Currently, the market is trading near the $3,378 level, consolidating slightly after a strong upward movement.
The SMA 9 (Simple Moving Average) is providing dynamic support, curving upward and closely hugging the candlesticks. This is typically a sign that buyers are actively pushing the price higher and dips are being bought up quickly.
Additionally, the spread between the Buy ($3,378.78) and Sell ($3,378.51) prices is extremely narrow, suggesting tight liquidity and fast execution potential — ideal conditions for scalpers and short-term traders.
RSI Analysis
The RSI (Relative Strength Index) 14 is hovering around the 68–70 level, which traditionally indicates the asset is approaching overbought territory. However, it hasn’t crossed into the 70+ danger zone yet, which implies there could still be room for further upside.
One key observation is the RSI divergence forming on the right-hand side. While price has been climbing steadily, RSI has started to curve down slightly — this could hint at a minor pullback or consolidation phase before the next big move. Smart traders may consider watching for bullish RSI bounces or hidden divergences before re-entering long trades.
Trade Idea
Trend: Bullish
Support: $3,360 / $3,340
Resistance: $3,400 / $3,420
Signal: Wait for a minor pullback toward the SMA, and look for bullish candlestick confirmation near $3,360 before entering long.
Conclusion
This XAUUSD 1H chart presents a strong case for continued bullish momentum with cautious optimism due to RSI nearing overbought levels. A pullback could offer fresh entry opportunities before a push toward the next resistance zone. Intraday traders and swing traders alike can benefit from closely monitoring price action around the SMA 9 line.

XAU/USD(20250805) Today's AnalysisMarket News:
Goldman Sachs: We expect the Federal Reserve to cut interest rates by 25 basis points three times starting in September; if the unemployment rate rises further, a 50 basis point cut is possible.
Technical Analysis:
Today's Buy/Sell Levels:
3367
Support and Resistance Levels:
3407
3392
3383
3352
3342
3328
Trading Strategy:
If the stock breaks above 3383, consider buying, with the first target price at 3392. If the stock breaks below 3367, consider selling, with the first target price at 3352.

XAUUSD (Gold) Intraday Trading Plan – Tuesday, 5th August 2025Timeframe: M15 (15-Minute)
Strategy Type: Intraday Buy-the-Dip (Scalp-to-Swing)
Market Bias: Bullish
Risk Profile: Short-Term Scalping with Staggered Exits
Execution Style: Multi-phase, Wait-and-Trigger Confirmation Strategy
🧠 Technical Market Overview
Gold remains firmly in a short-term uptrend structure with consistent higher lows and strong buyer momentum since the start of the month. The Asian session on Tuesday is expected to be quieter, creating room for controlled retracements before London and New York bring in volume.
Price is currently trading above key moving averages on the M15 chart (50 EMA and 200 EMA), showing bullish continuation. With market structure respecting rising channel patterns and Fibonacci retracement levels holding well, the day presents a clear opportunity to execute a ladder-style buying plan.
🔍 M15 Intraday Execution Plan
✅ Phase 1: Buy on Retracement to 3366 (Entry Zone)
Entry Zone: Around 3366
Reasoning:
3366 aligns with the 38.2% Fibonacci retracement of the prior M15 leg
A well-established support zone from previous breakout base
Strong volume and wick rejection in this zone from prior session
Confirmation:
Bullish engulfing, pin bar, or strong momentum candle on M15
RSI (14) bouncing above 40
Price rejection from 3365–3367 zone
Stop Loss:
Below 3359 (well below intraday structure)
🎯 Target 1: 3377
Why:
Local resistance from earlier M15 swing highs
Also represents a round number + intraday liquidity zone
High probability zone for first exit or reaction
Action:
Take partial profits (~40%)
Move SL to breakeven or trail below 3369
Wait for market to pull back for re-entry
✅ Phase 2: Wait for Pullback (After 3377 is Hit)
Retracement Zone: 3371–3373 (new higher low formation)
Entry Trigger:
Price consolidates or forms a small flag pattern
Clear bullish momentum on candle breakout
🎯 Target 2: 3387
Why:
Next resistance level based on Monday’s NY session high
Also coincides with extended fib target (1.272 level of 3366–3377 move)
Action:
Secure additional 30% profit
Move SL to 3376
Wait for next consolidation for final trade setup
✅ Phase 3: Final Entry After Consolidation Near 3380–3383
Reasoning:
Micro-pullback to a newly established support before last wave
Continuation pattern or breakout flag expected to form
🎯 Target 3: 3397
Why:
Psychological zone near 3400, commonly tested by algo-driven spikes
Key intraday liquidity magnet where large exits usually occur
Also aligns with the upper edge of projected intraday trend channel
Action:
Close all remaining positions
Watch for reversal signal or potential breakout to plan next session
⚠️ Risk Management Plan
Max exposure: 1–1.5% of capital, split across multiple entries
Each entry must have independent SL and TP
Never average down; add only after successful TP1
Close full position if price breaks below 3359 and closes below 50 EMA on M15
🔁 Summary Table
Phase Buy Level Target SL Action
Phase 1 3366 3377 3359 Take 40%, trail SL
Phase 2 3371–3373 3387 3366 Take 30%, trail SL
Phase 3 3380–3383 3397 3376 Take 30%, full close
📊 Technical Indicators to Support Plan
EMA 50 & EMA 200: Trend direction and pullback support
RSI (14): Momentum confirmation (ideal entry RSI: 40–50 bounce)
Volume Profile: Entry zones should align with HVN (High Volume Nodes)
🧭 Intraday Session Awareness
Asian Session: Look for slow grind or pullback toward 3366
London Open (3pm SG time): Likely volatility spike toward 3377
New York Open (8:30pm SG time): Possible momentum to 3387 or 3397
Avoid Entry During News Spikes: Especially US economic data

In-depth Analysis of the Gold Bull-Bear Game on August 4th:
I. Gold's Current Core Contradiction
Bull Support Factors
Weak non-farm payroll data reinforces expectations of a Fed rate cut, with the market betting on an over 80% probability of a September rate cut.
Risk Aversion: Although the tariff extension has not yet been finalized, the market remains concerned about escalating trade frictions, and gold is in high demand as a safe-haven asset.
Technical Breakout: Friday saw a strong breakout above the 3340-3350 resistance zone, with the daily chart showing a positive enveloping negative trend. Short-term bullish momentum prevails.
Potential Short-Term Opportunities
Monthly Top Signal: Consecutive high-level doji candlesticks with long upper shadows suggest medium-term selling pressure.
Fundamental Bearish Hidden Dangers:
The Fed's independence remains, and Powell may not cut interest rates prematurely due to pressure from Trump.
II. Key Technical Signals
1. Weekly Level: Range Unbroken
The 3268-3438 range persists, currently nearing its upper limit, so be wary of a pullback.
Bollinger Bands are converging, with the MA5/MA10 convergence signaling an approaching market reversal window.
2. Daily and short-term cycles: Overbought correction needs
After Friday's surge: 4-hour/1-hour RSI is overbought, the Bollinger Band opening is unsustainable, and a technical retracement is needed.
Key positions:
Resistance: 3376 (previous high) + 3385 (Fibonacci expansion level);
Support: 3340 (top and bottom conversion) + 3315 (bull defense line).
3. Triangle convergence pattern:
If it opens high and breaks through 3376 on Monday, August 4, it may test 3400; if it opens low and falls below 3340, it will look down to 3315-3280.
III. Operation strategy for next week on August 4
(1) Response to three opening scenarios
Scenario 1: Opening high (above 3370)
Strategy: Short in batches in the 3376-3385 area, stop loss at 3400, target 3340→3315.
Logic: Positive overdraft + technical overbought, betting on a pullback.
Scenario 2: Flat opening (around 3360)
Strategy: If the price rises from 3366 but does not break through, go short with a light position, stop loss at 3376, target 3340; if it falls below 3340, go short and look at 3315.
Alternative: If the support at 3340 is effective, go long, stop loss at 3330, target 3360.
Scenario 3: Low opening (below 3340)
Strategy: Go long in the 3338-3340 area, stop loss at 3325, target 3360; if it breaks through 3315, go short.
(2) Mid-term layout
Short opportunity: Go short in the 3385-3400 area, stop loss at 3420, target 3245 (monthly support).
Buy opportunity: If the price falls back to 3315-3280 at the beginning of the week and stabilizes, go long in the mid-term, stop loss at 3260, target 3400.
IV. Risks and Warnings
Beware of institutional manipulation: Friday's late-day surge may be a trap for buying; beware of a flash crash at Monday's opening.
Data disturbance: Pay close attention to the speeches of Fed officials. If inflation rebounds or hawkish remarks are made, it will be bearish for gold.
Undetermined trend: The market is still volatile and unilateral trends need to wait for confirmation of a breakthrough in the range.
Conclusion
Short-term: Prioritize shorting in the 3370-3385 area, and enter long positions in the 3340-3315 area when appropriate, maintaining strict stop-loss orders.
Mid-term: The monthly bearish pattern has not changed, and above 3385 is the ideal entry point for short positions.
Key Strategies: "Don't chase long positions during strong resistance; don't sell short during deep declines; follow the trend after a breakout; exercise caution in controlling the market."
XAUUSD:BUYThere is no need to worry about holding long orders mentioned last Friday. Gold prices continued to rise this week after a pullback. The price has risen to 3372. According to the research team of our swing trading analysis team, the bullish trend will continue.
Earlier I informed members that some buy orders were closed at high levels. At that time, the short-term high was around 3370. After closing the long orders, the price subsequently fell. This is the advantage of swing trading. You can use accurate trading signals to trade in batches in the short term, thereby creating opportunities for quick profits.
After the pullback, there is still good room for buying and opportunities.
