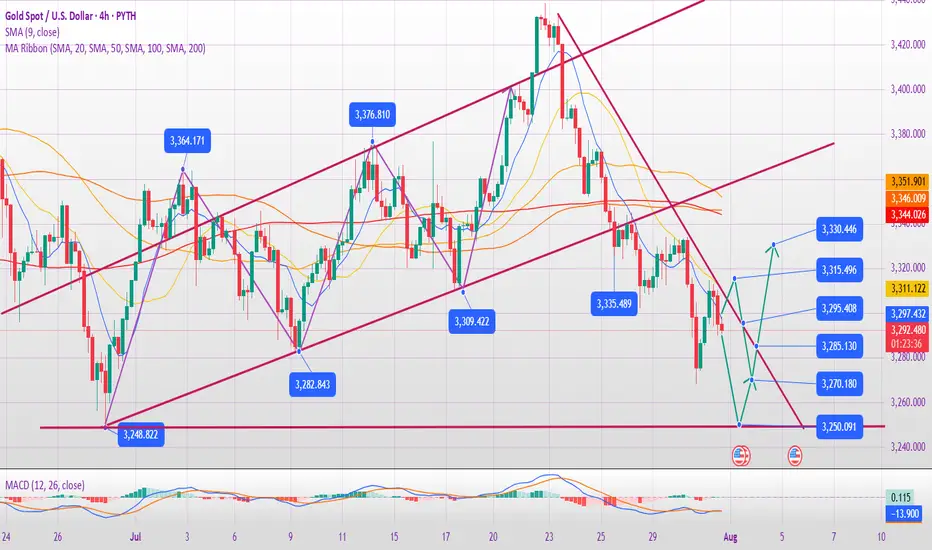
xau longnews on the tariff on swiss last friday, should still have a up ward movement.
wait for retest to enter this.
expecting bull flag strat, if triple top, exit the trade. or sl be
been very busy lately, also doing well with our copy trading, we also launched a smart plan copytrading service.
we have partnered with Blackbull markets to give the best spreads of roundtrip 5.5 usd.
see profile to get updated.
GOLD trade ideas

Gold: market is concerned, againThe previous week brought a bunch of important US macroeconomic data as well as the FOMC meeting, which all brought back some higher volatility on markets. The price of gold benefited from the uncertainties related to future economic developments under implemented trade tariffs, which have started to modestly reflect on the US economic data. The surprise came in jobs data on Friday, where non-farm payrolls added only 73K new jobs in July, which was significantly below expected 110K.
During the first half of the week, the price of gold was traded in a corrective way, reaching its lowest weekly level at $3.267. Still, Friday's surprising NFP data pushed the gold 2% higher, back to the level of $3.362, where the gold is closing the week. The RSI was pushed below the level of 50 during the first half of the week, however, the indicator ended the week at the level of 53. The MA50 slowed down its divergence from MA200, but the distance between the two lines is still high, in which sense, there is no indication of a potential cross.
In a week ahead there are no important US economic data scheduled for a release, in which sense, it could be expected that the market will use this time to fully reflect data from the previous week. Also, some short corrections in the price of gold are possible, which is usually after a strong shift toward one side. Some profit-takings could push the price of gold back toward the $3.320. The support line at $3,3K might also be shortly tested, but with lower probability. On the other hand, there is also probability for further push toward the upside, depending on investors’ perceptions of the future risks. It should not be overseen that currently the highest risks are coming from trade-tariff negotiations and settled deals. Any negative news regarding trade tariffs might easily push the price of gold higher from current levels.


Gold analysis and trading strategy for Monday✅ Fundamental Analysis
Friday’s Non-Farm Payrolls (NFP) data came in significantly below expectations, with new job additions falling far short of market forecasts. This sparked a sharp rise in expectations for a Fed rate cut later this year. As a result, the U.S. dollar index declined and gold prices surged violently, rallying from the 3281 level to a high of 3362 — a single-day gain of over $85, completely erasing the week's prior losses and reestablishing a strong bullish structure.
✅ Technical Analysis
📊 Weekly Chart
Gold posted a strong bullish weekly candlestick, reversing the previous consolidation trend and signaling a structural shift in market sentiment. Bulls have regained full control. The key resistance zone lies between 3380–3400; if price breaks and holds above this level, the next upside target will be around 3430.
📊 Daily Chart
Gold stabilized at the 3281 low and surged on Friday evening following the NFP surprise, closing near the day’s high — a sign of aggressive buying. The short-term trend has clearly reversed to the upside, and any pullback is now considered a buying opportunity. The key support has moved up to around 3335, serving as a critical pivot zone. Further support is seen near 3316, a previous swing low.
📊 Hourly Chart
Price is currently trading above short-term moving averages, indicating a strong bullish bias. The key level for a potential bullish continuation is around 3355, which represents a recent support-turned-resistance area. If price pulls back to this level and holds, or breaks above it directly, it will confirm bullish strength. If gold opens with a gap higher toward 3385, beware of potential short-term volatility due to a liquidity gap. Chasing highs in such scenarios requires caution.
🔴 Resistance Levels: 3375–3380 / 3400–3430
🟢 Support Levels: 3355–3340 / 3330–3335 / 3316
✅ Trading Strategy Reference
🔺 Primary Strategy – Buy on Dips:
🔰Consider long entries around 3340–3335, with a stop-loss below 3328.
🔰If the market remains strong, a direct long near 3355 is viable, targeting 3375 and above.
🔰A deeper pullback to 3330–3335 is a favorable entry zone for mid-term longs.
🔻 Secondary Strategy – Sell on Rebounds (Short-Term Only):
🔰If gold opens Monday with a sharp spike to around 3385 but fails to break higher, a light short position may be considered, targeting a quick $10–$15 pullback.
🔰If 3385 is broken and held, abandon short setups and revert to a bullish view.
✅ Overall Outlook
Gold has completed a technical reversal following the bullish fundamental catalyst from the NFP data. The trend has shifted from bearish to bullish, and the market has clearly moved into a higher price range. The core trading logic should remain “buy on dips”, and countertrend trades should be approached with caution. Look for long opportunities near key support levels, and consider short positions only at major resistance levels and for quick intraday trades. A confirmed breakout above 3375 will likely open the door to 3400–3430 in the near term
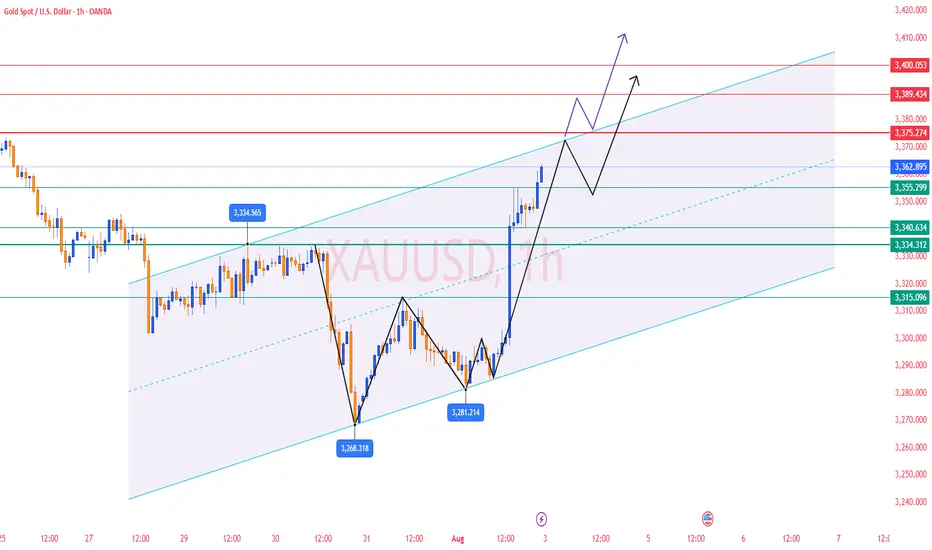
Gold looks like still having Bullish Momentum Based on current situation, XAUUSD looks like still having bullish momentum. looks at momentum candle, it like give early signal of next pole movement.
I just labelled two significant zone that I think, it is possible to create an edge. Even though, just wait for price action.

Gold in the strong bullish momentum.WE will be expecting gold to con tinue its climb as NFP.
A sudden rejection is seen on 1st of Aug a good strong sign of bull coming in.
point is where to trade.
i personally expect for a pullback and point of interest for me for now nearest will be 3345 next 3330 lastly 3310-14.
where can we expect gold to climb up to.
first pitstop will be 3391-3403 and next 3465-87.
all the best traders.

Gold (XAU/USD) in Symmetrical Triangle – Short‑Term Squeeze,Price Structure & Technical Setup
Gold is consolidating within a symmetrical triangle, showing lower highs and higher lows—a classic precursor to breakout in either direction
Fxglory Ltd
+5
TradingView
+5
Babypips.com
+5
TradingView
+2
Babypips.com
+2
TradingView
+2
.
Trendlines converge tightly around $3,326–$3,334, hinting at imminent directional acceleration
Investopedia
+4
TradingView
+4
TradingView
+4
.
🎯 Key Levels & Targets
Scenario Trigger Confirm Area Targets Stop Loss
Bullish Breakout above $3,344–$3,350 $3,369 → $3,396 → $3,422–$3,550 ~$3,340
Bearish Breakdown below ~$3,326–$3,320 $3,320 → $3,300 → $3,297 → $3,255 ~$3,335–$3,340
A breakout above $3,344–$3,350 validated with volume may drive prices toward $3,400+, with extended targets up to $3,550 or higher in bullish conditions
Traders Union
Time Price Research
.
A drop below $3,326–$3,320 risks further decline, targeting $3,300, $3,297, and eventually $3,255 if breakdown momentum builds .
📉 Market Context & Drivers
U.S. dollar strength, easing safe-haven demand, and optimistic trade sentiment are constraining gold’s upside unless breakout forces emerge .
Key upcoming catalysts: FOMC guidance, U.S. macro data (GDP, inflation), and geopolitical developments—their tone could tip the bias direction .
⚙️ Trade Rules & Risk Management
Wait for a confirmed breakout or breakdown—do not trade mid-range.
Confirm break with at least one close outside the triangle and rising volume .
Position sizing: Risk 1–2% per trade, adjust stop-loss to price structure ($8–$15 depending on volatility).
Take profits in stages: scale out at minor milestones (first targets), trail stop for extended targets.
Avoid chasing price within the middle of the triangle—risk/reward is unfavorable.
🧠 Why This Plan?
Follows textbook symmetrical triangle trading methodology: entry on breakout, stop beyond pattern opposite side, projection based on triangle height .
Aligns with broader outlook: bearish unless convincing upside breakout appears, consistent with analyst consensus hedging current bull exhaustion and wait‑and‑see on policy signals .
✅ Summary
Gold is coiling inside a tight triangle range near $3,326–$3,334, with breakout potential identified to either side:
Bullish breakout over $3,344–$3,350 targets up to $3,550 or beyond.
Bearish breakdown under $3,326–$3,320 risks slide towards $3,300–$3,255.
Wait for confirmation, apply disciplined risk controls, and let volume validate the move.

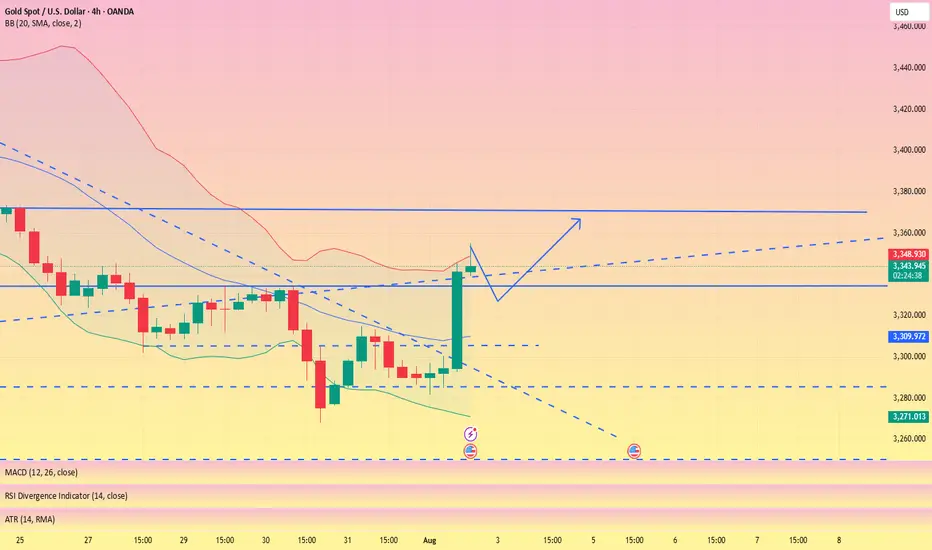
NFP data is positive, the bullish trend remains unchanged#XAUUSD
The current market, influenced by data such as NFP, remains bullish, even briefly pushing towards the 4H upper limit of 3350, reaching a high near 3354.📈
In the short term, gold still has upward momentum and could even reach the previous high resistance level near 3375.🐂
Currently, gold is undergoing a technical correction and needs to begin a pullback to accumulate more bullish momentum, giving traders who previously missed the opportunity to get on board.🚀
As resistance continues to rise, support below will also rise. 📊If gold retreats below 3335-3315, consider going long.📈
🚀 SELL 3335-3315
🚀 TP 3350-3375
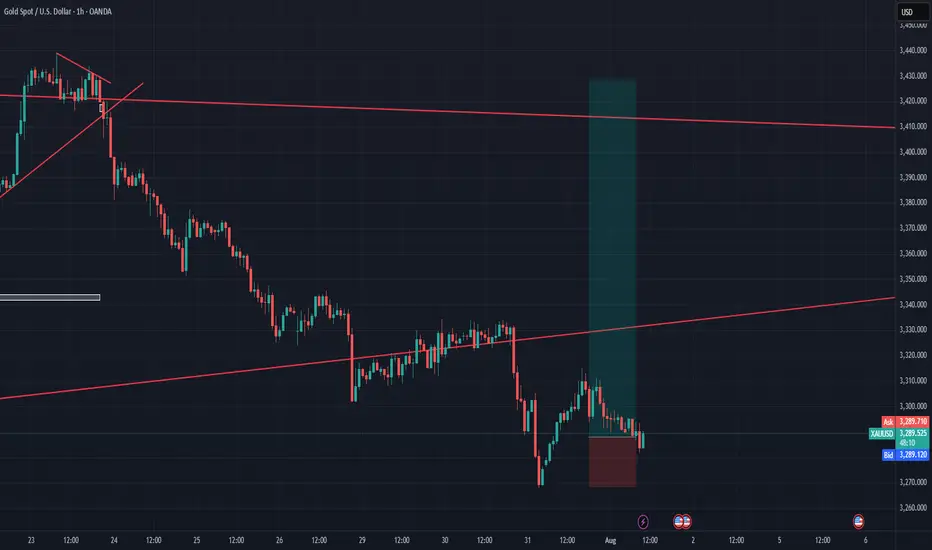
XAUUSD Gold Trading Strategy August 1, 2025
Yesterday's trading session, gold prices recovered to the 3315 area and then continued to decrease to the 3281 area. Currently, gold prices are fluctuating quite unpredictably due to the impact of tariff news and investor confidence.
Basic news: The Federal Reserve FED continues to maintain the federal funds benchmark interest rate in the range of 4.25% - 4.50%, in line with policy since 2025. Chairman Powell did not give any signal about the next interest rate cut on September 16 - 17.
Technical analysis: After falling sharply to the 3269 area, gold prices are showing signs of recovery. In the current downtrend channel, there has been a higher bottom than the bottom at H1. We can see that if the bullish pattern at H1 is confirmed, combined with the reversal candlestick appearing at H4, the possibility of gold bouncing back to reach the resistance area of 3330, even 3350 is completely possible. In the weekend trading session, we will wait at the support zones to trade.
Important price zones today: 3280 - 3285 and 3269 - 3274.
Today's trading trend: BUY.
Recommended orders:
Plan 1: BUY XAUUSD zone 3283 - 3285
SL 3280
TP 3288 - 3300 - 3310 - 3330.
Plan 2: BUY XAUSD zone 3269 - 3271
SL 3266
TP 3274 - 3284 - 3300 - 3320.
Wish you a safe, favorable and profitable trading day.🥰🥰🥰🥰🥰

Non-farm payrolls are coming. Will it trigger the market?On Thursday, the US dollar index briefly rallied after the Federal Reserve's favorite inflation indicator unexpectedly rebounded, crossing the 100 mark for the first time in two months. This marked the sixth consecutive trading day of gains and the first monthly gain since 2025.
Spot gold rebounded as risk aversion lingered amid uncertainty surrounding Trump's tariff deadline, reaching a high of around $3,315, but its intraday gains narrowed after the release of the PCE data.
The dollar has already firmly established itself above the 100 mark on the daily chart, so the next target is likely to be between 101.5 and 102.0. Currently, support levels on the daily chart are visible at 99.5 and 99.0.
The gold market is currently consolidating in the 3315-3275 range. However, if the dollar rises again, Quaid believes gold prices could fall below 3275.
On the daily chart, if it falls below 3275, the price would likely be around 3250. If 3250 falls below, the market could test 3200. However, the possibility of a consolidation between 3315 and 3275 remains undisputed.
Before the release of the non-farm payroll data, scalping within this consolidation range is advisable. However, the risk is relatively high, so please take profits in time.
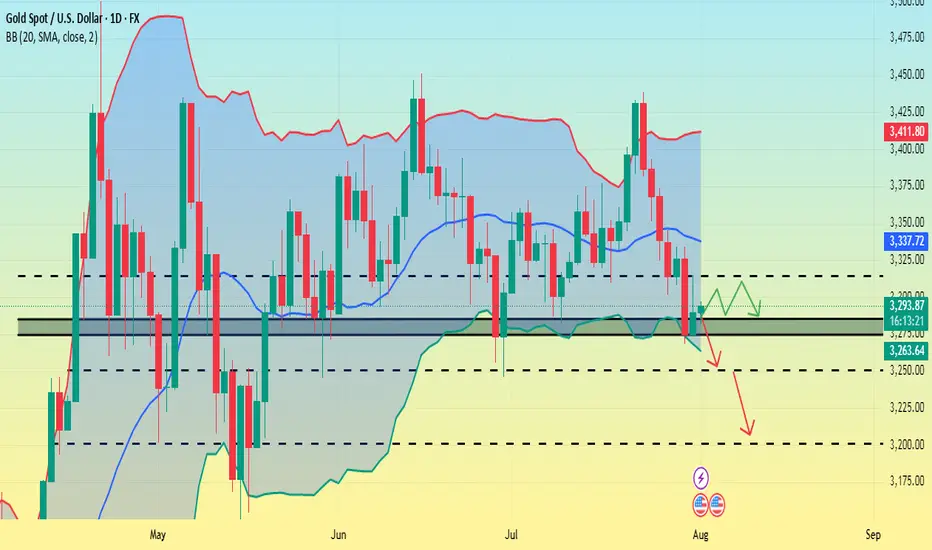
GOLD SHORT10 year bullrun is followed by a shorter term bearmarket. Gold is starting to lose its strength, which is a clear sign of weakness and the beginning of a bearish reversal.

Will gold prices continue to fall on August 1st?
Core Logic Analysis
Negative factors dominate
The Federal Reserve's hawkish stance: keeping interest rates unchanged and Powell suppressing expectations of a rate cut have weakened gold's safe-haven appeal.
Strong economic data: ADP employment data exceeded expectations, and coupled with the upcoming PCE and non-farm payroll data, market expectations of an early Fed rate cut have cooled.
Technical Breakdown: Gold prices fell below the key support level of $3,300, hitting a new monthly low. A large weekly bearish candlestick chart indicates bearish dominance.
Key Support and Resistance
Resistance: 3315 (hourly rebound resistance), 3333 (previous high and daily resistance).
Support: 3280-3290 (short-term), 3250-3245 (strong monthly support).
Potential Risks
Unexpectedly weak non-farm payroll data or escalating geopolitical tensions could trigger a short-term rebound, but a break above 3330 is required to reverse the downward trend.
Today's Trading Strategy
Short-Term Trading
Primarily short at highs: Short lightly on a rebound to 3310-3315, stop loss at 3325, target 3290-3280.
Aggressive Short: Add to short positions if the price reaches 3330-3333, stop loss at 3340, target 3280.
Cautious Long: Try a long position on the first touch of 3250-3245, stop loss at 3235, target 3270-3280 (quick in and out).
Mid-term Strategy
If the monthly line closes below 3250, shorting at high levels can be continued in August, targeting the 3150-3100 range.
If the gold price rebounds above 3350 after the non-farm payrolls, the trend needs to be reassessed.
Events to Watch
Data:
Non-farm payroll report on Friday (if the data exceeds expectations, gold prices may fall further).
US June PCE Price Index (Federal Reserve inflation indicator).
Technical Signal:
A daily close below 3250 would confirm a medium-term downtrend.
Observe the recapture of the 3300 level, which serves as a dividing line between bulls and bears.
Summary
Gold is currently in a bearish phase. Prioritize shorting on rallies, but be wary of unexpected data fluctuations. If the mid-line breaks below 3250, the market could target the 3000-3100 range. Conversely, if it holds above 3330, strategy adjustments will be necessary. Strictly stop loss and control risks.
XAUUSD GOLD The XAUUSD Gold price is approaching our target zone, where it will find strong support in EMA 100 if it does not comply with LSOB in small timeframes. In the 4H timeframe, the price has been making lower lows so far, so I recommend waiting a little and entering based on the daily timeframe from the lower zone.

XAUUSD Outlook – From Bias to Execution Previous day closed bearish, leading to a sell bias, On the 1H, I then identified a familiar chart pattern, a rising wedge, On the 45M, I then looked for a possible entry and exit zone.

GoldTVC:GOLD price overall is bearish and looks like during NFP tomorrow it does looks like it's bout to be drop all the way down. But what are your ideas guys let me know on the comment session

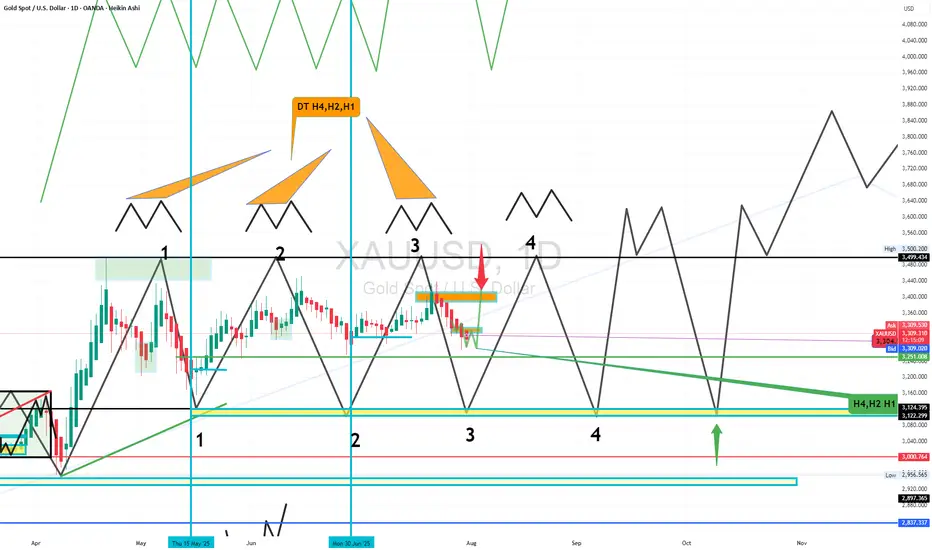
GOLD USDHI GUYS.
here we have daily path.
i expect pullback, retest to form double top h4, h2, h1 at number 3,
then we sell to clear numer 3 downwards.
currently its a buy . details on h4 chart
XAUUSD: Buy idea On XAUUSD we would have a high probability of having an uptrend depending on the configuration of the chart.

XAUUSD ideaWe are waiting for our asset to reach our action zone, and based on the reaction, we’ll decide on our next moves.ALWAYS WAIT FOR A CONFIRMATION TO SEE IF THE PRICE VALIDATES THE ZONE.and you what is your vision of the EURUSD its interests me! i wait you in the commentary

GOLD: Next Move Is Down! Short!
My dear friends,
Today we will analyse GOLD together☺️
The market is at an inflection zone and price has now reached an area around 3,328.24 where previous reversals or breakouts have occurred.And a price reaction that we are seeing on multiple timeframes here could signal the next move down so we can enter on confirmation, and target the next key level of 3,318.05..Stop-loss is recommended beyond the inflection zone.
❤️Sending you lots of Love and Hugs❤️
gold ranginggold is currently ranging underneath the broke of daily trendline.
possible falling wedge formation.
trade out of the wedge.

XAUUSD M45 Outlook XAUUSD
Liquidity grabbed ✅
Break of Structure & ChoCh confirmed ✅
Price taps into premium OB zone 🧠
Entry from refined supply zone 🎯
Risk:Reward 🔥
SL: 3348
TP: 3290
If this plays out, it's textbook Smart Money 👑
Risk managed. Emotions off. Let the market speak.

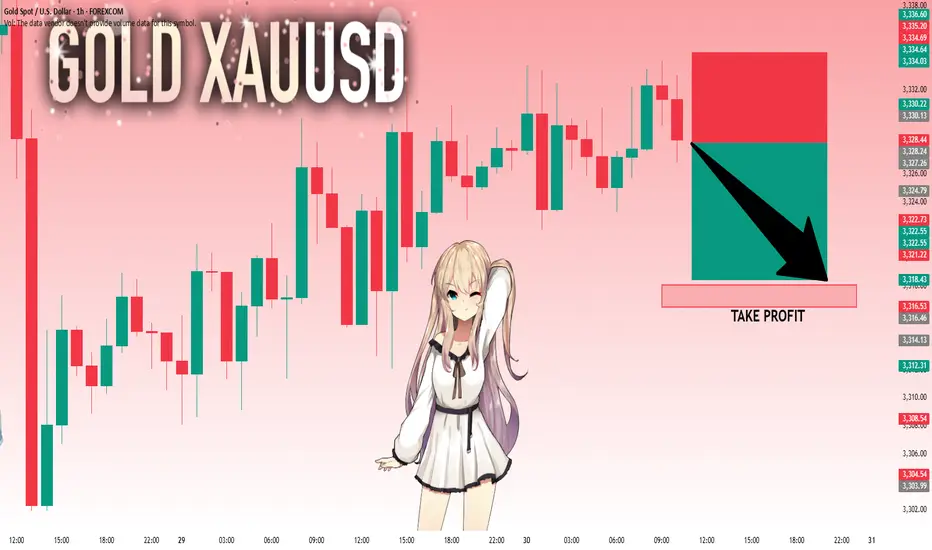
Gold intraday downside
Gold intraday: down trend, short position below 3335 with target 3296 and 3278. Long position 3274-3280.
